Open-File Report 2013-1020
High-Resolution Geophysical Data Collected Aboard the U.S. Geological Survey Research Vessel Rafael to Supplement Existing Datasets From Buzzards Bay and Vineyard Sound, Massachusetts

|
The following sections provide basic descriptions of shipboard acquisition and survey processing of geophysical and geospatial data contained in this report. Detailed descriptions of acquisition parameters, postprocessing steps, and accuracy assessments for each data type are provided within the metadata files for geospatial data layers in the appendix (Geospatial Data). Survey OperationsApproximately 70 km2 of the sea floor around the eastern Elizabeth Islands and sand shoals of Vineyard Sound were surveyed aboard the RV Rafael between 2007 and 2011 (fig. 2; fig. 3; and table 1). Interferometric bathymetry and backscatter, sidescan-sonar, and chirp seismic-reflection systems were deployed simultaneously during cruise 2011–013–FA. Cruises 2007–039–FA and 2009–068–FA collected only interferometric-sonar bathymetry and backscatter, and cruises 2010–100–FA and 2010–47–FA deployed only a multichannel boomer seismic-reflection system. The RV Rafael can survey in water depths as shallow as 2 meters (m), so the data collected during these surveys are intended to fill gaps and augment data previously collected within Buzzards Bay and Vineyard Sound where larger vessels could not survey because of draft restrictions. Positioning for the ship, sub-bottom, and sidescan sonar was determined using a Communications Systems International, Inc. (CSI) LGBX Pro differential global positioning system (DGPS) antenna mounted above the cabin on the RV Rafael during surveys in 2010 and 2011. Swath bathymetry positioning, sound velocity at the sonar head, and attitude were determined using a CodaOctopus F180 DGPS antenna mounted on a rigid, vertical pole approximately 3 m above the swath transducers (fig. 3). A NovAtel DL-V3 real-time kinematic (RTK) antenna, also mounted above the swath transducers, was used to determine water-level heights for tidal corrections. Ship positions were recorded to HYPACK, Inc., hydrographic survey software (version 9.0.5.9). Table 1. Survey and equipment details for the data collected in the study areas of Buzzards Bay and Vineyard Sound, Massachusetts from 2007 to 2011.
During acquisition, the RV Rafael maintained speeds between 1.5 and 2.5 meters per second (m/s). Data were collected along tracklines spaced between 30 and 100 m apart. Trackline spacing was designed to ensure overlap of adjacent interferometric swaths. Interferometric-Sonar BathymetryNearly 1100 kilometers (km) of interferometric data were collected with an Systems Engineering and Assessment, Ltd. (SEA) SWATHplus 234-kilohertz (kHz) interferometric-sonar system during 3 surveys (2011–013–FA, 2007–039–FA, and 2009–68–FA; table 1; fig. 4). Vessel-motion (heave, pitch, roll, and yaw) and swath data were recorded simultaneously using a CodaOctopus F180 attitude and positioning system. The SWATHplus transducers and F180 were mounted to a rigid, vertical pole submerged from the bow of the RV Rafael, with the F180 mounted directly above the SWATHplus transducers, at a depth of approximately 0.5 m below the sea surface. The speed of sound at the transducer face was monitored continuously with an AML Oceanographic Micro SV velocimeter mounted at the sonar heads. Horizontal and vertical offsets between the antennae and the F180 and SWATHplus transducers were applied and recorded in the F180 and SWATHplus configuration files. DGPS navigation was used to record horizontal and vertical positions of the soundings during acquisition. RTK corrections were transmitted to a DGPS receiver on the survey vessel once every second from a base station in Falmouth, MA and a repeater on Martha's Vineyard. RTK vertical heights were used to correct tidal offsets during postprocessing. Sound velocity profiles (SVP) of the water column were acquired with an AML Oceanographic SV Plus V2 hand-deployed velocimeter. Profiles were collected at least once during each survey day and multiple times per day when the data suggested significant stratification within the water column. Cast locations, graph images, and comma-delimited data files for each profile are available for download in the appendix (Geospatial Data). Collection and processing of bathymetric data were performed with Swath Processor software (version 3.7.17). Vessel motion data recorded by the F180 were used to account for heave, pitch, roll, and yaw of the vessel, and filters were applied to remove spurious soundings. Sound velocity profiles were applied within the Swath Processor software during processing to correct errors resulting from changes in the speed of sound within the water column. After processing in Swath Processor software, soundings were imported into CARIS hydrographic information processing system (HIPS) software (version 8) for further processing. RTK-corrected, water-level-height offsets were applied to reference soundings to mean lower low water (MLLW), and remaining spurious soundings were removed by further filtering and manual swath editing. Bathymetric surfaces were created at 2.0-meter per pixel (mpp) resolution grids and were exported from HIPS in x,y,z format for import into Environmental Systems Research Institute (Esri) ArcMap. Grids and hillshaded relief of the bathymetry were created at 2.0- and 5.0-mpp resolutions (fig. 5). BackscatterSidescan-sonar (acoustic-backscatter) data were acquired with a Klein 3000 dual-frequency (100 and 500 kHz) sidescan-sonar system for most of survey 2011–013–FA (table 1 and fig. 6). The sidescan-sonar fish was towed approximately 3 m astern from a davit located on the port side of the RV Rafael. Klein SonarPro acquisition software (version 12.0) was used to log the data digitally at a sample rate that resulted in raw pixel resolutions of approximately 0.18 and 0.14 m in the across-track and along-track directions, respectively. Horizontal offset values between the sidescan fish and CSI DGPS antenna were recorded in SonarPro, which calculated fish position dynamically during acquisition. The Klein system produced usable data over swath widths of 150 m. XSonar/ShowImage software (version 2.0) was used to correct for geometric and radiometric distortions in the raw sidescan data (Danforth, 1997), and PCI Geomatics software (version 10.1) was used to create georeferenced mosaics of the final, processed data. Surveys 2007–039–FA and 2009–068–FA did not collect Klein sidescan-sonar data and the instrument was malfunctioning for five lines during survey 2011–013–FA (table 1). In these areas, swath interferometric backscatter was used in place of Klein sidescan data to complete a backscatter mosaic image (fig. 6). Interferometric backscatter data from the SEA SWATHplus system were processed using an an empirical gain normalization function (Finlayson, 2011) available within Chesapeake Technology's SonarWiz (version 5.0). Backscatter data were acquired along approximately 940 kilometers (km) of trackline, yielding a total mosaic area of about 70 km2. Eight-bit grayscale GeoTIFF images of mosaics for both Klein sidescan and swath interferometric backscatter were produced at 1.0-mpp resolution (fig. 7). Seismic-Reflection ProfilesApproximately 195 km of high-resolution multichannel boomer seismic-reflection profiles were collected during two surveys (2010–047–FA and 2010–100–FA; fig. 8). The Applied Acoustics boomer source was towed on the starboard side of the RV Rafael, 10 m aft of the GPS antenna, and was fired at a power level of 100 joules at 1-second intervals with trace lengths of 250 milliseconds (ms) and 1000 samples per trace. The Geometrics GeoEel, an eight-channel, liquid-filled digital streamer, was towed from the port side of the vessel, with the center of the first channel of the active section 22 m aft of the boomer source. The streamer had a group interval of 3.125 m connected to Geometrics Streamer Power Supply Unit (SPSU). Data were acquired in Society of Exploration Geophysicists D (SEG-D) format using Geometrics CNT-1 software. The sample interval was 0.25 ms. During survey 2011–013–FA, approximately 940 km of high-resolution chirp seismic data (fig. 8) was collected using a dual-frequency (3.5 and 200 kHz) Knudsen Engineering Limited (KEL) Chirp 3202 system with transducers mounted on a rigid pole on the starboard side of the RV Rafael. Knudsen SounderSuite seismic acquisition software (version 2.64) was used to control the Chirp 3202 system, digitally log trace data in the Society of Exploration Geophysicists Y (SEG-Y) Revision 1 format (Norris and Faichney, 2002), and record DGPS navigation coordinates to the SEG-Y trace headers in arc seconds. The transducer draft was 0.5 m below the water surface, and the draft offset was accounted for during data acquisition. Data were acquired at a peak frequency of 3.5–5.0 kHz, a 0.25- or 0.2-second fire rate (4 or 5 shots per second), a 36-38 microsecond sample interval, and record lengths between 26 and 130 ms. SIOSEIS (Henkart, 2011), Seismic Unix (Stockwell and Cohen, 2007), and AWK software were used to process all of the raw seismic-reflection data (both boomer and chirp). Final trace data, plotted as Portable Network Graphics (PNG) images, and geospatially located trackline files are presented in the appendix (Geospatial Data) of this report. Detailed processing steps for both boomer and chirp data are included in the metadata.
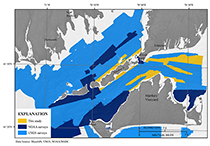
SamplingSampling surveys within Vineyard Sound and Buzzards Bay were carried out aboard the RV Connecticut and the U.S. Environmental Protection Agency’s ocean survey vessel (OSV) Bold during USGS field activities 2010–005–FA and 2011–015–FA. These data were collected to ground-truth the geophysical survey data and aid interpretive geologic maps. These sampling survey data will be published in a separate report and will include sediment sample analyses, bottom photography and video, and benthic biota classifications. Additional Sample and Geophysical DataAdditional geophysical and geologic data, including swath-bathymetric, acoustic-backscatter, seismic-reflection, and sampling data, are available for other areas within Buzzards Bay and Vineyard Sound, Massachusetts (fig. 2). Some of these data were collected as part of the cooperative mapping program between the USGS and the Massachusetts Office of Coastal Zone Management, whereas other data were collected by the USGS or NOAA. Internet links to the data and information about these datasets are listed below:
|
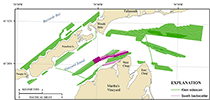
Figure 2. The 2010-0003-FA survey area is shown along with other USGS and NOAA survey areas around the Elizabeth Islands. This small boat survey was completed to fill gaps in the shallow water areas around the eastern Elizabeth Islands and along sand shoals of Vineyard Sound.
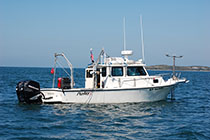
Figure 3. U.S. Geological Survey research vessel Rafael showing the configuration of acquisition equipment. The RTK GPS antennae and the swath interferometric sonar head are located off the bow, and the Klein 3000 sonar system and the Edgetech 424 bottom profiler are deployed from the port and starboard sides, respectively. Photograph by Dave Foster.
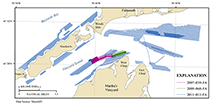
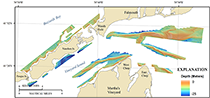
Figure 4. Map showing tracklines along which bathymetric depth data were collected in Buzzards Bay and Vineyard Sound, Massachusetts. Tracklines are color-coded by U.S. Geological Survey (USGS) field activity serial number. Is., Island. Figure 5. Map showing interpolated, shaded-relief bathymetry of the sea floor collected in Buzzards Bay and Vineyard Sound,, Massachusetts. Coloring represent depths in meters, relative to mean lower low water.
Figure 6. Map showing acoustic-backscatter intensity tracklines from both the Klein 3000 dual frequency sidescan sonar system and the swath interferometric system collected in Buzzards Bay and Vineyard Sound, Massachusetts.
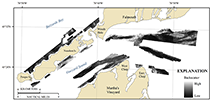
Figure 7. Map showing acoustic-backscatter intensity collected in Buzzards Bay and Vineyard Sound, Massachusetts. Backscatter intensity is an acoustic measure of the hardness and roughness of the sea floor. In general, higher values (light tones) represent rock, boulders, cobbles, gravel, and coarse sand. Lower values (dark tones) generally represent fine sand and muddy sediment.
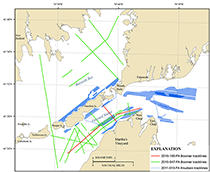
Figure 8. Map showing Knudsen and Boomer seismic-reflection tracklines collected in Buzzards Bay and Vineyard Sound, Massachusetts, survey area. Tracklines are color-coded by U.S. Geological Survey (USGS) field activity number. Is., Island; |

![]() U.S. Department of the Interior |
U.S. Geological Survey
U.S. Department of the Interior |
U.S. Geological Survey
URL: http://pubsdata.usgs.gov/pubs/of/2013/1020/html/ofr2013-1020_methods.html
Page Contact Information: GS Pubs Web Contact
Page Last Modified: Wednesday, 12-Mar-2014 17:11:34 EDT