Skip past header information
USGS - science for a changing world

Open-File Report 2013-1020


High-Resolution Geophysical Data Collected Aboard the U.S. Geological Survey Research Vessel Rafael to Supplement Existing Datasets From Buzzards Bay and Vineyard Sound, Massachusetts


List of Figures

Skip past contents information

Figures

Map showing the locations of the bathymetric survey areas (2011–013–FA, 2007–039–FA, and 2009–068–FA) around the eastern Elizabeth Islands and Martha's Vineyard, Massachusetts (outlined in red), and boomer tracklines from surveys 2010–100–FA and 2010–047–FA shown as dashed lines in Vineyard Sound and Buzzards Bay. Is., Island; UTM, Universal Transverse Mercator.

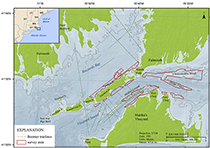
Figure 1. Map showing the locations of the bathymetric survey areas (2011–013–FA, 2007–039–FA, and 2009–068–FA) around the eastern Elizabeth Islands and Martha's Vineyard, Massachusetts (outlined in red), and boomer tracklines from surveys 2010–100–FA and 2010–047–FA shown as dashed lines in Vineyard Sound and Buzzards Bay. Is., Island; UTM, Universal Transverse Mercator.

Map showing bathymetric survey areas (2011–013–FA, 2007–039–FA, and 2009–068–FA) discussed in this report along with areas of other U.S. Geological Survey (USGS) and National Oceanic and Atmospheric Administration (NOAA) surveys in Buzzards Bay and Vineyard Sound, Massachusetts. Areas surveyed in this study are shown in yellow. This small-boat survey was completed to fill gaps in the shallow-water areas around the eastern Elizabeth Islands and Martha's Vineyard, Massachusetts. Is., Island. See the “additional sample and geophysical data” section under “Data Collection and Processing” for more information regarding the other USGS and NOAA surveys shown in this map. 
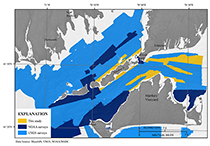
Figure 2. Map showing bathymetric survey areas (2011–013–FA, 2007–039–FA, and 2009–068–FA) discussed in this report along with areas of other U.S. Geological Survey (USGS) and National Oceanic and Atmospheric Administration (NOAA) surveys in Buzzards Bay and Vineyard Sound, Massachusetts. Areas surveyed in this study are shown in yellow. This small-boat survey was completed to fill gaps in the shallow-water areas around the eastern Elizabeth Islands and Martha's Vineyard, Massachusetts. Is., Island. See the “additional sample and geophysical data” section under “Data Collection and Processing” for more information regarding the other USGS and NOAA surveys shown in this map.
Photograph showing the configuration of acquisition equipment on the U.S. Geological Survey research vessel Rafael. The real-time kinematic (RTK) global positioning system (GPS) antennae and the swath interferometric-sonar head are located off the bow, and the Klein 3000 sonar system and the Knudsen chirp bottom profiler are deployed from the port and starboard sides, respectively. Photograph by David Foster. 
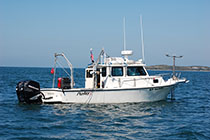
Figure 3.Photograph showing the configuration of acquisition equipment on the U.S. Geological Survey research vessel Rafael. The real-time kinematic (RTK) global positioning system (GPS) antennae and the swath interferometric-sonar head are located off the bow, and the Klein 3000 sonar system and the Knudsen chirp bottom profiler are deployed from the port and starboard sides, respectively. Photograph by David Foster.
Map showing tracklines along which bathymetric depth data were collected in Buzzards Bay and Vineyard Sound, Massachusetts. Tracklines are color-coded by U.S. Geological Survey (USGS) field-activity serial number. Is., Island. 
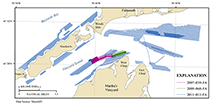
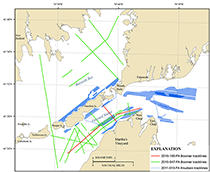
Figure 4.Map showing tracklines along which bathymetric depth data were collected in Buzzards Bay and Vineyard Sound, Massachusetts. Tracklines are color-coded by U.S. Geological Survey (USGS) field-activity serial number. Is., Island.
Map showing interpolated, shaded-relief bathymetry of the sea floor collected in Buzzards Bay and Vineyard Sound, Massachusetts. Coloring represents depth in meters, relative to mean lower low water, with warm colors indicating shallows and cool colors indicating deep areas. Is., Island

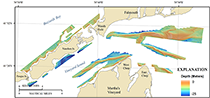
Figure 5. Map showing interpolated, shaded-relief bathymetry of the sea floor collected in Buzzards Bay and Vineyard Sound, Massachusetts. Coloring represents depth in meters, relative to mean lower low water, with warm colors indicating shallows and cool colors indicating deep areas. Is., Island

Map showing acoustic-backscatter-intensity tracklines from both the Klein 3000 dual-frequency sidescan-sonar system (green) and the swath interferometric system (magenta) collected in Buzzards Bay and Vineyard Sound, Massachusetts, during surveys 2011–013–FA, 2009–068–FA, and 2007–039–FA. Tracklines are color-coded by the collection system. Is., Island.

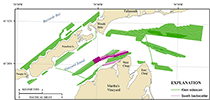
Figure 6. Map showing acoustic-backscatter-intensity tracklines from both the Klein 3000 dual-frequency sidescan-sonar system (green) and the swath interferometric system (magenta) collected in Buzzards Bay and Vineyard Sound, Massachusetts, during surveys 2011–013–FA, 2009–068–FA, and 2007–039–FA. Tracklines are color-coded by the collection system. Is., Island.


Map showing acoustic-backscatter intensity collected in Buzzards Bay and Vineyard Sound, Massachusetts. Backscatter intensity is an acoustic measure of the hardness and roughness of the sea floor. In general, higher values (light tones) represent rock, boulders, cobbles, gravel, and coarse sand. Lower values (dark tones) generally represent fine sand and muddy sediment. Is., Island.

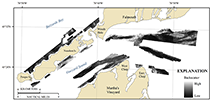
Figure 7. Map showing acoustic-backscatter intensity collected in Buzzards Bay and Vineyard Sound, Massachusetts. Backscatter intensity is an acoustic measure of the hardness and roughness of the sea floor. In general, higher values (light tones) represent rock, boulders, cobbles, gravel, and coarse sand. Lower values (dark tones) generally represent fine sand and muddy sediment. Is., Island.


Map showing acoustic-backscatter intensity collected in Buzzards Bay and Vineyard Sound, Massachusetts. Backscatter intensity is an acoustic measure of the hardness and roughness of the sea floor. In general, higher values (light tones) represent rock, boulders, cobbles, gravel, and coarse sand. Lower values (dark tones) generally represent fine sand and muddy sediment. Is., Island.

Figure 8. Map showing Knudsen and Boomer seismic-reflection tracklines collected in Buzzards Bay and Vineyard Sound, Massachusetts. Tracklines are color-coded by U.S. Geological Survey (USGS) field-activity number. Is., Island.


Accessibility FOIA Privacy Policies and Notices

Take Pride in America logo USA.gov logo U.S. Department of the Interior | U.S. Geological Survey
URL: http://pubsdata.usgs.gov/pubs/of/2013/1020/html/ofr2013-1020_listofigs.html
Page Contact Information: GS Pubs Web Contact
Page Last Modified: Wednesday, 12-Mar-2014 17:12:08 EDT