Open-File Report 2014–1159
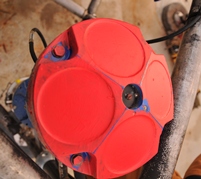
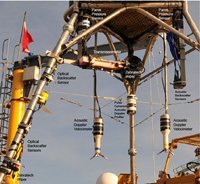
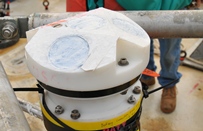
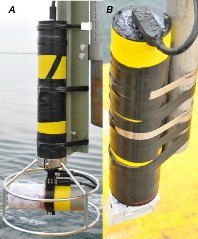
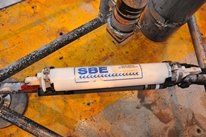
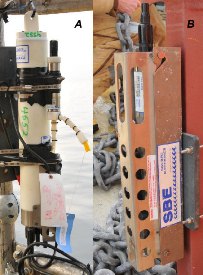
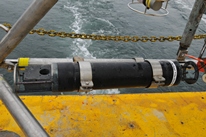
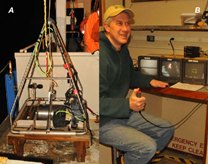
InstrumentationA variety of instruments were used to measure water flow, sea level, temperature, wave characteristics, near-bottom turbulence, and suspended-sediment concentrations. These instruments were deployed from January 2012 through April 2012 on a variety of platforms, as described on the Field Program page. Data were recorded at sampling schemes specific to each instrument, as summarized in the Appendix - Instrument Log. More specific details of the sampling strategy for each instrument are provided in the data file attributes. After recovery, data were downloaded and processed by using established techniques (see the Data Processing page) to convert data from proprietary formats to scientific units. Provided below are brief descriptions for the instruments used during this study. Unless otherwise noted, the descriptions are quoted from Montgomery and others (2008). A complete description of all equipment and data-processing methods is provided in Montgomery and others (2008). Any use of trade, product, or firm names is for descriptive purposes only and does not imply endorsement by the U.S. Government. Jump to Teledyne RD Instruments (TRDI)Acoustic Doppler Current Profiler (ADCP)Triton Acoustic Doppler Velocimeter (ADV) SonTek Pulse-Coherent Acoustic Doppler Profiler (PCADP) Aquatec Acoustic Backscatter Sensor (ABS) Nortek Acoustic Wave and Current Profiler (AWAC) Imagenex Rotating Sonar Paroscientific Pressure Sensor (Paros) Sea-Bird Electronics (SBE) Seagauge Sea-Bird SEACAT Sea-Bird MicroCAT D&A Instruments Optical Backscatter Sensor (OBS) Laser In Situ Suspended Scattering and Transmissometry (LISST) Transmissometer Mini SeaBOSS Meteorological Sensors Teledyne RD Instruments (TRDI) Acoustic Doppler Current Profiler (ADCP)"Most of the ADCP data in the USGS time-series archive were obtained using Teledyne-RD Instruments hardware with a four-beam orthogonal (Janus) configuration. When installed with waves acquisition firmware, RDI-ADCPs also record three different types of time series from which wave properties may be computed: pressure, range to surface along each orthogonal beam (that is, water level), and orbital velocities of the surface waves taken from three bins nearest the surface in each of the four beams. It is possible to estimate non-directional wave energy spectra, and thus wave height and period, from any of the three time series, but the orbital-velocity time series are required for definition of the directional distribution of the wave energy. References for the principles of operation for the Doppler water-flow measurement technique can be found at:http://www.rdinstruments.com. RDI-ADCPs may be used in a pulse coherent or non-pulse coherent mode, depending on the desired measurement accuracy and the size and location of the measurement volume. These are monostatic instruments." TRDI ADCPs (600-KHz (kilohertz)Workhorse or 1200-KHz Workhorse, fig. 6) were deployed at sites 1, 2, 4, 5, and 7. This report includes processed ADCP water-flow and wave-measurement data. Sontek Triton Acoustic Doppler Velocimeter (ADV)"An ADV measures current speed and direction at a single point in a sampling volume of approximately 2-cm3 using the Doppler principle and the difference between signal returns at the three receivers (bistatic). The instrument can sample both currents and pressure at high frequencies in multiple sampling schemes and rates, and store the complete raw data set, allowing for the calculation of wave and turbulence parameters. The ADVs used by the USGS are typically mounted on tripods, facing downward. They are unique in their ability to sample three components of flow with accuracies of less than 0.3 cm/s at rates of up to 25 Hz." The Triton-ADV system (fig. 7) was deployed on the Flobees at sites 1 and 2. This report includes processed ADV water-flow data. SonTek Pulse-Coherent Acoustic Doppler Profiler (PCADP)"The SonTek PCADP is a pulse coherent Doppler profiler. Compared to the non-pulse coherent instruments above, the PCADPs achieve higher spatial resolution. They can measure water-flow measurement regions as short as 1.6 cm along the beam, as opposed to more typical 50 cm for non-pulse coherent instruments. This capability is particularly useful to the USGS for measuring flows within a few meters of the sea bed. The PCADP is a monostatic instrument." A SonTek Pulse-Coherent Acoustic Doppler Profiler hydra system (fig. 7) was deployed on the Flobees at sites 1 and 2, in synchrony with an Aquatec ABS. Processed PCADP water-flow data are included in this report. Aquatec Acoustic Backscatter Sensor (ABS)"An Aquatec ABS is a multifrequency acoustic backscatter instrument that logs profiles of backscatter intensity from sound pulses delivered at different frequencies. Use of multiple frequencies allows interpretation of the backscatter data according to different sediment-size ranges. The unit logs bursts of backscatter intensity, allowing high-resolution measurement in time and space. This system is monostatic, and the gain applied to the return signal is linear, to provide more consistent return over the length of the profile than ADCP-received signal gains, which are designed to maximize the range of the instrument." An Aquatec ABS (fig. 7) was deployed at the North Site on the minipod. This report includes ABS backscatter data. Nortek Acoustic Wave and Current Profiler (AWAC)The Nortek AWAC (fig. 8) measures water flow by using Doppler principles. The AWAC, like other acoustic water-flow instruments, measures the Doppler shift that occurs when acoustic beams reflect from scatterers that are carried by the water. The AWAC has a central beam and uses Acoustic Surface Tracking (AST) to directly measure the distance to the sea surface. The AWAC uses a hybrid solution representing both AST and PUV measurements to allow for better coverage of the wind wave band. Nortek AWACs were deployed on micropods at sites 3 and 6. Processed AWAC water-flow and wave data are included in this report. Imagenex Rotating Sonar"Two types of sonars made by Imagenex have been used to document changes in the seafloor over time. Each sonar emits a pulse or beam of high frequency sound over the seafloor and the sound reflects off objects and topographic features. The length of time required for reflected sound to return to the sensor is used to map seafloor bedforms like sand waves and ripples. The 881A (fig. 9A) makes repeated linear scans perpendicular to the head. Actual heights of the seafloor along the scan can be computed from this sonar data. The 881 (fig. 9B) fan sonar samples many lines as it rotates through a pre-programmed arc, allowing a "snapshot" of the seafloor within 3 to 5 meters of the head to be created." Rotating sonar were deployed on minipods at sites 1 and 2. Raw sonar data are not included in this report but are available upon request. Paroscientific (Paros) Digiquartz; Pressure Sensors"Pressure in the ocean is typically measured using either a strain gauge or quartz crystal resonator. Strain gauge sensors are metallic foils on a flexible backing which sense deformation, due to the induced stress of pressure. Quartz crystal resonators measure pressure by detecting the change in frequency of oscillation of the resonator due to induced stress. The output pressure is compensated for temperature by using the signal from temperature-sensitive crystals which are a component of the instrument. Strain gauge sensors typically have 0.1% of full scale accuracy while the resonators are accurate to about 0.01% of full scale and more stable over long periods of time with less hysteresis. Quartz sensors are generally preferred where high-accuracy is needed, for example to measure the surface wave signal at depth. Strain gauge sensors are used where a simple measure of water depth, for example mooring or instrument depth, is needed. Most pressure data in the time-series database have been collected using Paroscientific quartz crystal sensors. The strain gauge sensors are generally an integral part of data logging systems and are not tracked as separate instruments. Pressure data will be found as variables in Seacat, Microcat, ADV, PCADP, and MIDAS files." Paros quartz crystal pressure sensors (fig. 7)were deployed on the Flobee tripods at sites 1 and 2. The sampling interval was matched to that of the ADVs (above). Processed Paros pressure data are included in this report. Sea-Bird Electronics (SBE) SeagaugeThe following SBE seagauge description is quoted from http://www.seabird.com/products/spec_sheets/26plusdata.htm. "The SBE 26plus combines a precision thermometer and quartz-crystal pressure sensor to provide wave and tide recording of high resolution and accuracy, along with high-quality temperature information. The SBE 26plus integrates pressure samples to obtain water-level measurements unaffected by wave action, and it independently burst-samples pressure at rates up to 4 hertz for wave-amplitude calculation. Water-level and wave-burst sampling intervals and durations are programmable. Temperature data are recorded with each tide integration. Waves are characterized by burst sampling, with programmable burst interval, number of samples per burst, and burst integration time." Data are recorded internally on flash random-access memory (RAM). An SBE 26plus (fig. 10) was deployed at site 7. Processed seagauge data are included in this report. Sea-Bird Electronics (SBE) SEACAT"The Sea-Bird SEACAT 16 is a versatile datalogger that records output from SBE-3 temperature and SBE-4 conductivity cells and, depending on options, can power and record additional sets of temperature and conductivity sensors as well as external sensors. These instruments can also flush the sensors to reduce fouling. They are used by USGS where salinity, temperature and other measurements (such as turbidity, see below) are required. When deployed on bottom tripods, the instruments can be equipped with pumps to flush the sensor ducts and reduce salinity errors resulting from sediment accumulation in the cells. Pumping generally is not necessary on moorings, because mooring motions flush the sensor and prevent sediments from accumulating in the conductivity cell. Auxiliary external sensors, such as those for dissolved oxygen, pH, or turbidity, may be attached to the instrument. Data are recorded internally on flash RAM." Seacats (fig. 11A) were deployed on tripods at sites 1, 2, 3, 6, and 7. Processed Seacat conductivity, temperature, and salinity data are included in this report. Sea-Bird MicroCAT"The Sea-Bird MicroCAT CTD is a low cost full ocean capable datalogger that records output from integral SBE-3 temperature and SBE-4 conductivity cells. Data are recorded internally on flash RAM. They are used where salinity and temperature measurements are needed." Sea-Bird MicroCATs were deployed on the North Surface buoy, the North Flobee, and South Flobee tripods (fig. 11B). This report includes processed MicroCAT conductivity, temperature, and salinity data. D&A Instruments Optical Backscatter Sensor (OBS)"An OBS measures turbidity by sending a beam of infrared light into the water and measuring the quantity of light scattered off suspended particles and reflected back to the sensor. Calibration coefficients are then employed to determine suspended sediment concentration. OBS are more sensitive to coarse- grained particles than transmissometers and are less susceptible to fouling. USGS has used D&A Instrument Company OBS-3, Seapoint OBS sensors, and Wet Labs OBS sensors with antifouling wipers . Accuracy is dependent on calibration methods, which are specific to the experiment. OBS sensors are typically used on bottom tripods." OBSs were deployed on Flobee tripods at sites 1 and 2 (fig. 7). The sampling intervals used for the OBSs match those of the ADVs deployed. This report includes raw OBS backscatter data. Laser In Situ Suspended Scattering and Transmissometry (LISST)"The LISST, manufactured by Sequoia Scientific Inc., uses laser diffraction to obtain particle-size distributions of the sediment suspended in the sensing volume. This sensor provides the diameter of particles as opposed to their density. Collimated light is passed through a volume of water, where the suspended particles diffract the beams, and several ring-type detectors at the receiver are used to isolate sub-ranges of angles scattered." The LISST (fig. 12) was deployed on the minipod at site 2. LISST data are not included in this report but are available upon request. Transmissometer"A transmissometer measures the percentage of light transmitted along a fixed path. U.S. Geological Survey data have typically been collected with Sea Technology and Wetlabs C-Star transmissometers in 5- and 25-cm path lengths. These sensors use light from a red Light Emitting Diode (LED) (650-nm (nanometer)wavelength). The signals commonly decay with time as the optical windows become fouled. When the fouling during a deployment is extreme, transmissometer data may be truncated as part of the processing. In other cases, the data remain, as fluctuations may be observed despite the decreased signal." Transmissometers (fig. 7) were deployed on the Flobee tripods at sites 1 and 2. Two transmissometers were attached to each tripod, one near the top and one near the midrange of the tripod height (see Appendix - Instrument Log for instrument locations on each Flobee). Mini SEABOSSThe SEABed Observation and Sampling System (SEABOSS, fig. 13) was designed by the USGS for collection of seabed images and sediment samples in coastal regions (Valentine and others, 2000). The Mini SEABOSS is a lighter-weight version designed to work in coastal environments. In addition to a Van Veen bottom grab sampler the Mini SEABOSS includes two video cameras, a digital still camera, and light sources. The Mini SEABOSS is designed to maintain orientation relative to the research vessel. The digital camera annotates images with scale, exposure number, and time. Time is correlated to a location by using the navigation record. The visual-survey and sediment-sample data are not included in this report but are available upon request. Meteorological SensorsThe buoy at site 2 (fig. 5) was equipped with meteorological sensors listed in table 1. Table 1. Meteorological sensors mounted on the buoy at site 2.
|

![]() U.S. Department of the Interior |
U.S. Geological Survey
U.S. Department of the Interior |
U.S. Geological Survey
URL: http://pubsdata.usgs.gov/pubs/of/2014/1159/ofr2014-1159-instruments.html
Page Contact Information: GS Pubs Web Contact
Page Last Modified: Wednesday, 07-Dec-2016 20:05:29 EST