Open-File Report 2014-1159
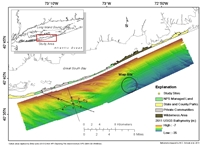
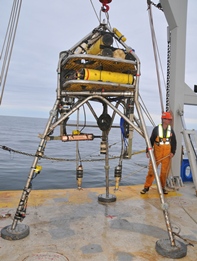
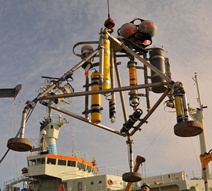
IntroductionThe U.S. Geological Survey (USGS), in cooperation with the University of South Carolina, is investigating ocean circulation and sediment-transport processes offshore of Fire Island, New York. This experiment focused on an area near the western end of the island where offshore sand ridges extend across the inner continental shelf and connect to the nearshore bar system. These ridges, oriented obliquely to the coastline, are on the order of 5 to 10 kilometers (km) long and are spaced several kilometers apart (fig. 1). The USGS mapped these features at high resolution (generally 300–325 meters (m) apart cross-shore, 5 km apart alongshore) in 2011, providing detailed bathymetry, subsurface structure, and surface texture (Schwab and others, 2013). The ridge field can modify surface waves from storms, causing complex wave patterns along the coastline and influencing sediment-transport and coastal-erosion patterns (Martini, Warner, List, Armstrong, Voulgaris, and Schwab, 2012). This study is part of a larger effort by the USGS, in cooperation with the U.S. Army Corps of Engineers (USACE) and the National Park Service (NPS), to study coastal processes on Fire Island. The offshore efforts described here were coordinated with nearshore beach surveys, light detection and ranging (lidar), and aerial photography to assess coastal change during winter storms (National Park Service, 2012; Hapke and others, 2013). Instruments were positioned on the seafloor in lines along the ridge crests and in lines that crossed the crests and troughs (fig. 1) for investigation of the ocean circulation and wave refraction across the offshore sand ridges. Site 1 (at the top of a ridge) and site 2 (at the bottom of an adjacent trough) were populated with high-resolution flow tripods (Flobee, fig. 2) holding similar instrumentation. Measurements that would interfere with sensors on the Flobees were made from smaller tripods (minipod, fig. 3) deployed alongside the Flobees at sites 1 and 2. At sites 3 through 7, a single tripod holding fewer instruments was placed with the primary objective of measuring current speed and direction, temperature, salinity, surface waves, and bottom stress (the force created at the seabed by currents and waves). Surface buoys were deployed at sites 1 through 6 to mark the tripod locations and to serve as platforms for surface measurements. Instruments deployed with each tripod are described in the subsequent sections. This data report presents background information on the impetus for studying coastal change processes in the nearshore area at Fire Island; a description of the field program, including the oceanographic instrumentation used to collect data; and the data-processing and archival techniques used. The edited data are presented in time series plots for rapid visualization of the dataset and in data files, which are in the Network Common Data Form (NetCDF). |
|

![]() U.S. Department of the Interior |
U.S. Geological Survey
U.S. Department of the Interior |
U.S. Geological Survey
URL: http://pubsdata.usgs.gov/pubs/of/2014/1159/ofr2014-1159-introduction.html
Page Contact Information: GS Pubs Web Contact
Page Last Modified: Wednesday, 07-Dec-2016 20:05:30 EST