Open-File Report 2014–1159
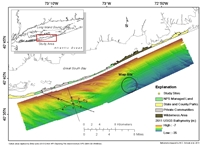
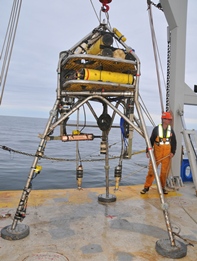
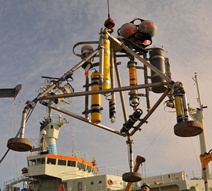
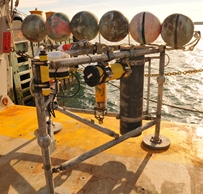
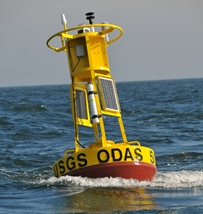
Field ProgramThis page describes the deployment locations and the equipment mounted at each site. Six buoys and nine tripods were deployed off Fire Island from the research vessel (RV) Connecticut during two trips from January 23 to 26, 2012. Bathymetric survey data produced by the USGS in 2011 (Schwab and others, 2013) and depth readings taken on site were used to finalize the tripod positions. The Mini SEABOSS (SEABed Observation and Sampling System) was used to make visual surveys of the seabed and take sediment samples (Valentine and others, 2000). All of the gear was recovered aboard the RV Connecticut from April 16 to 20, 2012. Additional information on new instrumentation used during the field program can be found in Martini, Warner, List, Armstrong, and Montgomery (2012). Deployment and recovery dates, depths, instrument types, instrument locations as heights above the bottom in centimeters (CMAB), observations at each site, sampling intervals, and sampling schemes are summarized for each site in the Appendix - Instrument Log (pdf format). Flobees and Minipods, Sites 1 and 2 The instruments at sites 1 and 2 were designed to provide measurements near the seafloor. Flow tripods 3.5 meters high (Flobee, fig. 2) were deployed at sites 1 and 2 to provide high-sampling-frequency measurements at various heights off the seabed (see Appendix - Instrument Log). Each Flobee included a conductivity/temperature/depth (CTD) sensor, two acoustic Doppler velocimeters (ADV) to measure current speed and direction at a single point, and a downlooking pulse-coherent acoustic Doppler profiler (PCADP) to measure current velocities within one meter of the bottom. Sediment resuspension was measured by two 25-centimeter (cm) transmissometers, three optical backscatter sensors (OBS), and an acoustic backscatter sensor (ABS). Pressure was measured by two Paros pressure sensors. The site-1 Flobee tripod was deployed at 40.6043° N., -73.1089° W., on the seafloor at a water depth of 20.15 m. In addition to the instrumentation listed above, an uplooking Sentinel V acoustic Doppler current profiler (ADCP) was on the top of this tripod, but the instrument flooded, and no data was recovered. The site-2 Flobee tripod was deployed at 40.6084° N., -73.0916° W., on the seafloor at a water depth of 23.53 m. Measurements that would interfere with sensors on the Flobee were made from a smaller tripod (minipod, fig. 3) deployed alongside each Flobee. Minipod measurements included sonar images (overhead views) and sonar profiles (side views) of the seabed surface. Velocity profiles of current speed and direction over the entire water column and wave data were measured with an upward-looking ADCP. The site-1 minipod was deployed at 40.6047° N., -73.1083° W., on the seafloor at a water depth of 20.33 m. In addition to the instrumentation listed above, the minipod at site 1 also included a still camera for taking photographs every 2 hours to document the seabed. The ADCP on this tripod did not collect wave data because of a firmware error. The pencil beam sonar at this site was flooded, and no data was collected. Fan beam sonar data and still camera photographs are not included in this report but are available upon request. The site-2 minipod was deployed at 40.6084° N., -73.0904° W., on the seafloor at a water depth of 24.11 m. In addition to the instrumentation listed above, the minipod at site 2 included a Laser In Situ Suspended Scattering and Transmissometry (LISST) sensor. The fan beam at this site was flooded, and no data was collected. Pencil beam sonar and LISST data are not included in this report but are available upon request. Micropods, Sites 3 through 7 Micropods (fig. 4) were deployed at sites 3 through 7. Each micropod was equipped with instrumentation to measure waves, currents, salinity, temperature and pressure. The micropod at site 3 was deployed at 40.6116° N., -73.0747° W., on the seafloor at a water depth of 19.29 m. Instrumentation at this site included a Nortek Acoustic Wave and Current profiler (AWAC) and a Sea-Bird Electronics (SBE) Seacat. The micropod at site 4 was deployed at 40.5990° N., -73.1314° W., on the seafloor at a water depth of 24.05 m. Instrumentation at this site included a TRDI ADCP and an SBE Microcat. The micropod at site 5 was deployed at 40.6117° N., -73.1097° W., on the seafloor at a water depth of 22.34 m. Instrumentation at this site included a TRDI ADCP, an SBE Microcat, and an SBE Seagauge. The ADCP on this tripod stopped sampling a few days after deployment. The data are not included in this report but are available upon request. The micropod at site 6 was deployed at 40.6130° N., -73.1421° W., on the seafloor at a water depth of 19.14 m. Instrumentation at this site included a Nortek AWAC and an SBE Seacat. The micropod at site 7 was deployed at 40.6003° N., -73.0941° W., on the seafloor at a water depth of 22.34 m. Instrumentation at this site included a TRDI ADCP and an SBE Seacat. The ADCP on this tripod stopped sampling a few days after deployment. The data are not included in this report but are available upon request. Surface Buoys Surface buoys were deployed at sites 1 through 6 primarily to mark the position of the bottom equipment. Surface salinity was measured at each buoy by SBE Microcat recorders. Surface buoy B (site 1) was deployed at 40.6047° N., -73.1090° W., on the surface at a water depth of 19.14 m. Surface buoy C (site 3) was deployed at 40.6124° N., -73.0754° W., on the surface at a water depth of 18.81 m. The SBE Microcat was damaged during recovery, and the data was unable to be downloaded. Surface buoy D (site 4) was deployed at 40.5999° N., -73.1323° W., on the surface at a water depth of 22.86 m. Surface buoy E (site 5) was deployed at 40.6125° N., -73.1111° W., on the surface at a water depth of 21.15 m. Surface buoy F (site 6) was deployed at 40.6137° N., -73.1428° W., on the surface at a water depth of 17.40 m. Meteorological Buoy Surface buoy A was nearest to site 2. In addition to an SBE Microcat, a meteorological station was mounted on this buoy (fig. 5). The meteorological station recorded raw data at 15 minute intervals and hourly averages of air temperature, barometric pressure, relative humidity, wind speed, wind gust, wind direction, and short wave radiation. Hourly averages also included voltage for main and backup power sources. Global positioning data were collected every 8 hours and included date, time, latitude, longitude , Coordinated Universal Time (UTC), and status (A = valid, V = warning). Pressure data collected were low when compared with data from local meteorological stations and contained a negative trend that was not reflected in the pressure data from local meteorological stations. Because of this discrepancy, it is believed that the pressure sensor malfunctioned and that the pressure data are incorrect. The pressure data have been adjusted to remove the linear trend and offset. Surface buoy A was deployed at 40.6092° N., -73.0908° W., on the surface at a water depth of 19.14 m. The Microcat attached to this buoy was lost at sea, and no data were recovered. Sediment Sampling and Visual Surveys The Mini SEABOSS (SEABed Observation and Sampling System; Valentine and others, 2000) was used to make visual surveys of the seabed and take sediment samples at each site. Visual surveys were also taken over an area nearby, descriptively nicknamed the "Wisp site," where bathymetric surveys had shown a wisping pattern in the surface texture (fig. 1). The visual-survey and sediment-sample data are not included in this report but are available upon request. |

![]() U.S. Department of the Interior |
U.S. Geological Survey
U.S. Department of the Interior |
U.S. Geological Survey
URL: http://pubsdata.usgs.gov/pubs/of/2014/1159/ofr2014-1159-methods.html
Page Contact Information: GS Pubs Web Contact
Page Last Modified: Wednesday, 07-Dec-2016 20:05:31 EST