Open-File Report 2014-1227
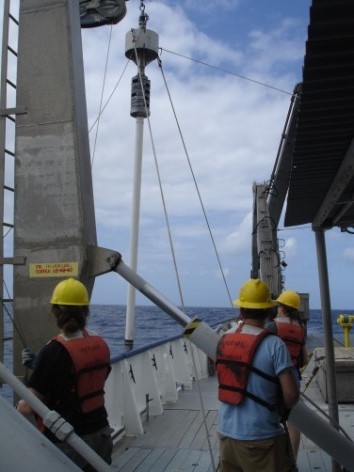
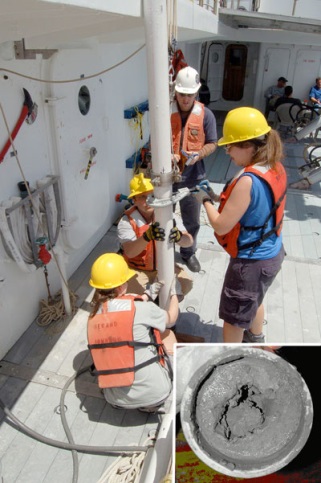
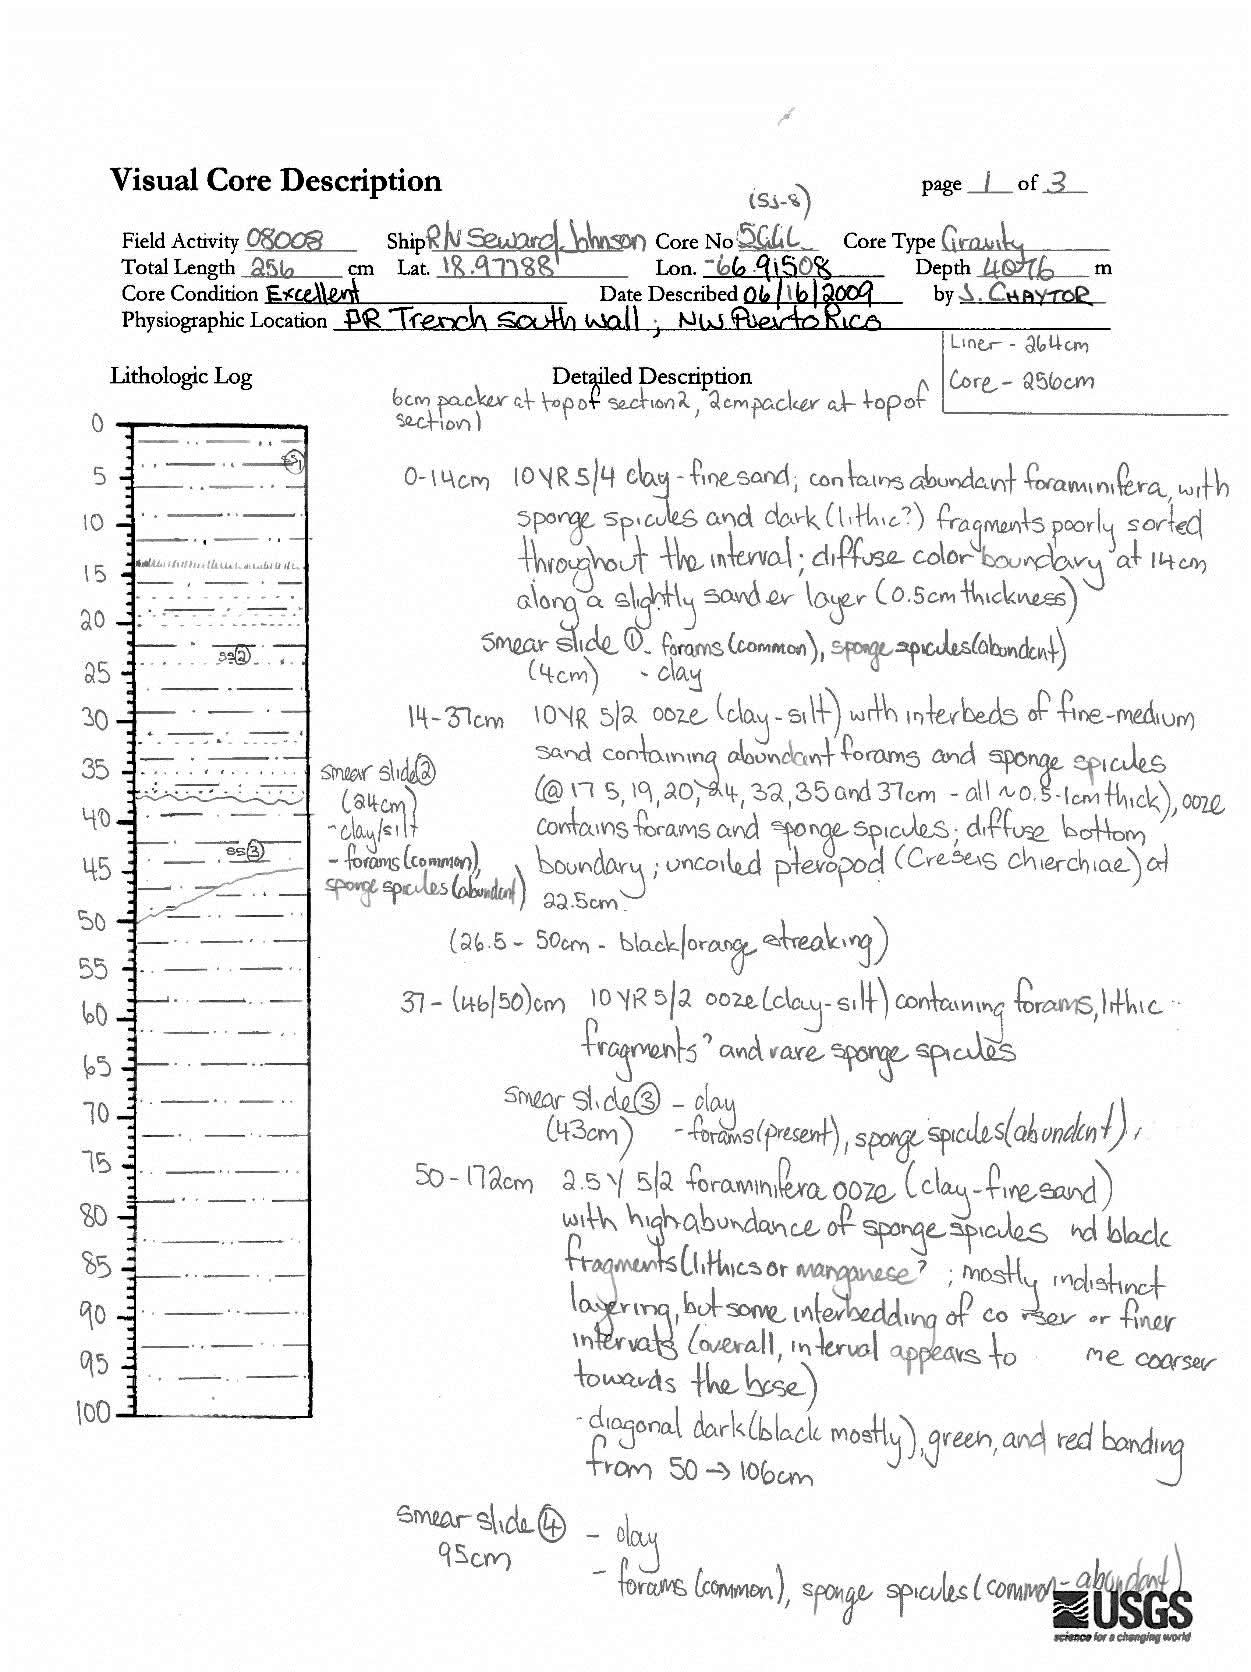
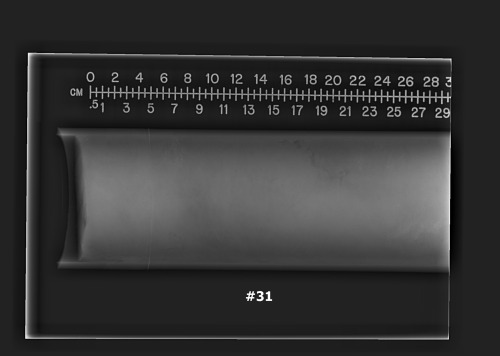
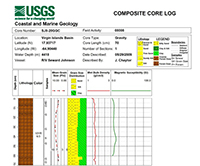
MethodsThe following sections provide a basic description of the SJ8 shipboard gravity core collection and post collection processing. Detailed processing descriptions and sample information for each data type are provided in the metadata files for each data layer described in the “Data Catalog” section of this report. The “Data Catalog” offers comprehensive explanations, download instructions, and metadata for data products associated with this report. Gravity Core CollectionThe WHOI giant gravity corer was used to collect cores during cruise SJ8 (fig. 2). The gravity corer is a large-diameter (10-centimeter [cm]) sampler that collects cores up to 6.5 meters (m) in length. During this cruise, the corer was rigged to collect approximately 3-m-long cores. Twenty cores were recovered successfully; three of these had extra sediment from the core catcher or cutting head, which was transferred to bags (fig. 3). Seven additional sites yielded only samples from the core catcher or cutting head, which were also put in bags. The bag samples were visually analyzed for composition, color, and texture (for descriptions, see 2008PR_bagged). (PRcore_locations) Core Processing and DescriptionAt sea, cores were cut into approximately 100-cm-long sections and capped (fig. 3). The first, deepest section out of the corer was numbered “1,” the next “2,” and so forth. Most of the cores were only one or two sections long, except for 38GGC, which required a “3” section (38GGC has a unique naming scheme because the bottom 47 cm fell out of the corer: the top was numbered “2,” the middle “1,” the bottom “3”). The cores were split onshore and visually described at a centimeter scale before subsampling and nondestructive testing (fig. 4, 2008PR_CoreFieldDescriptions). Fifty six smear-slide samples were taken from 19 cores during visual logging. These samples were analyzed to provide basic sediment composition of specific core intervals (2008PR_smearslides). Sample CollectionDestructive TestingDestructive testing encompasses tests performed on physical samples carefully removed at specific intervals from the sediment core. Typical samples are approximately 1 cm in width by 4 cm in length. Examples of destructive testing include grain-size analysis, microfossil collection and radiocarbon dating. Grain-Size AnalysisSubsamples (1 cm thick) of 16 cores from cruise SJ8 were taken at approximately 20-cm intervals for grain-size analysis. In sandy sediment, subsamples were taken more frequently. Additional subsamples (each 1.5 to 2 cm thick) were taken above or below turbidite and other event intervals for grain-size analysis and foraminifera assemblage and dating. In total, 198 grain-size analyses were performed by using the procedures outlined in Poppe and others (2005). Data are recorded in a Microsoft Excel spreadsheet (2008PR_grainsize). Microfossil CollectionSamples 1.5 to 2 cm thick were taken above or below turbidites and other event intervals for foraminiferal analyses. These microfossil samples were washed over a 63-micrometer screen, dried, and then analyzed for species composition as well as picked for specific datable species. Surface-dwelling (Globigerinoides ruber [white] and Globigerinoides sacculifer) and near-surface-dwelling (Globigerinella aequilateralis) planktonic foraminifera were the primary species used for radiocarbon dating. These species were used for dating because they are abundant in this region and occur in similar environments. Radiocarbon Age DatesPlanktonic foraminifera were analyzed for radiocarbon dating at the WHOI National Ocean Sciences Accelerator Mass Spectrometry Facility (NOSAMS). Radiocarbon ages were converted to calibrated ages by using Calib 6.0 (Stuiver and Reimer, 1993) and IntCal09 calibration curves (Reimer and others, 2009), include the generally accepted 400-year reservoir correction (ΔR). Calibrated ages are reported as years before present (BP). Because of limited information on local marine reservoir effects and the suggestion that any reservoir correction for Caribbean waters is minimal (Hughen and others, 1996; Fitzpatrick and others, 2004), no ΔR value was applied during age calibrations. Uncalibrated and calibrated data are provided in the “Data Catalog” section of this report. (PRcores_radiocarbon) Nondestructive TestingNondestructive testing categorizes any analyses performed on the sediment cores that do not disturb the physical integrity of the core, such as multisensor core logging (MSCL), radiographic imaging, and x-ray fluorescence. In the SJ8 cores, analyses of the entire core created data containing likely erroneous data points pertaining to the ends of sections or the cutting head, which are highlighted in but not removed from the data tables. The depths were calibrated to eliminate depth added by the erroneous data points. Multisensor Core LoggingPhysical properties were collected from the split sections of the SJ8 cores by using a GEOTEK MSCL–S multisensor core logger. The cores were analyzed at ambient room temperature (20–25 degrees Celsius). Gamma-ray attenuation (wet-bulk density) and magnetic susceptibility were measured at 1-cm intervals for each core with a 10-second count time. (2008PRcores_mscl) RadiographsDigital x-radiographs (x-ray; fig. 5) of each core section were acquired at Falmouth Hospital (Falmouth, Massachusetts). Each digital x-ray is about 30 cm long. They highlight sedimentary structures, especially deposits affected by bioturbation and the fine tails of turbidites. (2008PR_radiographs) X–Ray FluorescenceXRF geochemical measurements and linescan images of selected cores were acquired at a 1-millimeter (mm) resolution by using an ITRAX micro-XRF scanner equipped with a 3-kilowatt molybdenum target tube. The XRF scanning yields element intensities from the surface of split sediment cores that provide statistically significant results (greater than 100 counts per second) for potassium, chlorine, calcium, manganese, iron, strontium, zirconium, and argon. Whole-element counts are provided in this data release rather than ratios of element counts (Löwemark and others, 2010). (2008PRcores_xrf) Core Summary SheetsFinal core-description summary sheets (fig. 6) were produced in Logplot 7 after the field descriptions, grain-size analyses, and nondestructive tests were complete. These plots represent the lithology, color, grain size, wet-bulk density, and magnetic susceptibility of the cores. Color is based on Munsell Color Company (2000). Standard lithology symbols were used, with the exception of two symbols (coarse foram ooze and foram ooze) that were created for the purpose of this data release. (2008CoreSummaryDescriptions) Archive CoresEleven cores, collected between 1964 and 1967 and currently archived at the LDEO core repository, were sampled for planktonic foraminifera and were then radiocarbon dated to expand the coverage of dated events north of Puerto Rico (Chaytor and ten Brink, 2014b). Basic descriptions and photographs of these cores are available from the LDEO core repository (http://www.ngdc.noaa.gov/mgg/curator/), but detailed physical-property, grain-size, and composition information is not available. (PRcore_locations) |

![]() U.S. Department of the Interior |
U.S. Geological Survey
U.S. Department of the Interior |
U.S. Geological Survey
URL: http://pubsdata.usgs.gov/pubs/of/2014/1227/ofr2014-1227-methods.html
Page Contact Information: GS Pubs Web Contact
Page Last Modified: Wednesday, 07-Dec-2016 19:40:58 EST