Open-File Report 2014-1246
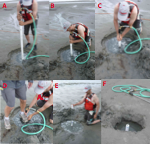
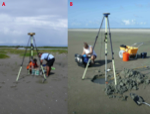
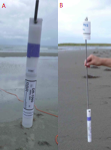
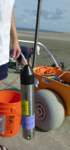
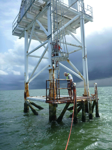
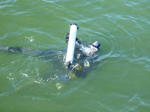
InstrumentationPressure sensors buried in the beach were encased in 4.8-centimeter (cm; outside diameter) schedule 80 polyvinyl chloride (PVC) slotted well casings. The well casings were about 1.5 meters (m) long and were screened with 0.15-millimeter-wide slots along most of their length. A PVC well point with a 1.25-cm-diameter hole drilled through its center (to allow a water jet to exit) was screwed to the lower end of each well. Wells were installed by first digging a shallow hole (30 to 50 cm deep) and then using a battery-powered bilge pump to jet the well into the sand until the top of the well was below the level of the beach (fig. 2). A pressure sensor was hung from a threaded rod attached to a PVC cap that screwed into the top of the well after jetting. The distance from the well cap to the pressure sensor is provided in table 1 and approximates the pressure-sensor depth below the sediment surface. The elevation of the well cap was established using post-processed static Global Positioning System (GPS) data. A GPS base station was placed on a USGS-installed benchmark referred to as TMRK on the Chandeleur Island chain, and a rover unit was used to survey the wells. The error between the base and the rover increased exponentially with distance from the base station (Waypoint Consulting Inc., 2005) as reflected by an increase in the root mean squared (RMS) error of the differentially corrected navigation data. All wells were within 5 kilometers (km) of the base station. The GPS base station and the rover were duplicate systems with Ashtech Z-Xtreme GPS receivers, internal data recorders, Thales choke-ring antennae, and tripods (fig. 3A). After the wells were installed, the GPS rover was positioned and referenced to a dimple on the well cap (fig. 3B). Both receivers recorded the 12-channel full-carrier-phase positioning signals (L1/L2) from the satellites and recorded their positions concurrently at 1-second intervals for at least 30 minutes (min). This 30-min GPS static occupation session was repeated when the wells were recovered months later. All GPS static sessions were processed using NovAtel GrafNet version 8.3 software, accounting for antenna height, antenna model, and GPS session type (rover or base). The processed position heights were referenced to the top of the well cap and converted to NAD83 (CORS96) using the National Geodetic Survey (NGS) Horizontal Time-Dependent Positioning utility. These processed heights were then processed through the NGS GEOID96 model to obtain a geoid height. The elevation of the pressure sensor was then determined by subtracting the distance from the well cap to the pressure sensor (table 1) from the cap elevation. The uncertainty of the elevation of the water-level sensor was estimated by using the square root of the sum of the squared individual error terms. The individual error terms included difference in surveyed well cap heights as measured upon deployment and recovery, the estimated error in the length of the threaded rods the sensors were suspended from, and the standard deviation of the GPS elevation measurements for a particular well. The estimated uncertainty in the elevations of the water-level sensors ranged from 0.002 to 0.016 m (table 1). RBR DR1060 Pressure LoggerThe RBR DR1060 (fig. 4) is a small, submersible pressure logger capable of recording more than 2 million samples at frequencies up to 1 hertz (Hz). These pressure loggers were temperature compensated and had pressure sensors with a depth rating of 10 m. The manufacturer-specified accuracy was ±0.05 percent of full scale (about 0.005-m water depth) and resolution was 0.001 percent of full scale (about 0.0001-m water depth). Each RBR DR1060 was mounted on a rigid metal rod connected to the cap of a buried well jetted into the beach (described in “Well Installation”). The RBR DR1060s recorded pressure every 5 seconds. At this sample rate, the RBR DR1060s could sample for about 5 months before running out of memory. Onset Hobo U20 Water-level LoggerThe Onset Hobo U20 water-level logger (fig. 5) is a small, submersible pressure logger capable of recording about 22,000 pressure and temperature samples at rates up to 1 Hz. Two types of Onset Hobo U20s were deployed: an atmospheric pressure sensor with a range of 0 to 15 decibars and a submerged sensor with a range of 0 to 21 decibars (about 0–9-m water depth). The atmospheric sensor has an accuracy of ±0.3 percent of full scale and resolution of 0.01 percent of full scale. The submerged sensor has a water-level accuracy of 0.05 percent of full scale (about 0.005-m water depth) and water-level resolution of 0.002-m water depth. The U20–001–04 sensor used as an atmospheric sensor was mounted in a small white PVC tube with vents and attached with hose clamps to the radio tower at the northern end of the Chandeleurs (figs. 1 and 6). The sensor was mounted about 4 m above the sea surface. The submerged Onset Hobo U20s were mounted on rigid metal rods connected to the caps of buried wells jetted into the beach (described in “Well Installation”). Each Onset Hobo U20 collected a pressure measurement every 600 seconds for the duration of the deployment. At this sample rate, the Onset Hobo U20s could sample for about 5 months before running out of memory. Sea-Bird Seagauge Wave and Tide RecorderThe Sea-Bird Seagauge SBE 26 (fig. 7) is a submersible pressure logger capable of making periodic and burst pressure measurements to determine water level and waves. The Seagauges were equipped with Digiquartz temperature-compensated pressure sensors. Seagauge serial number 1099, which was deployed at the tower from February to July 2011, had a pressure sensor rated at 0 to 138 decibars (about 125 m of water depth) with an accuracy of ±0.01 percent of full scale (about 0.013-m water depth) and a resolution of about 0.0009-m water depth. The other three Seagauges had pressure sensors rated at 0 to 31 decibars (about 20-m water depth) with accuracies of ±0.01 percent (about 0.003-m water depth) and resolutions of 0.0002-m water depth. The Seagauges at the Pelican site were bolted to a rigid mount on a pole that was jetted into the seabed and left for the duration of the project. The Seagauges at the Tower site were bolted to a rigid mount attached to a leg of the tower and were deployed by SCUBA divers. Each Seagauge recorded a tide measurement (single pressure reading) every 20 minutes and recorded a 2,048-sample burst at a rate of 4 Hz every 240 minutes. Seagauge wave data were processed using Sea-Bird Seasoft for Waves version 2.0 software with the settings specified in table 2. |

![]() U.S. Department of the Interior |
U.S. Geological Survey
U.S. Department of the Interior |
U.S. Geological Survey
URL: http://pubsdata.usgs.gov/pubs/of/2014/1246/ofr2014-1246-instrumentation.html
Page Contact Information: GS Pubs Web Contact
Page Last Modified: Wednesday, 07-Dec-2016 20:06:07 EST