
| List of Figures
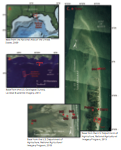 |
Figure 1. Maps showing, at increasingly greater scales, the study area and locations of sensors used to monitor atmospheric pressure, water level, and waves in the Chandeleur Islands, Louisiana, during 2012 and 2013. A, Gulf of Mexico; B, northern Gulf of Mexico; C, northern Chandeleur Islands and sensor locations; and D, locations of recovered buried well sensors within the area designated by the inset in C. Red dots indicate sensor locations. |
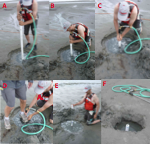 |
Figure 2. Photographs illustrating the procedure for installing a buried well. A–C, the well casing being jetted into the sand; D, the well casing at the end of jetting; E, the pressure sensor being inserted into the casing; F, the completed installation with the pressure sensor inserted and the cap screwed into the well casing. |
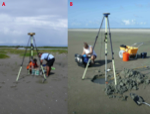 |
Figure 3. Photographs of A, USGS scientists Nancy Dewitt and Kyle Kelso installing the Global Positioning System (GPS) base station and B, Nancy Dewitt surveying a well with the GPS rover (after installation and prior to burial) to provide precise information about the location and elevation of the buried pressure sensor. |
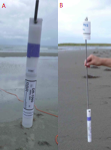 |
Figure 4. Photographs of an RBR DR1060 pressure logger. A, Close-up of RBR DR1060 pressure logger. B, RBR DR1060 pressure logger connected to well cap by threaded stainless-steel rod. Pressure sensor is inserted into well casing, and cap is screwed onto top of well as shown in figure 3E.
|
 |
Figure 5. Photograph of an Onset Hobo U20 pressure logger and threaded stainless-steel rod. |
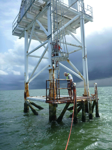 |
Figure 6. Photograph of Onset Hobo U20 atmospheric pressure sensor being mounted on tower by Patrick Dickhudt and Chris Sherwood. |
 |
Figure 7. Photograph of Sea-Bird SBE 26 wave and water-level sensor after being recovered from tower by USGS scientists B.J. Reynolds (pictured) and Kyle Kelso. |
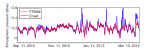 |
Figure 8. Portion of atmospheric pressure time series from National Oceanic and Atmospheric Administration (National Data Buoy Center) station PTBM6 and Onset Hobo U20 pressure sensors on Tower site, Chandeleur Islands, Louisiana, 2012 to 2013. dbar, decibars. |
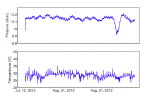 |
Figure 9. Atmospheric pressure and temperature time series from an Onset Hobo U20 atmospheric pressure sensor mounted on the tower at Site 946, Chandeleur Islands, Louisiana, from July 11 through September 7, 2012. The passage of Hurricane Isaac is evident by the sharp change in atmospheric pressure on August 29 and 30. dbar, decibars; °C, degrees Celsius. |
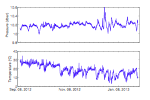 |
Figure 10. Atmospheric pressure and temperature time series from an Onset Hobo U20 atmospheric pressure sensor mounted on the tower at Site 947, Chandeleur Islands, Louisiana, from September 7, 2012 to January 31, 2013. dbar, decibars; °C, degrees Celsius. |
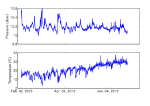 |
Figure 11. Atmospheric pressure and temperature time series from an Onset Hobo U20 atmospheric pressure sensor mounted on the tower at Site 951, Chandeleur Islands, Louisiana, from February 1 through July 18, 2013. dbar, decibars; °C, degrees Celsius. |
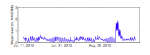 |
Figure 12. Water level time series from an RBR DR1060 pressure logger mounted in a buried well at Site 942, Chandeleur Islands, Louisiana, from July 10 through September 7, 2012. The passage of Hurricane Isaac is evident by the increase in water level on August 29 and 30. m, meters; NAVD88, North American Vertical Datum of 1988. |
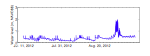 |
Figure 13. Water level time series from an RBR DR1060 pressure logger mounted in a buried well at Site 943 Chandeleur Islands, Louisiana, from July 10 through September 7, 2012. The passage of Hurricane Isaac is evident by the increase in water level on August 29 and 30. m, meters; NAVD88, North American Vertical Datum of 1988. |
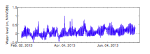 |
Figure 14. Water level time series from an RBR DR1060 pressure logger mounted in a buried well at Site 948, Chandeleur Islands, Louisiana, from February 1 through July 16, 2013. m, meters; NAVD88, North American Vertical Datum of 1988. |
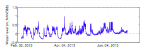 |
Figure 15. Water level time series from an Onset Hobo U20 pressure logger mounted in a buried well at Site 949 Chandeleur Islands, Louisiana, from February 1 through July 16, 2013. m, meters; NAVD88, North American Vertical Datum of 1988. |
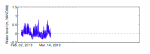 |
Figure 16. Water level time series from an RBR DR1060 pressure logger mounted in a buried well at Site 950, Chandeleur Islands, Louisiana, from February 1 through March 15, 2013. The data record ends on March 15, 2013, when the instrument was discovered on the beach by a fisherman and removed. m, meters; NAVD88, North American Vertical Datum of 1988. |
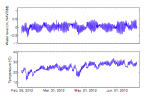 |
Figure 17. Water level and temperature time series from a Sea-Bird SBE 26 deployed at the Pelican site in the Chandeleur Islands, Louisiana, from February 28, 2012, to June 20, 2012. m, meters; NAVD88, North American Vertical Datum of 1988; °C, degrees Celsius. |
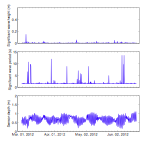 |
Figure 18. Wave statistics and sensor depth time series from a Sea-Bird SBE 26 deployed at the Pelican site in the Chandeleur Islands, Louisiana, from February 28, 2012, to June 20, 2012. m, meters; s, seconds. |
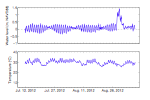 |
Figure 19. Water level and temperature time series from a Sea-Bird SBE 26 deployed at the Pelican site in the Chandeleur Islands, Louisiana, from July 11, 2012, to September 6, 2012. The passage of Hurricane Isaac is evident on August 29 and 30. m, meters; NAVD88, North American Vertical Datum of 1988; °C, degrees Celsius. |
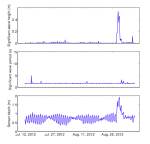 |
Figure 20. Wave statistics and time series of sensor depth relative to sea surface from a Sea-Bird SBE 26 deployed at the Pelican site in the Chandeleur Islands, Louisiana, from July 11, 2012, to September 6, 2012. The passage of Hurricane Isaac is evident on August 29 and 30. m, meters; s, seconds. |
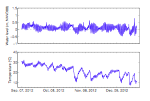 |
Figure 21. Water level and temperature time series from a Sea-Bird SBE 26 deployed at the Pelican site in the Chandeleur Islands, Louisiana, from September 6, 2012, to December 28, 2012. m, meters; NAVD88, North American Vertical Datum of 1988; °C, degrees Celsius. |
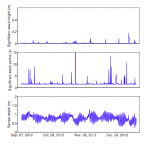 |
Figure 22. Wave statistics and time series of sensor depth relative to sea surface from a Sea-Bird SBE 26 deployed at the Pelican site in the Chandeleur Islands, Louisiana, from September 6, 2012, to December 28, 2012. m, meters; s, seconds. |
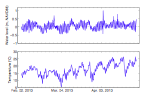 |
Figure 23. Water level and temperature time series from a Sea-Bird SBE 26 deployed at the Pelican site in the Chandeleur Islands, Louisiana, from February 1, 2013, to April 28, 2013. m, meters; NAVD88, North American Vertical Datum of 1988; °C, degrees Celsius. |
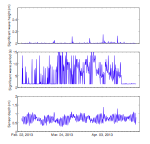 |
Figure 24. Wave statistics and time series of sensor depth relative to sea surface from a Sea-Bird SBE 26 deployed at the Pelican site in the Chandeleur Islands, Louisiana, from February 1, 2013, to April 28, 2013. m, meters; s, seconds. |
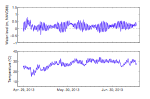 |
Figure 25. Water level and temperature time series from a Sea-Bird SBE 26 deployed at the Pelican site in the Chandeleur Islands, Louisiana, from April 28, 2013, to July 16, 2013. m, meters; NAVD88, North American Vertical Datum of 1988; °C, degrees Celsius. |
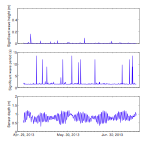 |
Figure 26. Wave statistics and time series of sensor depth relative to sea surface from a Sea-Bird SBE 26 deployed at the Pelican site in the Chandeleur Islands, Louisiana, from April 28, 2013, to July 16, 2013. m, meters; s, seconds. |
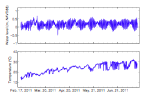 |
Figure 27. Water level and temperature time series from a Sea-Bird SBE 26+ deployed at the Tower site in the Chandeleur Islands, Louisiana, from February 16, 2011, to July 16, 2011. m, meters; NAVD88, North American Vertical Datum of 1988; °C, degrees Celsius. |
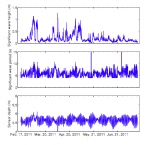 |
Figure 28. Wave statistics and time series of sensor depth relative to sea surface from a Sea-Bird SBE 26+ deployed at the Tower site in the Chandeleur Islands, Louisiana, from February 16, 2011, to July 16, 2011. m, meters; s, seconds. |
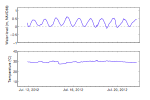 |
Figure 29. Water level and temperature time series from a Sea-Bird SBE 26 deployed at the Tower site in the Chandeleur Islands, Louisiana, from July 11, 2012, to July 21, 2012. m, meters; NAVD88, North American Vertical Datum of 1988; °C, degrees Celsius. |
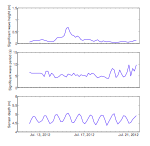 |
Figure 30. Wave statistics and time series of sensor depth relative to sea surface from a Sea-Bird SBE 26 deployed at the Tower site in the Chandeleur Islands, Louisiana, from July 11, 2012, to July 21, 2012. m, meters; s, seconds. |
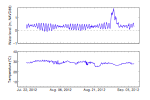 |
Figure 31. Water level and temperature time series from a Sea-Bird SBE 26 deployed at the Tower site in the Chandeleur Islands, Louisiana, from July 21, 2012, to September 7, 2012. m, meters; NAVD88, North American Vertical Datum of 1988; °C, degrees Celsius. |
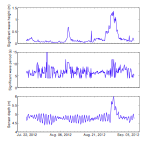 |
Figure 32. Wave statistics and time series of sensor depth relative to sea surface from a Sea-Bird SBE 26 deployed at the Tower site in the Chandeleur Islands, Louisiana, from July 21, 2012, to September 7, 2012. m, meters; s, seconds. |
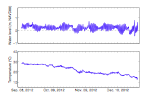 |
Figure 33. Water level and temperature time series from a Sea-Bird SBE 26 deployed at the Tower site in the Chandeleur Islands, Louisiana, from September 7, 2012, to December 29, 2012. m, meters; NAVD88, North American Vertical Datum of 1988; °C, degrees Celsius. |
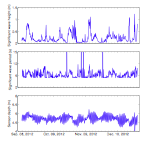 |
Figure 34. Wave statistics and time series of sensor depth relative to sea surface from a Sea-Bird SBE 26 deployed at the Tower site in the Chandeleur Islands, Louisiana, from September 7, 2012, to December 29, 2012. m, meters; s, seconds. |
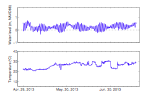 |
Figure 35. Water level and temperature time series from a Sea-Bird SBE 26 deployed at the Tower site in the Chandeleur Islands, Louisiana, from January 31, 2013, to April 28, 2013. m, meters; NAVD88, North American Vertical Datum of 1988; °C, degrees Celsius. |
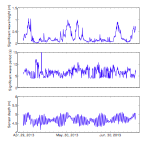 |
Figure 36. Wave statistics and time series of sensor depth relative to sea surface from a Sea-Bird SBE 26 deployed at the Tower site in the Chandeleur Islands, Louisiana, from January 31, 2013, to April 28, 2013. m, meters; s, seconds. |
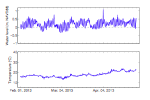 |
Figure 37. Water level and temperature time series from a Sea-Bird SBE 26 deployed at the Tower site in the Chandeleur Islands, Louisiana, from April 28, 2013, to July 18, 2013. m, meters; NAVD88, North American Vertical Datum of 1988; °C, degrees Celsius. |
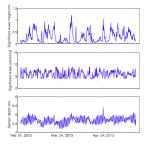 |
Figure 38. Wave statistics and time series of sensor depth relative to sea surface from a Sea-Bird SBE 26 deployed at the Tower site in the Chandeleur Islands, Louisiana, from April 28, 2013, to July 18, 2013. m, meters; s, seconds. |
|

