Open-File Report 2014-1246
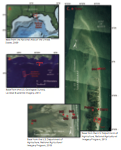
Site DescriptionChandeleur Islands, LouisianaThe Chandeleur Islands (fig. 1) are a chain of uninhabited, low-lying islands bordered to the west by Chandeleur Sound and to the east by the Gulf of Mexico. The islands are sandy and partially vegetated, and they sit atop the abandoned St. Bernard lobe of the Mississippi delta. Table 1 provides the exact locations of each study site in the Chandeleur Islands. Pelican SBE 26The Pelican site was in a small bay on the Chandeleur Sound side of the islands near the Pelican fishing camp. A pole was jetted into the sediment in about 1.5 m of water, and a Sea-Bird SBE 26 pressure sensor was bolted to the pole to measure water levels and wave heights on the Chandeleur Sound side of the islands. The SBE 26 pressure sensor was 0.85 m above the sea floor. Sensors were deployed at the Pelican site almost continuously from February 2012 to July 2013 (table 1). Tower SBE 26 and Atmospheric Pressure Sensors 946, 947, 951The Tower site is a radio tower on the northern end of the Chandeleur Island chain in about 5 m of water (fig. 1c). A Sea-Bird SBE 26 pressure sensor was bolted to a fixed mount near the base of the tower to measure water levels and wave heights on the exposed Gulf of Mexico side of the islands. The SBE 26 pressure sensor was 0.85 m above the Seafloor. Sensors were deployed at the Tower site from February 2011 to July 2011 and almost continuously from July 2012 to July 2013 (table 1). Sites 946, 947, and 951 represent sequential deployments on the Tower site on the northern end of the Chandeleur Island chain. An Onset Hobo U20 atmospheric pressure sensor was mounted in a PVC tube hoseclamped to the tower about 4 m above the sea surface. Sites 946, 947, and 951 are in the same location; a new site number was given each time the sensor was redeployed. The sensor at 946 was deployed from July 11, 2012, to September 7, 2012. The sensor at 947 was deployed from September 7, 2012, to January 31, 2013. The sensor at 951 was deployed from February 2, 2013, to July 18, 2013. Buried Well Sites 942, 943, 944, and 945Sites 942, 943, 944, and 945 were beach well sites occupied during the 2012 hurricane season. They were deployed on July 10, 2012, and recovered on September 7, 2012, after Hurricane Isaac. Site 942Site 942 was on the western (Chandeleur Sound) side of the island at the western end of an intermittently active overwash channel. An RBR DR1060 pressure sensor was mounted in a well buried in the beach. Site 943Site 943 was on the eastern (Gulf of Mexico) side of the island in the same overwash channel as 942. An RBR DR1060 pressure sensor was mounted in a well buried in the beach. Site 944Site 944 was on the western (Chandeleur Sound) side of the island at the western end of an intermittently active overwash channel. An Onset Hobo U20 pressure sensor was mounted in a well buried in the beach. The sensor at site 944 was lost during Hurricane Isaac when this portion of the island underwent substantial erosion. Site 945Site 945 was on the eastern (Gulf of Mexico) side of the island in the same overwash channel as 944. An Onset Hobo U20 pressure sensor was mounted in a well buried in the beach. The sensor at site 945 was lost during Hurricane Isaac when this portion of the island underwent substantial erosion. Buried Well Sites 948, 949, 950Sites 948, 949, 950 were beach well sites, occupied during the 2013 hurricane season, that transected an overwash channel (site 942 from 2012). They were all deployed on February 1, 2013. The sensors at 948 and 949 were recovered on July 16, 2013. The sensor at site 950 was recovered on March 15, 2013, when it was discovered by a fisherman. 948Site 948 was very near site 942 on the Chandeleur Sound side of the island at the western end of the intermittently active overwash channel. An RBR DR1060 pressure sensor was mounted in a well buried in the beach. 949Site 949 was directly between sites 948 and 950 at the approximate crest of the island. An Onset Hobo U20 pressure sensor was mounted in a well buried in the beach. 950Site 950 was very near site 943 on the Gulf of Mexico side of the island at the eastern end of the overwash channel. An RBR DR1060 pressure sensor was mounted in a well buried in the beach. Table 1. Mooring log sensor, location, and deployment information.
|

![]() U.S. Department of the Interior |
U.S. Geological Survey
U.S. Department of the Interior |
U.S. Geological Survey
URL: http://pubsdata.usgs.gov/pubs/of/2014/1246/ofr2014-1246-site-description.html
Page Contact Information: GS Pubs Web Contact
Page Last Modified: Wednesday, 07-Dec-2016 20:06:10 EST