
|
Results
Atmospheric pressure data were collected continuously at the Tower site from July 2012 to July 2013 (table 1). The data appear to be of good quality but differ at times from data collected by the nearest land-based atmospheric pressure sensors. Specifically, the sensors at the Tower site show larger variations in pressure than the sensors at National Oceanic and Atmospheric Administration (NOAA) gauge PTBM6 at Petit Bois Island, Mississippi, approximately 40 km northeast of the Tower site (fig. 8). These pressure excursions may be real (for example, due to short-term pressure fluctuations caused by frontal passages) or they may be artifacts of sensor exposure to sun and wind. Time series plots of atmospheric pressure and temperature are shown in figs. 9, 10, and 11.
Pressure sensors encased in wells buried in the beach were deployed from July 2012 to September 2012 and from February 2013 to July 2013 (table 1). All data from the wells were of very high quality with no evidence of error due to fouling or attenuation due to burial. Two sensors (at 944 and 945) were lost during Hurricane Isaac in August of 2012 when substantial parts of the islands were lost to erosion. The sensor deployed at site 950 was recovered early (March 2013) when a fisherman discovered it and mistook it for one of the sensors lost during Hurricane Isaac.
Water levels were derived from the well pressure sensors by subtracting atmospheric pressure linearly interpolated (in time) from measurements taken every 6 minutes at NOAA gauge PTBM6. The corrected pressure data were converted from decibars to water depth using an assumed seawater density of 1022.9 kilograms per cubic meter (calculated from salinity of 34 practical salinity units and temperature of 24 degrees Celsius, a typical salinity and approximately the mean temperature) and adjusted to a common datum (North American Vertical Datum of 1988 [NAVD88]) using the surveyed cap elevation and the measured distance from the cap to the pressure sensor (table 1). Time series plots of water-level data from the buried wells are shown in figures 12 through 16. In the water-level plots, the reported water level is NAVD88 orthometric height, referenced to the NGS GEOID96 datum.
Water-level and wave data were collected at the Tower site for 5 months in 2011, almost continuously at the Pelican site from February 2012 to July 2013, and almost continuously at the Tower site from July 2012 to July 2013 (table 1). The data were of high quality with no evidence of error or drift due to fouling. Water-level information was derived from the SBE 26 sensors with Sea-Bird Seasoft software by subtracting atmospheric pressure linearly interpolated (in time) from measurements taken every 6 minutes at NOAA gauge PTBM6. The corrected pressure data were converted from decibars to water depth using the algorithms provided in Unesco (1983) and were adjusted to a common datum (NAVD88) using the surveyed sensor elevation.
Wave statistics were calculated using Sea-Bird Seasoft for Waves version 2.0 software with the settings provided in table 2. Wave processing was sensitive to the user-selected high-frequency cutoff. The small waves at the Pelican and Tower sites and the amplification of high-frequency noise when the wave spectra were corrected for depth attenuation resulted in overestimates of wave height and underestimates of wave period. Setting the minimum period (high-frequency cutoff) to 1.5 seconds for data from the Pelican site and 4 seconds for data from the Tower site improved the quality of the calculated wave statistics. Additionally, the data from the Pelican site were processed using a maximum period of 15 seconds. This site had extremely small waves for most of the study period, and enforcing this maximum period removed waves that were small (< 0.03 m) with long periods (for example, 100 seconds). Time series plots of water level and wave data from the Sea-Bird SBE 26 mounted at the Pelican site are shown in figures 17 through 26. Time series plots of water level and wave data from the Sea-Bird SBE 26 mounted at the Tower site are shown in figures 27 through 38.
Data from all instruments were converted to standard format for USGS time series (Montgomery and others, 2009) in network common data format (netCDF) files. NetCDF files store data and associated metadata in a format that is compact and machine-independent. Documentation of the USGS Oceanographic Time-Series Measurement Database can be found in Montgomery and others (2009). Details of instrumentation used for measurement of atmospheric pressure, water levels, and waves are provided in table 3.
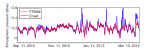
Figure 8. Portion of atmospheric pressure time series from National Oceanic and Atmospheric Administration (National Data Buoy Center) station PTBM6 and Onset Hobo U20 pressure sensors on Tower site, Chandeleur Islands, Louisiana, 2012 to 2013. dbar, decibars. |
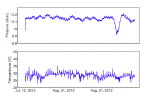
Figure 9. Atmospheric pressure and temperature time series from an Onset Hobo U20 atmospheric pressure sensor mounted on the tower at Site 946, Chandeleur Islands, Louisiana, from July 11 through September 7, 2012. The passage of Hurricane Isaac is evident by the sharp change in atmospheric pressure on August 29 and 30. dbar, decibars; °C, degrees Celsius. |
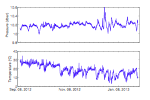
Figure 10. Atmospheric pressure and temperature time series from an Onset Hobo U20 atmospheric pressure sensor mounted on the tower at Site 947, Chandeleur Islands, Louisiana, from September 7, 2012 to January 31, 2013. dbar, decibars; °C, degrees Celsius.
|
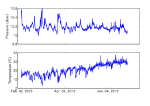
Figure 11. Atmospheric pressure and temperature time series from an Onset Hobo U20 atmospheric pressure sensor mounted on the tower at Site 951, Chandeleur Islands, Louisiana, from February 1 through July 18, 2013. dbar, decibars; °C, degrees Celsius. |
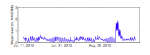
Figure 12. Water level time series from an RBR DR1060 pressure logger mounted in a buried well at Site 942, Chandeleur Islands, Louisiana, from July 10 through September 7, 2012. The passage of Hurricane Isaac is evident by the increase in water level on August 29 and 30. m, meters; NAVD88, North American Vertical Datum of 1988. |
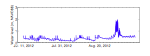
Figure 13. Water level time series from an RBR DR1060 pressure logger mounted in a buried well at Site 943 Chandeleur Islands, Louisiana, from July 10 through September 7, 2012. The passage of Hurricane Isaac is evident by the increase in water level on August 29 and 30. m, meters; NAVD88, North American Vertical Datum of 1988. |
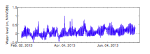
Figure 14. Water level time series from an RBR DR1060 pressure logger mounted in a buried well at Site 948, Chandeleur Islands, Louisiana, from February 1 through July 16, 2013. m, meters; NAVD88, North American Vertical Datum of 1988. |
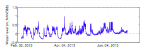
Figure 15. Water level time series from an Onset Hobo U20 pressure logger mounted in a buried well at Site 949 Chandeleur Islands, Louisiana, from February 1 through July 16, 2013. m, meters; NAVD88, North American Vertical Datum of 1988.
|
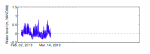
Figure 16. Water level time series from an RBR DR1060 pressure logger mounted in a buried well at Site 950, Chandeleur Islands, Louisiana, from February 1 through March 15, 2013. The data record ends on March 15, 2013, when the instrument was discovered on the beach by a fisherman and removed. m, meters; NAVD88, North American Vertical Datum of 1988. |
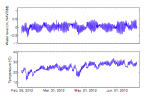
Figure 17. Water level and temperature time series from a Sea-Bird SBE 26 deployed at the Pelican site in the Chandeleur Islands, Louisiana, from February 28, 2012, to June 20, 2012. m, meters; NAVD88, North American Vertical Datum of 1988; °C, degrees Celsius. |
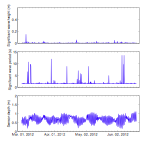
Figure 18. Wave statistics and sensor depth time series from a Sea-Bird SBE 26 deployed at the Pelican site in the Chandeleur Islands, Louisiana, from February 28, 2012, to June 20, 2012. m, meters; s, seconds. |
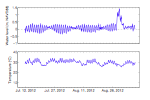
Figure 19. Water level and temperature time series from a Sea-Bird SBE 26 deployed at the Pelican site in the Chandeleur Islands, Louisiana, from July 11, 2012, to September 6, 2012. The passage of Hurricane Isaac is evident on August 29 and 30. m, meters; NAVD88, North American Vertical Datum of 1988; °C, degrees Celsius. |
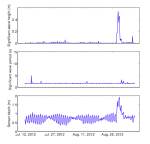
Figure 20. Wave statistics and time series of sensor depth relative to sea surface from a Sea-Bird SBE 26 deployed at the Pelican site in the Chandeleur Islands, Louisiana, from July 11, 2012, to September 6, 2012. The passage of Hurricane Isaac is evident on August 29 and 30. m, meters; s, seconds. |
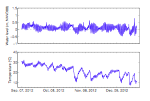
Figure 21. Water level and temperature time series from a Sea-Bird SBE 26 deployed at the Pelican site in the Chandeleur Islands, Louisiana, from September 6, 2012, to December 28, 2012. m, meters; NAVD88, North American Vertical Datum of 1988; °C, degrees Celsius. |
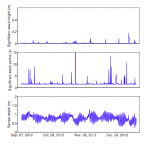
Figure 22. Wave statistics and time series of sensor depth relative to sea surface from a Sea-Bird SBE 26 deployed at the Pelican site in the Chandeleur Islands, Louisiana, from September 6, 2012, to December 28, 2012. m, meters; s, seconds. |
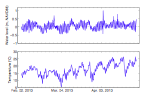
Figure 23. Water level and temperature time series from a Sea-Bird SBE 26 deployed at the Pelican site in the Chandeleur Islands, Louisiana, from February 1, 2013, to April 28, 2013. m, meters; NAVD88, North American Vertical Datum of 1988; °C, degrees Celsius. |
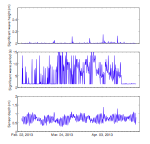
Figure 24. Wave statistics and time series of sensor depth relative to sea surface from a Sea-Bird SBE 26 deployed at the Pelican site in the Chandeleur Islands, Louisiana, from February 1, 2013, to April 28, 2013. m, meters; s, seconds. |
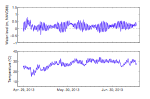
Figure 25. Water level and temperature time series from a Sea-Bird SBE 26 deployed at the Pelican site in the Chandeleur Islands, Louisiana, from April 28, 2013, to July 16, 2013. m, meters; NAVD88, North American Vertical Datum of 1988; °C, degrees Celsius. |
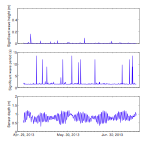
Figure 26. Wave statistics and time series of sensor depth relative to sea surface from a Sea-Bird SBE 26 deployed at the Pelican site in the Chandeleur Islands, Louisiana, from April 28, 2013, to July 16, 2013. m, meters; s, seconds. |
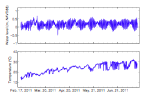
Figure 27. Water level and temperature time series from a Sea-Bird SBE 26+ deployed at the Tower site in the Chandeleur Islands, Louisiana, from February 16, 2011, to July 16, 2011. m, meters; NAVD88, North American Vertical Datum of 1988; °C, degrees Celsius. |
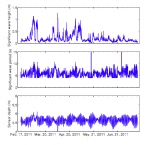
Figure 28. Wave statistics and time series of sensor depth relative to sea surface from a Sea-Bird SBE 26+ deployed at the Tower site in the Chandeleur Islands, Louisiana, from February 16, 2011, to July 16, 2011. m, meters; s, seconds. |
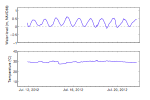
Figure 29. Water level and temperature time series from a Sea-Bird SBE 26 deployed at the Tower site in the Chandeleur Islands, Louisiana, from July 11, 2012, to July 21, 2012. m, meters; NAVD88, North American Vertical Datum of 1988; °C, degrees Celsius. |
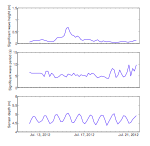
Figure 30. Wave statistics and time series of sensor depth relative to sea surface from a Sea-Bird SBE 26 deployed at the Tower site in the Chandeleur Islands, Louisiana, from July 11, 2012, to July 21, 2012. m, meters; s, seconds. |
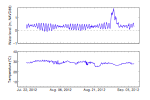
Figure 31. Water level and temperature time series from a Sea-Bird SBE 26 deployed at the Tower site in the Chandeleur Islands, Louisiana, from July 21, 2012, to September 7, 2012. m, meters; NAVD88, North American Vertical Datum of 1988; °C, degrees Celsius. |
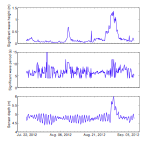
Figure 32. Wave statistics and time series of sensor depth relative to sea surface from a Sea-Bird SBE 26 deployed at the Tower site in the Chandeleur Islands, Louisiana, from July 21, 2012, to September 7, 2012. m, meters; s, seconds. |
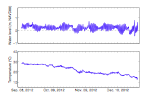
Figure 33. Water level and temperature time series from a Sea-Bird SBE 26 deployed at the Tower site in the Chandeleur Islands, Louisiana, from September 7, 2012, to December 29, 2012. m, meters; NAVD88, North American Vertical Datum of 1988; °C, degrees Celsius. |
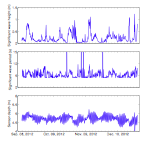
Figure 34. Wave statistics and time series of sensor depth relative to sea surface from a Sea-Bird SBE 26 deployed at the Tower site in the Chandeleur Islands, Louisiana, from September 7, 2012, to December 29, 2012. m, meters; s, seconds. |
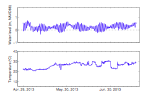
Figure 35. Water level and temperature time series from a Sea-Bird SBE 26 deployed at the Tower site in the Chandeleur Islands, Louisiana, from January 31, 2013, to April 28, 2013. m, meters; NAVD88, North American Vertical Datum of 1988; °C, degrees Celsius. |
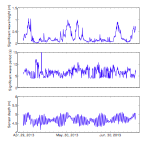
Figure 36. Wave statistics and time series of sensor depth relative to sea surface from a Sea-Bird SBE 26 deployed at the Tower site in the Chandeleur Islands, Louisiana, from January 31, 2013, to April 28, 2013. m, meters; s, seconds. |
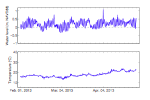
Figure 37. Water level and temperature time series from a Sea-Bird SBE 26 deployed at the Tower site in the Chandeleur Islands, Louisiana, from April 28, 2013, to July 18, 2013. m, meters; NAVD88, North American Vertical Datum of 1988; °C, degrees Celsius. |
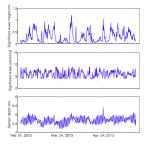
Figure 38. Wave statistics and time series of sensor depth relative to sea surface from a Sea-Bird SBE 26 deployed at the Tower site in the Chandeleur Islands, Louisiana, from April 28, 2013, to July 18, 2013. m, meters; s, seconds. |
|

