Open-File Report 20151055
Effects of Proposed Sediment Borrow Pits on Nearshore Wave Climate and Longshore Sediment Transport Rate Along Breton Island, Louisiana
Citation | List of Figures | List of Tables | Conversion Factors | Abbreviations | Abstract | Introduction | Methods | Results | Conclusions | Acknowledgments | References Cited | Appendix 1. Scenarios | Appendix 2. Example Model Input Files | Appendix 3. File Naming Conventions | Digital Data Files
 |
||
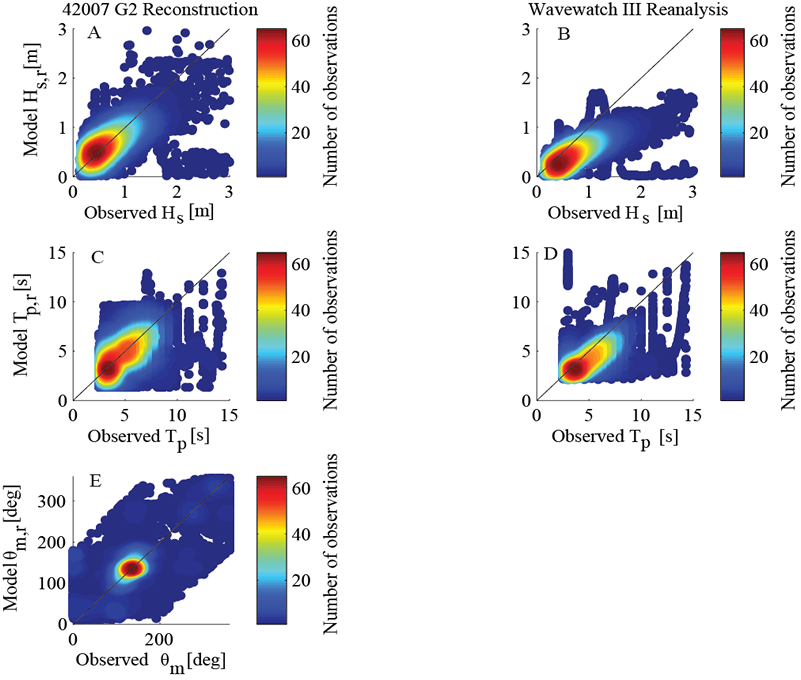
| Figure 11. Comparison of wave time series constructed using probabilistic method and observations at NDBC buoy 42007 for the time period January 19, 2005, to February 15, 2008 (left column), and comparison of the WavewatchIII® dataset and the observations for the same time period (right column). Comparisons of (A, B) significant wave height, (C, D) peak wave period, and (E) mean wave direction. WavewatchIII® output is every 3 hours, whereas Simulating WAves Nearshore (SWAN) results are hourly, resulting in a larger number of points. [m, meters; s, seconds; deg, degrees] | ||

![]() U.S. Department of the Interior |
U.S. Geological Survey
U.S. Department of the Interior |
U.S. Geological Survey
URL: http://pubsdata.usgs.gov/pubs/of/2015/1055/ofr2015-1055_figure11.html
Page Contact Information: GS Pubs Web Contact
Page Last Modified: Monday, 28-Aug-2017 17:34:48 EDT
