
Laboratory Methods And Analysis
Physical Sediment Parameters
In the laboratory, samples were homogenized in the sample bag. The sediment parameters subsample collected at each sample location was processed for basic sediment characteristics: dry bulk density and porosity. Water content, porosity, and dry bulk density were calculated by determining water mass lost during drying. Known volumes of each wet subsample, usually 20–30 mL, were packed into a graduated syringe with 0.5 cubic centimeter (cm3) resolution. The wet sediment was then extracted into a pre-weighed aluminum tray, and the wet sediment's weight was recorded. The wet sediment and tray were placed in a drying oven for 48 hours at 60 °C. Water content (θ) was determined as the mass of water (lost when dried) relative to the initial wet sediment mass. Porosity (φ) was estimated with the following equation
![]()
where ρs is sediment density assumed to be 2.5 grams per cubic centimeter (g/cm3). Salt-mass contributions were removed based on the salinity measured at the time of sample collection. If salinity was not measured in the field, pore water salinity was estimated to be 25. Dry bulk density (ρb) (g/cm3) was determined as
![]() .
.
Organic matter (OM) content was determined with a mass loss technique, referred to as loss on ignition (LOI). The dry sediment from the previous process was homogenized with a porcelain mortar and pestle. Approximately 5 grams (g) of the dry sediment was placed into a pre-weighed porcelain crucible. The mass of the dried sediment was recorded with a precision of 0.01 g on an analytical balance. The sample was then placed inside a laboratory muffle furnace with stabilizing temperature control. The furnace was heated to 110 °C for a minimum of 6 hours to remove hygroscopic water absorbed onto the sediment particles. The furnace temperature was then lowered to 60 °C, at which point the sediments could be reweighed. The dried sediment was returned to the muffle furnace. The furnace was heated to 550 °C over 30 minutes and kept at 550 °C for 6 hours. The furnace temperature was then lowered to 60 °C, at which point the sediments could be reweighed. The mass lost during the 6 hour baking period relative to the 110 °C-dried mass is used as a metric of organic matter content (modified from Dean, 1974). Approximately 10 percent of the field samples were run in duplicate for LOI to assess precision. The mean difference for the spring and fall lab replicates is 0.04 and 0.10 percent, with a max of 0.17 and 0.25 percent, respectively. The physical parameters data for each surface sample are included in this report's data downloads.
Grain-Size Analysis
Grain-size analyses on the surface samples were performed using a Coulter LS200 (beckmancoulter.com) particle size analyzer, which uses laser diffraction to measure the size distribution of sediments ranging in size from clay (0.4 microns (µm)) to very coarse-grained sand (2 millimeters (mm)). All 99 surface samples collected were analyzed.
Prior to particle size analysis, organic material was chemically removed from the samples using approximately 8 mL of 30 percent hydrogen peroxide (H2O2) overnight. The H2O2 was then evaporated through slow heating on a hot plate, and the sediment was washed and centrifuged twice with deionized water.
To prevent shell fragments from damaging the Coulter LS200, particles greater than 1 mm in diameter were separated from all samples prior to analysis with a number 18 (1000 µm) U.S. standard sieve, which meets the American Society for Testing and Materials (ASTM) E11 standard specifications for determining particle size with woven-wire test sieves. The samples were washed through the sieve with filtered municipal water and a few milliliters of sodium hexametaphosphate solution to act as a deflocculant. The sediment slurry was sonicated with a wand sonicator for 30–60 seconds before being introduced into the Coulter LS200 to break down aggregated particles. Two subsamples from each sample were processed through the Coulter LS200 with a minimum of three runs apiece. The Coulter LS200 measures the particle-size distribution of each sample by passing sediment suspended in solution between two narrow panes of glass in front of a laser. The particles scatter light into characteristic refraction patterns that are measured by an array of photodetectors as intensity per unit area and recorded as relative volume for 92 size-classification channels, or bins. The size-classification boundaries for each bin were based on the ATSM E11 standard specification for wire cloth and sieves for testing purposes.
The raw grain-size data were then run through the free software program, GRADISTAT version 8, (Blott and Pye, 2001; kpal.co.uk/gradistat),which calculates the mean, median, sorting, skewness, and kurtosis of each sample geometrically in metric units and logarithmically in phi units (Φ) (Krumbein, 1934) using the Folk and Ward (1957) method. GRADISTAT also calculates the fraction of sediment from each sample by size category (for example, clay, coarse silt, fine sand) based on a modified Wentworth (1922) size scale. A macro function in Microsoft Excel, developed by the USGS SPCMSC, was applied to the data to calculate the average and standard deviation for each sample set (6 runs per sample), and highlight runs that varied from the set average by more than ± 1.5 standard deviations. Excessive deviations from the mean are likely the result of equipment error or extraneous organic material in the sample and are not considered representative of the sample. The highlighted runs were removed from the results, and the sample average was recalculated using the remaining runs. The raw, unaltered, individual run statistics and class size distribution as produced by GRADISTAT version 8 (Blott and Pye, 2001), as well as the averaged run statistics and class size distributions, are included in this report's data downloads.
Shear Stress Calculations
Critical shear stress or critical stress thresholds (τcr) for the surface sediments of Chincoteague Bay were calculated using the grain-size data from the spring and fall sampling trips following the procedure of Soulsby (1997) as
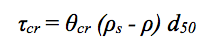
where θcr is the critical Shields parameter, ρs is the density of sediment (estimated to be 2,650 kilograms per cubic meter (kg/m3)), ρ is the density of seawater (1,027 kg/m3), and d50 is the median grain-size for an individual sample. This critical stress threshold formula outputs τcr in kilograms per meter squared (kg/m2), which was subsequently converted to Pascals (Pa), equivalent to Newtons per meter squared (N/m2), where 1 kg/m2 = 9.80665 Pa. The critical Shields parameter is calculated from a dimensionless sediment parameter, D*, as
![θcr = 0.30/(1+1.2D*) + 0.055 [1 – exp (-0.020D*)]](images/eq2.png)
with D* defined from the kinematic viscosity (v, taken as 1.36 × 10⁻⁶ meters squared per second (m2/s)) and gravity (g, 9.81 meters per second squared (m/s2)) as
![D* = d50 [g([(?s )/?]-1)/?^2 ]^(1/3)](images/eq.png) .
.
This critical stress threshold calculation, which predicts the incipient motion of sediments, is applicable for non-cohesive sediment. Within the USGS Sea Floor Stress and Sediment Mobility Database (Dalyander and others, 2012), cohesive sediments are defined by a clay content exceeding 7.5 percent of the total sediment fraction; however, van Ledden and others (2004) indicate cohesive sediment bed properties may not occur until clay content reaches 10 percent. Based on these metrics of cohesion (i.e., 7.5 and 10 percent clay content), the bulk of the lagoonal sediments collected in Chincoteague Bay are non-cohesive and the equations above based on the Shields parameter are applicable. The computed critical shear stress estimates for each surface sample are included in this report's data downloads.
