

Assessment of Water Levels, Nitrate, and Arsenic in the Carson Valley Alluvial Aquifer and the Development of a Data Visualization Tool for the Carson River Basin, Nevada
Links
- Document: Report (4 MB pdf) , HTML , XML
- Application Site: Carson River Basin Hydro Mapper Webapp
- Version History: Version History (5 KB txt)
- NGMDB Index Page: National Geologic Map Database Index Page (html)
- Download citation as: RIS | Dublin Core
Acknowledgments
The authors would like to thank Edward James of the Carson Water Subconservancy District for providing guidance and feedback on early stages of the project. We wish to thank Ron Kauble of the U.S. Geological Survey (USGS) for addressing database issues and for maintaining records, David Smith (USGS) for assistance with R-scripts for the statistical analysis, and Toby Welborn (USGS) for initial consultation on the Carson River Basin Hydro Mapper. We appreciate the input and reviews by David Smith, Philip Gardner, and Joseph Dolmagalski (USGS). We thank Rose Medina (USGS) for support on the map figures and Angela Paul (USGS) for technical insight on the report.
Abstract
Residents of Carson Valley, Douglas County, Nevada, rely on the basin-fill alluvial aquifer underlying the valley for drinking water. Since the 1980s, groundwater levels and water-quality data have been collected to monitor the status of the aquifer system and to assist in planning efforts to address current (2024) and future demand. The U.S. Geological Survey (USGS), in cooperation with Douglas County, Nevada, evaluated trends in water levels, nitrate, and arsenic concentrations from a network of monitoring and domestic wells in Carson Valley. This work also assessed the monitoring well network to determine the suitability of wells for characterizing the occurrence of arsenic in the groundwater. Monitoring of constituents, such as nitrate and arsenic concentrations, is needed to assess changes in contaminant distribution and to evaluate the effect that changing land use and groundwater pumping has on their occurrence and transport.
Results of the trend analysis indicate water levels are declining (p<0.05) in 17 of 26 selected monitoring wells (65 percent). Areas with the largest change in water levels, with more than 20 feet of declines, were within the community areas of Johnson Lane, Ruhenstroth, South Agricultural, East Valley, and Fish Springs. Variations in water levels measured in wells from the Central Agricultural, Minden, Foothill, Alpine County (one well), and Gardnerville Ranchos areas show periods of increase and decrease over time, but they also maintain long-term declining trends (p<0.05).
Increases in nitrate concentrations in groundwater samples collected from 9 out of 14 selected monitoring wells (64 percent) are statistically significant (p<0.05) within the Ruhenstroth, Gardnerville Ranchos, East Valley, Genoa, and Johnson Lane community areas. Samples collected from a well in Indian Hills/Jacks Valley indicated a decreasing trend in nitrate concentration over time. Nitrate concentrations in samples collected from wells in East Valley, Genoa, Johnson Lane, and Indian Hills/Jack Valley were consistently low (less than 3 milligrams per liter [mg/L]) and stable. Nitrate concentrations from selected wells in Johnson Lane and Garnerville Ranchos exceeded the U.S. Environmental Protection Agency (EPA) maximum contaminant level (MCL) of 10 mg/L (as nitrogen) and have trends that are increasing over time. In 2022, a sample collected from Johnson Lane had a concentration (7.3 mg/L) below the MCL with an increasing trend over time.
Temporal trend analyses for groundwater arsenic concentrations in Carson Valley could not be done because of a lack of temporal data. However, using available historical data, arsenic concentrations seem to be greater in groundwater from wells located on the eastern and northern areas of the valley than in wells located on the western or southern areas. Groundwater arsenic concentrations exceed 5 micrograms per liter (µg/L) in most samples collected from wells in Johnson Lane, Airport, Central Agricultural, and East Valley areas and in many cases exceed the U.S. Environmental Protection Agency (EPA) MCL of 10 µg/L. Data indicate that groundwater from domestic wells screened at deeper intervals are likely more vulnerable to elevated arsenic concentrations than shallower wells.
A groundwater network evaluation for Carson Valley identified potential modifications in the sampling locations and frequency to better understand the effect of groundwater pumping in communities where municipal and domestic demand are greatest, potentially enhancing understanding of contaminant transport in these areas. Potential modifications to the active well network include reducing the frequency of sample collection from existing network wells (6 out of 11) that have consistently shown low and stable nitrate concentrations, adding wells in areas where data are sparse, and increasing the number of wells in areas with elevated groundwater nitrate concentrations. Including the analysis of arsenic in samples from the active groundwater monitoring well network will provide more detail on the temporal and spatial variability of arsenic concentrations.
A visualization tool for the Carson River Basin was developed to provide access to discrete and near real-time hydrologic and water-quality data. The Carson River Basin Hydro Mapper (CBH; U.S. Geological Survey, 2023b) shows active and historical discrete water levels measured by the USGS and the State of Nevada Division of Water Resources, discrete groundwater nitrate and arsenic concentration data collected by the USGS, near real-time streamflow, and surface water levels for select waterbodies. The hydrologic data in the CBH provides resource managers, the public, and the scientific community with an easily accessible tool to present and communicate the most up-to-date information available about local and basin-wide water resources.
Introduction
The alluvial aquifer in Carson Valley (fig. 1) provides water resources for municipal, agricultural, and domestic uses. In 1982, the U.S. Geological Survey (USGS) and Douglas County developed a network of wells throughout the valley for monitoring depth to water and groundwater quality (Garcia, 1989). The network consists of both monitoring and domestic wells throughout many community areas of Douglas County, Nevada, with one well in Alpine County, California. The data are vital in interpreting changes in valley water levels, groundwater flow, and water quality that can be used to inform the effective management of groundwater resources (Maurer, 1986; Garcia, 1989; Thodal, 1996; Yager and others, 2012; Naranjo and others, 2013; Kitlasten and others, 2021).
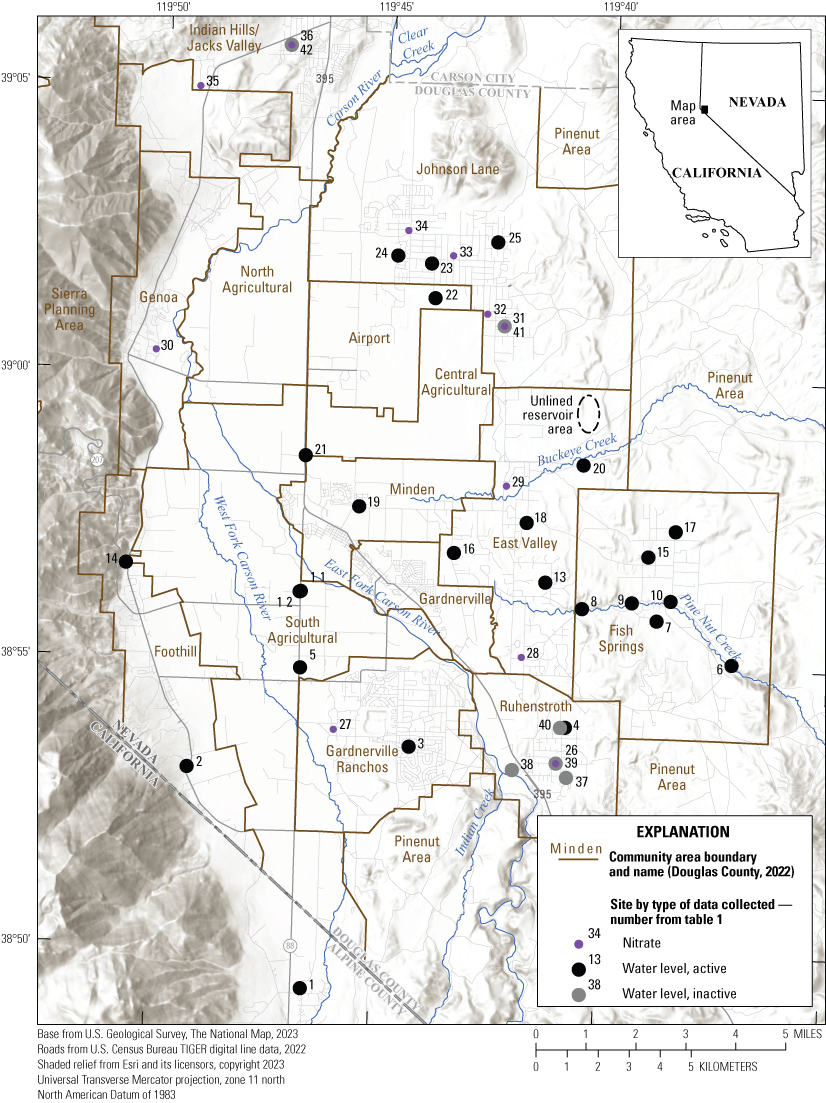
Location of major drainages, community areas, groundwater level, and nitrate monitoring within Carson Valley, Douglas County, Nevada, and Alpine County, California. Select inactive wells were included given the long period of record available at these locations. Boundaries of community areas defined in Douglas County (2021).
Long-term monitoring of water levels throughout Carson Valley provides essential information for the effective management of the aquifer. The long-term datasets show water-level declines because of groundwater pumping in community areas east of the Carson River (Maurer and Berger, 2007; Yager and others, 2012). Groundwater declines in areas of Carson Valley may have contributed to residents’ decision to deepen wells. Since 1980, 239 domestic wells have been deepened within select community areas of Carson Valley (State of Nevada Division of Water Resources, 2022). Screening domestic wells deeper in the aquifer may have unintended consequences for water quality. It has been previously documented that nitrate levels in groundwater are greater near the aquifer surface, whereas arsenic concentrations generally increase with depth (Naranjo and others, 2013; Paul and others, 2017). Although deepening domestic wells in response to declining water levels may provide a more reliable water supply and reduce the potential for nitrate exposure to the well owner, it could result in water being withdrawn from areas within the aquifer that contain higher concentrations of arsenic.
Shallow groundwater is susceptible to nitrate contamination from anthropogenic sources at the land surface (Nolan and others, 2002). The U.S. Environmental Protection Agency (EPA) has established a drinking-water criterion maximum contaminant level (MCL) for nitrate at 10 milligram per liter (mg/L; as nitrogen; U.S. Environmental Protection Agency, 2024) based on findings of methemoglobinemia in infants (Ward and others, 2018). However, epidemiological studies have reported that long-term exposure to water with nitrate concentrations below the MCL but greater than 2 mg/L may be associated with adverse health effects, such as cancer, birth defects, and preterm births (Ward and others, 1996, 2010; Bukowski and others, 2001; Weyer and others, 2001; De Roos and others, 2003; Chiu and others, 2007). Nitrate is a common contaminant in shallow groundwater in areas where fertilizers and treated effluent are applied for agricultural purposes and in areas of dense septic system use (Lico, 1997; Thomas and others, 1999; Paul and others, 2007; Naranjo and others, 2013).
In focused investigations, elevated nitrate concentrations were identified in community areas of Johnson Lane, Ruhenstroth, Gardnerville Ranchos, (Naranjo and others, 2013) and in the foothill areas of Indian Hills/Jacks Valley (Thomas and others, 1999; fig. 1). These elevated concentrations are because of nitrogen exiting septic system leach fields and undergoing transformations in the unsaturated zone before entering the aquifer (Canter and Knox, 1985). Another potential pathway of nitrate transport to groundwater is the application of secondary treated effluent on fields for irrigation and in leaky sewage-effluent ponds (Lico, 1997; Alvarez and Seiler, 2004). In Carson Valley, the use of treated wastewater effluent is substantial, accounting for the second largest source of water, after the use of the Carson River, at approximately 10,000 acre-feet per year (acre-ft/yr) between 1990 and 2015 (Kitlasten and others, 2021). Wells in agricultural areas were observed to have lower nitrate concentrations than those in residential areas, but there were few wells sampled near effluent reuse areas (Naranjo and others, 2013).
Stable isotopes can be used to identify sources of nitrate, but isotopic signatures can overlap, making interpretation challenging (Kendall and others, 2010). For example, effluent from septic systems has been identified as the primary source of nitrate in groundwater in the Indian Hills area of Douglas County (Thomas and others, 1999). Within the Johnson Lane and Ruhenstroth areas, stable isotopes revealed a mixture of effluent and soil nitrogen (Naranjo and others, 2013). Other sources, such as those derived from agriculture including livestock waste or synthetic fertilizers, have not been identified as potential sources to groundwater from a subset of samples analyzed for stable isotopic signatures (Thomas and others, 1999; Naranjo and others, 2013). Nutrients sourced from groundwater and surface water discharging to the Carson River have been the focus of investigations seeking to explain excessive algal blooms, increased biological oxygen demand, and nutrient cycling in the river system (Alvarez and Seiler, 2004; Alvarez and others, 2018).
The transport and fate of nitrate in groundwater is affected by many factors associated with the physical, geochemical, and biological conditions in the aquifer. Depending on groundwater redox conditions, once introduced into the aquifer, nitrate is readily mobile and vulnerable to transformation (McMahon and Chapelle, 2008). If aquifer conditions are anoxic and contain labile carbon, nitrate can undergo transformation to nitrogen gas through denitrification (McMahon and Chapelle, 2008). In Carson Valley, stable isotopic analysis of groundwater samples collected in select monitoring wells indicated no evidence of denitrification (Naranjo and others, 2013).
Arsenic is a common naturally occurring contaminant in groundwaters throughout the western United States (Thiros and others, 2015). Conditions associated with arsenic concentrations in groundwater exceeding the EPA drinking water MCL criterion of 10 micrograms per liter (µg/L; U.S. Environmental Protection Agency, 2024) include leaching from arsenic bearing volcanic rock and soil materials, long groundwater flow paths, desorption from the use of phosphate-based fertilizers (Welch and others, 1988; Welch and Lico, 1998; Busbee and others, 2009; Anning and others, 2012). Over time, exposure to elevated concentrations of arsenic has been associated with increased risk of diseases, including certain cancers (skin, lung, bladder, and kidney), peripheral vascular disease, hypertension, and diabetes (Hopenhayn, 2006; Saint-Jacques and others, 2014). Arsenic also causes increased incidences of infant mortality and low birth weight (Hopenhayn, 2006).
The basin-fill aquifer underlying the Carson Valley aquifer is primarily composed of weathered granitic and volcanic material (Welch, 1994; Maurer and others, 2009). The vulnerability of groundwater to arsenic contamination depends on aquifer material, groundwater pumping rates, well screened intervals, and aquifer geochemical conditions (Focazio and others, 2002; Anning and others, 2012). Arsenic mobility and transport in groundwater is affected by groundwater interaction with aquifer materials (rocks and sediments), redox conditions in the aquifer, and the form or species of arsenic (Busbee and others, 2009). Although there are few focused studies on the occurrence and transport of arsenic within Carson Valley, regional evaluations have provided insight on the spatial distribution of arsenic. For example, arsenic data collected from domestic wells in northern Nevada and northeastern California showed that 22 percent of the 174 domestic wells sampled had arsenic exceeding the MCL (Arienzo and others, 2022). Saftner and others (2023) determined that there is a greater than 50-percent probability of elevated arsenic in untreated well water for approximately 49,000 (64 percent) households in northern Nevada, northeastern California, and western Utah that rely on alluvial aquifers for domestic water supply.
Water resource managers in Carson Valley have expressed concern about how the effects of a future development will affect water availability and quality. Concerns are focused on increased demand for municipal supply, pumping effects on water chemistry, groundwater-level declines, and managing elevated concentrations of nitrate and arsenic. To better understand the water availability and water quality, the USGS, in cooperation with Douglas County initiated this investigation to describe spatial and temporal trends in water levels, nitrate, and arsenic, to evaluate the groundwater monitoring network, and to develop an online tool for tracking changes in water quality and quantity within the Carson River Basin.
Purpose and Scope
The objective of this report was to summarize the spatial and temporal trends in water levels, nitrate, and arsenic for the Carson Valley groundwater monitoring network, to evaluate the effectiveness of the monitoring network, and to develop a web tool to visualize hydrologic data in the Carson River Basin. The web mapping data visualization tool (U.S. Geological Survey, 2023b) also provides a portal to ongoing and historical arsenic and nitrate concentrations collected from wells, springs, and surface water, information stored within the USGS’s National Water Information System (NWIS) database (U.S. Geological Survey, 2022) and groundwater level data collected by the State of Nevada Division of Water Resources (2022).
Description of Study Area
Carson Valley is in western Douglas County, Nevada, south of Carson City extending southward to Alpine County, California. The floor of the valley is roughly oval-shaped, approximately 20 miles (mi) long and 8 mi wide, and slopes from about 5,000 ft above sea level at the southern end of the valley to about 4,600 ft at the northern end (fig. 1). On the western side of Carson Valley, the Carson Range of the Sierra Nevada rises abruptly from the valley floor, with peaks ranging from 9,000 to nearly 11,000 ft above sea level. The valley is bordered on the east side by the Pine Nut Mountains, which rise more gradually to peaks ranging from 8,000 to nearly 9,500 ft above sea level.
The dominant hydrologic features of Carson Valley are the East and West Forks of the Carson River, which join about 3 mi northwest of Minden (fig. 1). Other surface water features include small streams, including Indian Creek, Pine Nut Creek, and Buckeye Creek, that drain the Carson Range and Pine Nut Mountains and a network of irrigation channels and sloughs. Buckeye and Pine Nut Creeks only reach the valley floor and the Carson River during spring runoff in extremely wet years or large floods (Yager and others, 2012). Carson River streamflow is dependent on snowpack, groundwater discharge, and, to a lesser degree, local runoff from direct rainfall (Maurer and Berger, 2007). Irrigation diversions, return flows, and importation of sewage effluent can also have an effect on streamflow (Covay and others, 1996).
Maurer and others (2009) describe groundwater near the center of the valley flowing parallel to the mainstem Carson River northward until it nears the northern terminus of the valley where it begins flowing northeast following the river. Groundwater hydraulic gradients decrease from about 100 feet per mile (ft/mi) in southwest valley areas to about 5 ft/mi in northern valley areas (Maurer and others, 2009). Annually, about 20 percent of river streamflow is lost through Carson Valley (Maurer and others, 2009). Groundwater inflow from the California part of Carson Valley ranges from 4,000 to 8,000 acre-ft/yr, with an average of 6,000 acre-ft/yr (Maurer and Berger, 2007).
Water used to irrigate agricultural fields in Carson Valley includes East and West Fork Carson River surface water, pumped groundwater, and imported treated effluent (Maurer and Berger, 2007; Maurer and others, 2009). Along the western edge of the valley, groundwater flow is generally from the mountain-front areas toward the river (Maurer, 1986; Maurer and others, 2009). Groundwater underlying the southeastern area of the valley flows northwesterly toward the Carson River (Maurer and others, 2009).
Groundwater-level and water-quality data obtained from the monitoring network have been used to estimate a water budget for the valley (Maurer and Berger, 2007), to understand water-quality patterns (Garcia, 1989; Thodal, 1996), and to predict water resource responses to different water use planning and climate change (Yager and others, 2012; Naranjo and others, 2013; Kitlasten and others, 2021). The groundwater-level and nitrate-concentration measurements are obtained from wells ranging in depth from 11 to 608 ft below land surface (table 1) and are sparsely distributed throughout the valley (fig. 1). The network of wells used for monitoring water levels and nitrate was established in the 1980s and has largely remained unchanged since 2010. In some places, domestic wells were removed from the monitoring network at the request of homeowners or when property ownership changed.
Table 1.
Site information for wells monitored for water-level and nitrate concentrations in the Carson Valley groundwater monitoring network, 1970 to 2022.[Data collected for sites in this table can be accessed in the U.S. Geological Survey (USGS) National Water Information System database (U.S. Geological Survey, 2022) using USGS site identifiers. Coordinates are referenced to North American Datum of 1983 and North American Vertical Datum of 1988. Altitude is referenced to North American Vertical Datum of 1988. Community areas provided by Douglas County, Nevada, updated on December 21, 2022. Map identifier (ID) 1 is not in a community area of Douglas County. Abbreviation: ft, feet]
Methods
Groundwater-level data, nitrate, and arsenic concentrations were grouped by community area (Douglas County, 2021). The USGS actively measures water levels at 25 wells and nitrate at 11 wells annually in Carson Valley (fig. 1). All monitoring wells for which nitrate and arsenic concentration data were available within the USGS NWIS database were used to illustrate the spatial extent of nitrate and arsenic occurrence within the valley. Although periods of record differ between nitrate and arsenic concentration data, the most current concentration data for each well was used to map the spatial distribution of each constituent within Carson Valley.
Water-Level and Nitrate Monitoring
Water-level measurements were made using standard USGS protocols for discrete water-level measurements using steel or electric tapes (Cunningham and Schalk, 2011). Water-quality samples were collected using USGS protocols for sampling wells (U.S. Geological Survey, 2018, 2023a). The discrete water-level and water-quality data collected from the groundwater monitoring network in Carson Valley are published online through the NWIS (U.S. Geological Survey, 2022).
The active groundwater level and nitrate wells monitored by the USGS range in depth from 11 to 608 ft below land surface (table 1). Spatially, the wells are sparsely distributed throughout Carson Valley (fig. 1). The network of wells used for monitoring water levels and nitrate was established in the 1980s and has largely remained consistent since 2010 with added water-level wells in Fish Springs and Johnson Lane community areas. Ruhenstroth, Gardnerville Ranchos, Alpine County, and the Airport community areas have only one water level well. To supplement the trend assessment, selected inactive wells were included for Ruhenstroth, Johnson Lane, and Indian Hills/Jacks Valley because, although these well locations were removed from the network, the wells have long-term monitoring data (greater than 5 years) that are valuable for this analysis.
The total number of domestic wells, deepened wells, water levels, and nitrate and arsenic measurements within each community area are shown in table 2. From 1980 through 2022, 171 out of 239 (70 percent) domestic wells deepened were located in the community areas of Johnson Lane, Ruhenstroth, East Valley, and Indian Hills/Jacks Valley. The listed water-level wells and measurements correspond to the monitoring network from 1970 to 2022. Additional water-level data are available from inactive wells throughout the valley. The highest number of groundwater samples collected for nitrate analysis are within the active monitoring network that include Johnson Lane, Indian Hills/Jacks Valley, Ruhenstroth, and Gardnerville Ranchos. These areas were also included in previous investigations to evaluate the extent, sources, trends, and transport of nitrate (Thodal, 1996; Thomas and others, 1999; Rosen, 2003; Shipley and Rosen, 2005; Naranjo and others, 2013).
Table 2.
The total number of domestic wells, deepened wells (1980 to 2022), monitoring wells, and measurements from the community areas of Carson Valley for water levels (1970 to 2022), nitrate (1983 to 2022), and arsenic (1960 to 2019).[The number of water level wells and measurements listed are for the active monitoring network. The number of nitrate and arsenic wells and measurements include active and inactive wells. Data is available in National Water Information System (U.S. Geological Survey, 2022). Domestic well database obtained from Nevada Division of Water Resources (2022). Water level measured in Alpine County is not within a community area in Carson Valley. Abbreviation: mi2, square miles]
During a subset period from 1980 to 2022, the extent (number and distribution of sites) of monitoring varied (fig. 2). From 1985 to 1987, Thodal (1996) analyzed data from monitoring wells representing different land uses and sampled at varying frequencies (bimonthly, quarterly, and annually) to determine baseline groundwater chemistry conditions for Douglas County (including Carson Valley). Since that time, variation in sampling frequency has occurred because of updates to the monitoring well network, other monitoring efforts occurring within the valley, and changing well owner participation. In support of an investigation into water planning and modeling, water-level measurements increased from 2005 to 2006 (Yager and others, 2012). The increased number of nitrate measurements occurring from 2008 to 2009 was associated with a study designed to identify the source and fate of nitrate within the valley (Naranjo and others, 2013). Since the evaluation by Thodal (1996), there have been only discrete periods of arsenic monitoring (fig. 2C).
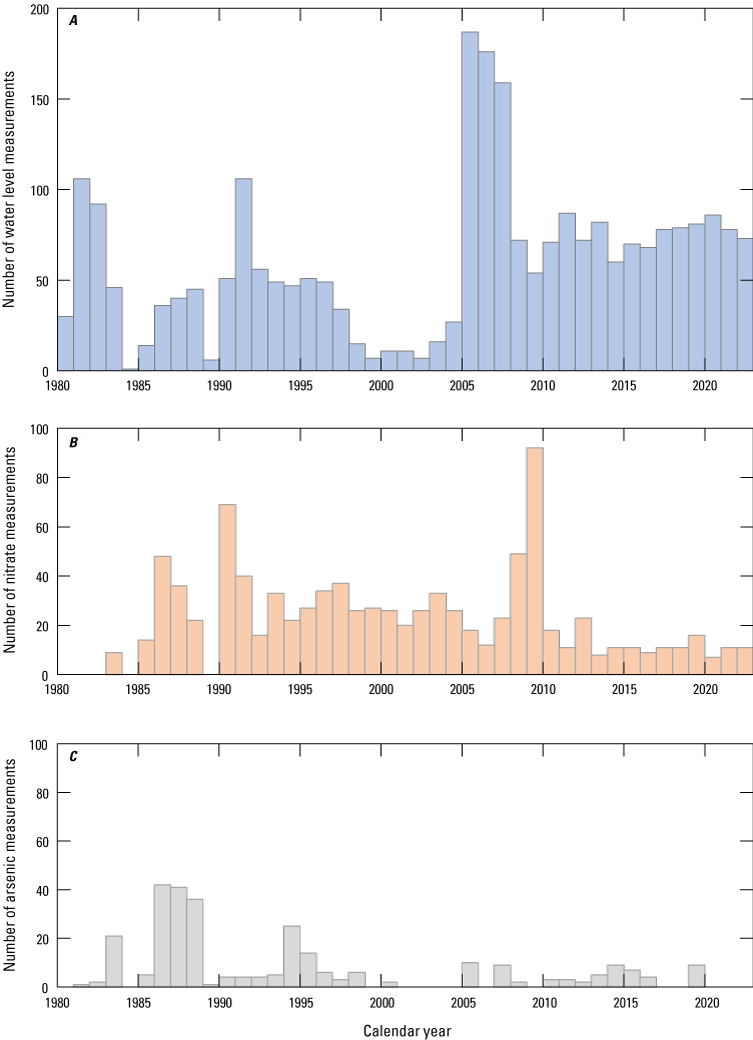
Number of A, water-level; B, nitrate; and C, arsenic measurements in samples collected from monitoring wells in Carson Valley per year, 1980–2022 (U.S. Geological Survey, 2022). Water-level measurements were collected at wells in the active monitoring network. Groundwater samples collected for nitrate analyses were part of previous U.S. Geological Survey (USGS) investigations and the active network. Samples collected for arsenic analyses were taken periodically during USGS investigations and are not routinely sampled as part of the active network.
Trends in Water Levels and Nitrate Concentration
Water-level measurement and nitrate concentration trend assessments used data from active and selected inactive wells of the Carson Valley monitoring well network, as available from the USGS NWIS database (U.S. Geological Survey, 2022). The period of trend analysis for water levels was from 1970 to 2022. Time-series (temporal) variations in water levels are presented graphically by computing water-level change from the first measurement at the onset of monitoring. For these analyses, the depth to water was used to evaluate trends. Therefore, if the trend in depth to water is decreasing, water levels are rising. If the trend in depth to water is increasing, water levels are declining. Water-level measurements made immediately after well construction were not used in calculations because water-level perturbations from the process of drilling or injection of drilling fluid often have not equilibrated. Trend analysis for nitrate concentrations used data from the monitoring network obtained from 1983 to 2022. Changes in the depth to water and nitrate concentrations over time were analyzed in the statistical programming language R (R Core Team, 2021) using the Mann-Kendall nonparametric statistical test (Helsel and others, 2020) and were consistent with data analyses used by others (Thodal, 1996; Rosen, 2003; Shipley and Rosen, 2005; Naranjo and others, 2013). With this test, we chose an alpha value of less than 0.05 to represent a statistically significant monotonic trend at the 95-percent confidence limit. P-values greater than 0.05 are not considered statistically significant. Positive tau values indicate increasing trends, and negative tau values indicate decreasing trends. Spatial patterns of arsenic concentrations were mapped across Carson Valley, but given the lack of data, statistical trend analysis for arsenic could not be done.
Assessment of the Carson Valley Groundwater Monitoring Well Network
According to Garcia (1989), the groundwater monitoring well network in Douglas County (including Carson Valley) was designed to (1) monitor areas where heavily pumped municipal wells could draw in contamination or sites in areas with high potential for contamination; (2) gather data for long-term trend assessment of water quality; and (3) supplement data gaps and help define new sources of contamination. The intent was to design a monitoring network with the flexibility to adjust to changing groundwater conditions to better define the causes for the changes. As information on the long-term status of nitrate concentrations in Carson Valley become available, it may be necessary to adjust the network to ensure monitoring data provides suitable information for water resource planning purposes.
In the Carson Valley aquifer system, the well screen interval will affect the water quality drawn from wells. The general conceptual model shown on figure 3 illustrates the findings of Naranjo and others (2013) and Paul and others (2017) regarding the distribution of nitrate and arsenic in the alluvial aquifer of Carson Valley. Arsenic data assembled by Paul and others (2017) for the Gardnerville Ranchos, Minden, Gardnerville, Ruhenstroth, and Pinenut areas were shown to increase in concentration with aquifer depth. Deeper aquifer conditions also reflect longer flow paths, older groundwater, and greater contact with sediments, increasing the solubility and mobility of arsenic (Anning and others, 2012). Samples collected from wells throughout the valley (Naranjo and others, 2013) have shown nitrate concentrations near the water table are higher where inputs from septic systems are focused and steeply decrease with aquifer depth. The sharp gradients in nitrate concentrations are affected by oxidation-reduction (redox) conditions of the aquifer and the denitrification process (Naranjo and others, 2013). The State of Nevada well inventory database indicates that 239 wells have been deepened in select community areas of Carson Valley since 1980 (State of Nevada Division of Water Resources, 2022). As domestic wells are deepened into the alluvial aquifer, they may have different water-quality characteristics. Given the risks to domestic and municipal water supply, the monitoring well network was reviewed to provide management considerations for potential updates to the nitrate and arsenic network in Carson Valley. The number of measurements per community area and the variability in concentrations and trends are important considerations in identifying needs for water resource planning. The assessment included a review of the existing and historical monitoring well data, knowledge gained from published reports, and a review of the monitoring frequency.
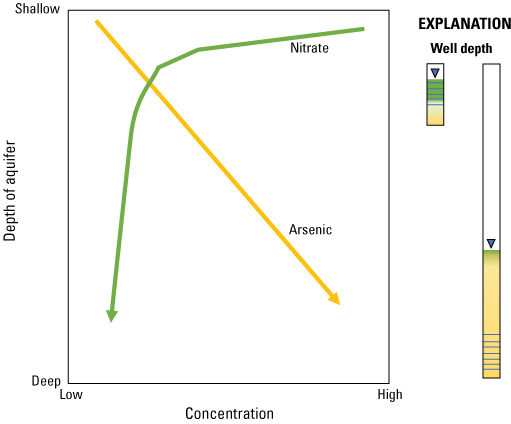
Conceptual diagram of nitrate and arsenic concentrations with aquifer depth in Carson Valley. Wells with well screens near the surface are more susceptible to high groundwater nitrate concentrations (Naranjo and others, 2013). Groundwater from wells with well screens deeper into the aquifer are less likely to have high nitrate concentrations detected and more likely to contain higher arsenic concentrations (Paul and others, 2017).
Carson River Basin Hydro Mapper
A web-based data visualization tool was developed to improve the dissemination and presentation of USGS data and other hydrologic data relevant to the Carson River Basin. The hydrologic dashboard, called the Carson River Basin Hydro Mapper (CBH), provides near real-time climate (snow water equivalent, precipitation, soil moisture), streamflow, and surface-water level data (for example, Lahontan Reservoir storage and level). The CBH interfaces with the USGS NWIS and the USGS National Map Services for watershed extents, the Natural Resources Conservation Service for snow measurement locations, the National Weather Service for rainfall and snow water equivalent, the National Oceanic and Atmospheric Administration for weather radar, and Douglas County, Nevada, for Carson Valley community area boundaries (table 3). The tool includes an interactive map viewer showing near real-time information and available discrete groundwater-level and water-chemistry data for select constituents. Assembling the integrated data into a single repository will allow for easier retrieval, analysis, and interpretation of data as they relate to important aspects of water resource management within the Carson River Basin.
Table 3.
Datasets and data sources included in the Carson River Basin Hydro Mapper (U.S. Geological Survey, 2023b).[Three examples out of 16 basemap coverages are listed below. Descriptions and links to data sources are also available within the legend tab of the Carson Basin Hydromapper. Abbreviations: Esri, Environmental Systems Research Institute; GIS, Geographic Information System; USGS, U.S. Geological Survey]
| Data type | Visualization | Source | Data Availability |
|---|---|---|---|
| Streamflow gage | Real-time status | National Water Information System | https://waterdata.usgs.gov/nwis |
| Surface-water level gage | Real-time status (stream, lake, wetland, reservoir) | National Water Information System | https://waterdata.usgs.gov/nwis |
| Discrete streamflow observations | Active and inactive sites | National Water Information System | https://waterdata.usgs.gov/nwis |
| Discrete groundwater level observations | Active and inactive sites | National Water Information System | https://waterdata.usgs.gov/nwis |
| Arsenic concentrations | Active and inactive sites | National Water Information System | https://waterdata.usgs.gov/nwis |
| Nitrate concentrations | Active and inactive sites | National Water Information System | https://waterdata.usgs.gov/nwis |
| Streamflow measurements | Active and inactive sites | State of Nevada Division of Water Resources | https://waterdata.usgs.gov/nwis |
| Groundwater measurements | Active and inactive sites | State of Nevada Division of Water Resources | https://waterdata.usgs.gov/nwis |
| Snow telemetry | Snow water equivalent and soil moisture | National Water and Climate Center | https://www.nrcs.usda.gov/programs-initiatives/sswsf-snow-survey-and-water-supply-forecasting-program/national-water-and |
| Alerts | Advisory watch | National Weather Service | https://www.weather.gov/ |
| Radar | 1-hour loop | National Oceanic and Atmospheric Administration NowCoast | https://nowcoast.noaa.gov/ |
| Recent rainfall | 1-hour to 3 days | Iowa State University | https://mesonet.agron.iastate.edu/ |
| Rainfall forecast | 6-hour to 6 days | National Weather Service | https://www.weather.gov/ |
| Snow | Depth and equivalent | National Weather Service National Operational Hydrologic Remote Sensing Center | https://www.nohrsc.noaa.gov/nsa/ |
| Cloud cover | Visible, infrared, water vapor | University of Wisconsin-Madison | https://realearth.ssec.wisc.edu/doc/ |
| Temperature | Distributed air temperature | University of Wisconsin-Madison | https://realearth.ssec.wisc.edu/doc/ |
| Drought | Composite index | U.S. Drought Monitor | https://droughtmonitor.unl.edu/ |
| Wildfire | Recent and 20-year historic | National Interagency Fire Center | https://data-nifc.opendata.arcgis.com/ |
| Rivers | Waterbody, stream, intermittent stream | USGS National Map Services | https://apps.nationalmap.gov/viewer/ |
| Watersheds | Watershed boundary | USGS National Map Services | https://hydro.nationalmap.gov/arcgis/rest/services/wbd/MapServer |
| Aquifers | Areal extent of uppermost principal aquifer | USGS National Map Services | https://hydro.nationalmap.gov/arcgis/rest/services/wbd/MapServer |
| Douglas County community areas | 15 community areas | Douglas County, Nevada | https://douglasnvgis.maps.arcgis.com/home/item.html?id=ff3a6cb0322f4e21a4916d42fee5adb6#overview |
| Topographic | Boundaries, cities, water features, physiographic features | Esri ArcGIS online | https://services.arcgisonline.com/ArcGIS/rest/services/World_Topo_Map/MapServer |
| Imagery | 0.3-meter resolution satellite and aerial imagery | Esri ArcGIS online | https://services.arcgisonline.com/ArcGIS/rest/services/World_Imagery/MapServer |
| USGS topo | Boundaries, geographic names, transportation, contours, hydrography, land cover, shaded relief, and bathymetry | USGS National Map Services | https://hydro.nationalmap.gov/arcgis/rest/services/wbd/MapServer |
Results
This section discusses the results of the analysis, beginning with the trends in groundwater levels, nitrate, and arsenic. Then, results related to the spatial distributions of nitrate and arsenic concentrations within Carson Valley are presented to describe the range in concentrations identified from the monitoring network within each community area. Well depth information for all wells in the network are provided in table 1. Graphic representations of temporal trends in water levels and nitrate are also presented. However, insufficient data exist for assessing trends in arsenic concentrations. Water-quality and water-level data may be obtained from the USGS NWIS database (U.S. Geological Survey, 2022). Water-level data collected by the Nevada Division of Water Resources (State of Nevada Division of Water Resources, 2022) can be viewed along with USGS data in the CBH.
Temporal Trends in Groundwater Levels
The change in water levels measured in the active well network in each community area are shown on figure 4. Select monitoring wells within the community areas of Johnson Lane, East Valley, Fish Springs, and Ruhenstroth have had more than 20 ft of water-level decline since the 1980s, with the onset of decline starting in the 1980s (figs. 4G, I–K). Water levels measured at monitoring well 22 in the Airport community area steadily declined by 14 ft at a rate of −2.9 feet per year (ft/yr) over the 41-year record (1981–2022; fig. 4A). Select wells within the community areas of Central Agriculture, Minden, Foothill, Alpine County, Gardnerville Ranchos, and South Agriculture fluctuate with rising and falling water levels likely because of recharge from the Carson River and proximity to nearby groundwater pumping wells (figs. 4B–F, H).
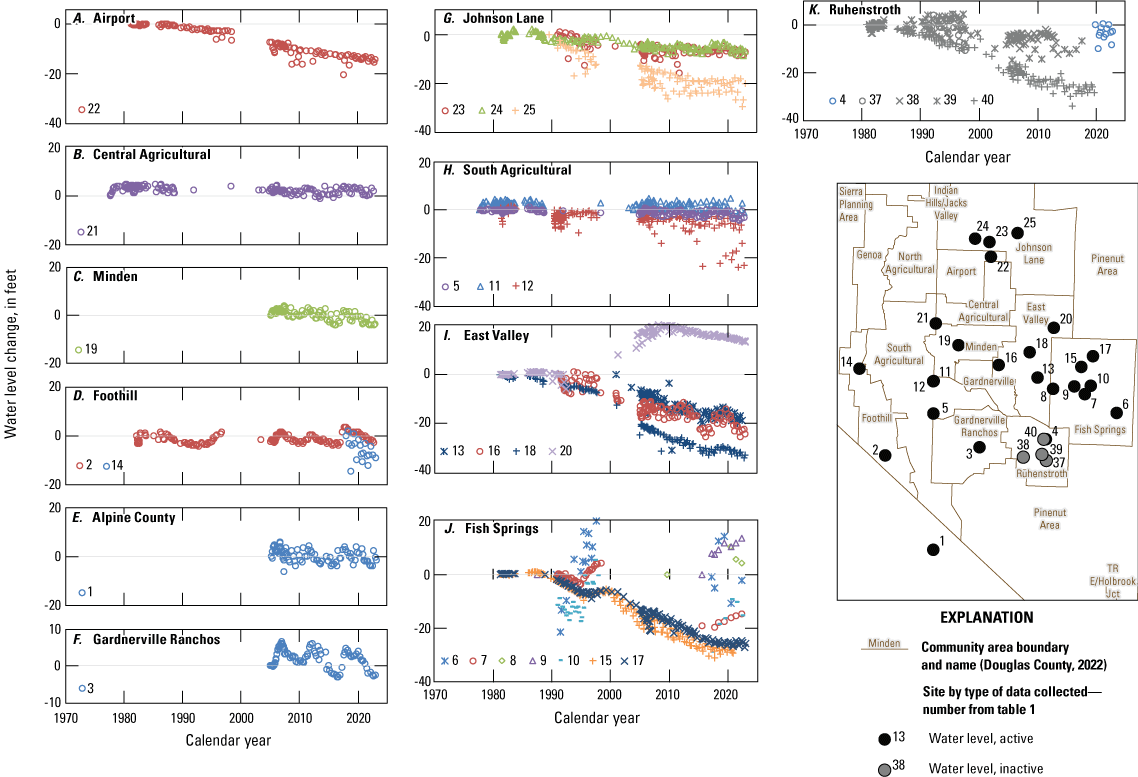
Water-level change observed in selected wells in the monitoring network for the community areas of A, Airport; B, Central Agricultural; C, Minden; D, Foothill; E, Alpine County; F, Gardnerville Ranchos; G, Johnson Lane; H, South Agricultural; I, East Valley; J, Fish Springs; and K, Ruhenstroth. Data available in the National Water Information System (U.S. Geological Survey, 2022). Locations of wells are shown in the inset map.
At Johnson Lane, monitoring wells in proximity to agricultural well 24 (well depth=218 ft) show similar patterns of decline (fig. 4G). The slope of water-level decline was −0.2 ft/yr at monitoring wells 23 and 24 over the 32-year (1990–2022) and 41-year record (1981–2022), respectively. For both wells, the most recent observation in 2022 reflects an average 7 ft of decline over the period of record. Monitoring well 25 underwent 20 ft of decline at a rate of −0.6 ft/yr over the 32-year record (1990–2022; fig. 4G). There is a substantial difference in the magnitude of decline and rate between two wells relatively close together, wells 23 and 24, and the more distal well 25. Using the average magnitude of decline of 7 ft and a rate of 0.22 ft/yr, well 25 declined an additional 13 ft and at nearly twice the rate at 0.41 ft/yr. At well 25, a long-term decline and annual variations likely were caused by a decrease in aquifer storage because of seasonal groundwater pumping. Well 23 and 24 water-level declines corresponded over the period of monitoring, but well 25 seems to have higher seasonal variations.
The change in water levels at monitoring wells 5 and 11 in South Agricultural were not apparent (fig. 4H). Variations in water levels between these wells and well 12 are depth dependent and are influenced by recharge from the Carson River, agricultural irrigation, (ditches), and groundwater pumping. Water-level change widely varied between 6.5 and 24 ft at monitoring well 12, a deeper (well depth=430 ft) agricultural well that is subjected to seasonal groundwater pumping. The well depths at monitoring wells 5 and 11 are relatively shallow (well depths=15 and 20.5 ft, respectively) and likely receiving sufficient replenishment from recharge from the land surface. Well depth information for all wells in the monitoring network used in this study is provided in table 1.
At East Valley, water levels measured at most monitoring wells are in decline. However, monitoring well 20 increased during an 8-year period between 1992 and 2001(fig. 4I). The water level at monitoring well 20 reached a maximum increase of 20 ft in 2008 and slowly declined 7 ft at a rate of −0.5 ft/yr. Coincidently, nearby monitoring well 18 had a water-level decline of 34 ft at a rate of −0.8 ft/yr during the 41-year record (1981–2022). The rate of water-level decline was also −0.8 ft/yr at monitoring well 16 during the 31-year record (1991–2022; fig. 4I). The rate of water-level decline was 60 percent greater at monitoring well 13 (−1.2 ft/yr) than the average rate of nearby wells 20, 16, and 18 (average=−0.7 ft/yr) during the more recent 22-year record (2000–22).
At Fish Springs, observed water levels vary widely at select wells with less than 10 years of record, from increasing to decreasing (fig. 4J). However, water-level declines are apparent at monitoring wells 7, 15, and 17. Although there is a 17-year gap in data at monitoring well 7, water levels have declined by 15 ft over the 32-year period (1990–2022). Declines were also observed at monitoring wells 15 and 17, which decreased by 27 and 26 ft over the 32- (1989–2021) and 41-year (1981–2022) record, respectively (fig. 4J). Although well 15 is considerably deeper (well depth=608 ft) than well 17 (well depth=95 ft) and is an agricultural well, the change in water levels closely compare over the period of monitoring.
The Ruhenstroth area has historically shown declining water levels (Maurer and Berger, 2007; Naranjo and others, 2013). However, the well network has been modified with the removal of several well locations where levels were monitored consistently since the 1980s, and the introduction of new monitoring locations which has disrupted our tracking of long-term water levels and began a new period of measuring water-level change. For example, monitoring well 4 was only recently added to the network in 2019 (fig. 4K). Over the 3-year period, water levels in well 4 have varied 8 ft, with the last measurement in 2022 showing a decline of 3 ft or −0.9 ft/yr. Inactive monitoring wells 37, 38, 39, and 40 provide a longer period of record of water-level change that has occurred since the 1980s. Monitoring well 37 had 11 ft of water-level decline over the 7-year record (1990–97) at a rate of −1.6 ft/yr. Monitoring well 38 had a water-level decline of 12 ft during the 32-year record (1981–2013) at a rate of −0.4 ft/yr. Monitoring well 39 had 7 ft of water-level decline over the 30-year record (1987–2017) at a rate of −0.2 ft/yr. Monitoring well 40, with a longer period of continuous measurement, measured 30 ft of water-level decline over the 38-year record (1981–2019) at a rate of −0.7 ft/yr.
The changes in water levels near monitoring well 20 in East Valley were examined more closely with time-lapse imagery and data from monitoring well 20 (fig. 5). The imagery indicates that the reservoirs were constructed between 1990 and 1994 and in use until 2006 just north of monitoring well 20. During that period, the reservoirs were unlined and stored reclaimed water temporarily on private property (Ed James, Carson Water Sub-Conservancy District, written commun., 2022). The period water was stored in the reservoirs coincides with a 20-ft increase in water levels at monitoring well 20 and a subsequent decline from reduction of recharge.
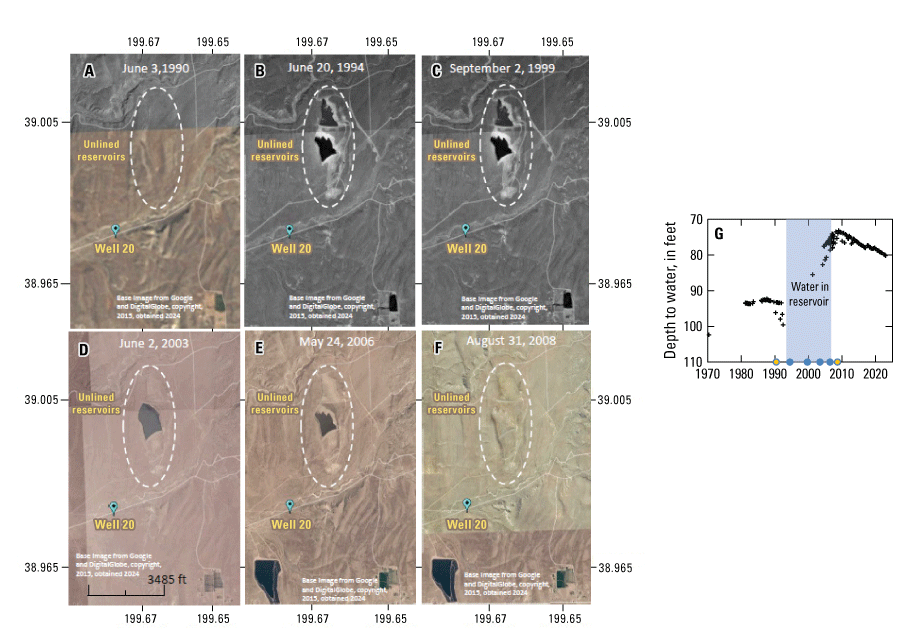
Time-lapse imagery (DigitalGlobe, copyright 2015, images obtained February 20, 2024) on A, June 3, 1990; B, June 20, 1994; C, September 2, 1999; D, June 2, 2003; E, May 24, 2006; and F, August 31, 2008. Unlined reservoirs (dash ellipses) in East Valley were used to temporarily store reclaimed water. The reservoirs were constructed between 1990 and 1994 and in use until 2006 just north of well 20 (USGS 385834119395901). By 2008, the reservoirs were no longer in use and have since remained dry. Shown in G, the timing of use coincides with the rise and subsequent decline in well 20 water levels (U.S. Geological Survey, 2022). The + symbols are measurements of depth to water, filled circles correspond to dates of images, blue filled circles are reservoir in use and yellow filled circles are reservoir not in use. Location of well 20 and reservoirs are shown on figure 1.
Spatial Distributions in Nitrate and Arsenic Concentrations
The spatial variability in the most current measurements of nitrate and arsenic concentrations in groundwater within Carson Valley are shown on figure 6. Figure 6A shows that most wells have nitrate concentrations of less than 5 mg/L. However, there are notable groups of wells within Indian Hills/Jacks Valley, Gardnerville Ranchos, Johnson Lane, and Ruhenstroth community areas with nitrate concentrations between 5 and 10 mg/L. There are also individual wells in Foothill and North Agricultural areas with nitrate concentrations greater than 10 mg/L. Spatially, arsenic concentrations are greater on the eastern side of Carson Valley and farther from the forks and mainstem of the Carson River (fig. 6B). In many select wells in Johnson Lane, East Valley, Ruhenstroth, Gardnerville Ranchos, South Agricultural, Minden, Central Agricultural, Airport, North Agricultural, and Indian Hills/Jacks Valley community areas, arsenic concentrations were greater than the EPA MCL criterion of 10 μg/L (U.S. Environmental Protection Agency, 2024).
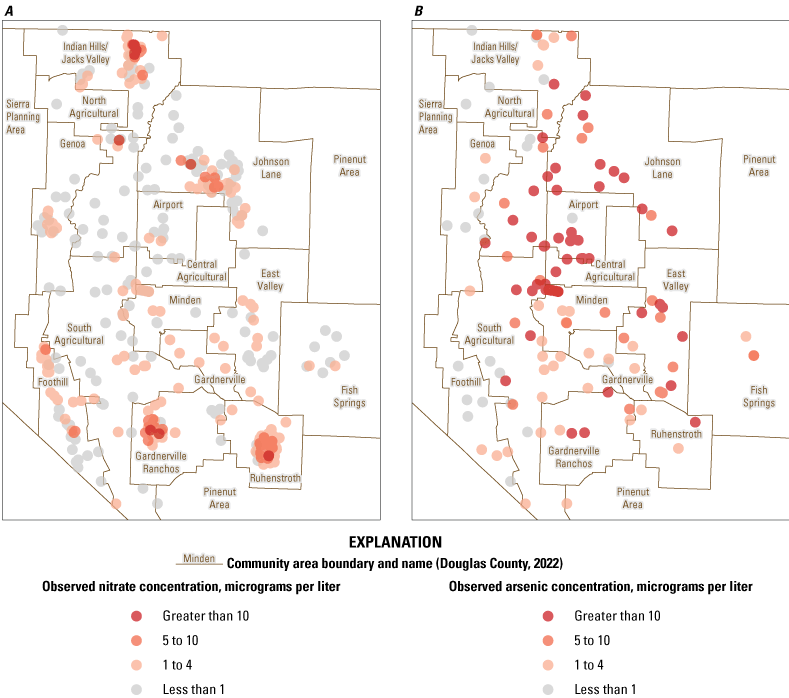
Spatial distribution and analytical results for A, nitrate (1983–2022) and B, arsenic in groundwater samples collected (1960–2019) from active and inactive monitoring wells within Carson Valley, Douglas County, Nevada (U.S. Geological Survey, 2022). Values reflect the most current concentration observed from the active and inactive monitoring well network.
Historical nitrate (1983–2022) and arsenic (1960–2019) concentrations measured from wells within each community area were plotted to show the range, distribution, and presence of MCL exceedances (fig. 7). For reference, the total number of measurements and wells in each community area are provided in table 2. Overall, the median nitrate concentrations observed from all wells within each community were less than 5 mg/L. However, wells within the North Agricultural, Indian Hills/Jacks Valley, Gardnerville Ranchos, Ruhenstroth, and Johnson Lane community areas have samples collected over the 37-year period with nitrate concentrations measured that exceed the EPA MCL of 10 mg/L (fig. 7A). These community areas are known to have had elevated nitrate concentrations in groundwater historically. From 2008 to 2009, 200 samples were collected from wells across Carson Valley that are influenced by different land-use categories. The highest nitrate concentrations existed in residential areas with high septic system density, and the lowest concentrations were in areas of vacant land and agricultural areas (Naranjo and others, 2013). The age of the septic system and depth to water were also important factors for increases in nitrate concentration in the aquifer.
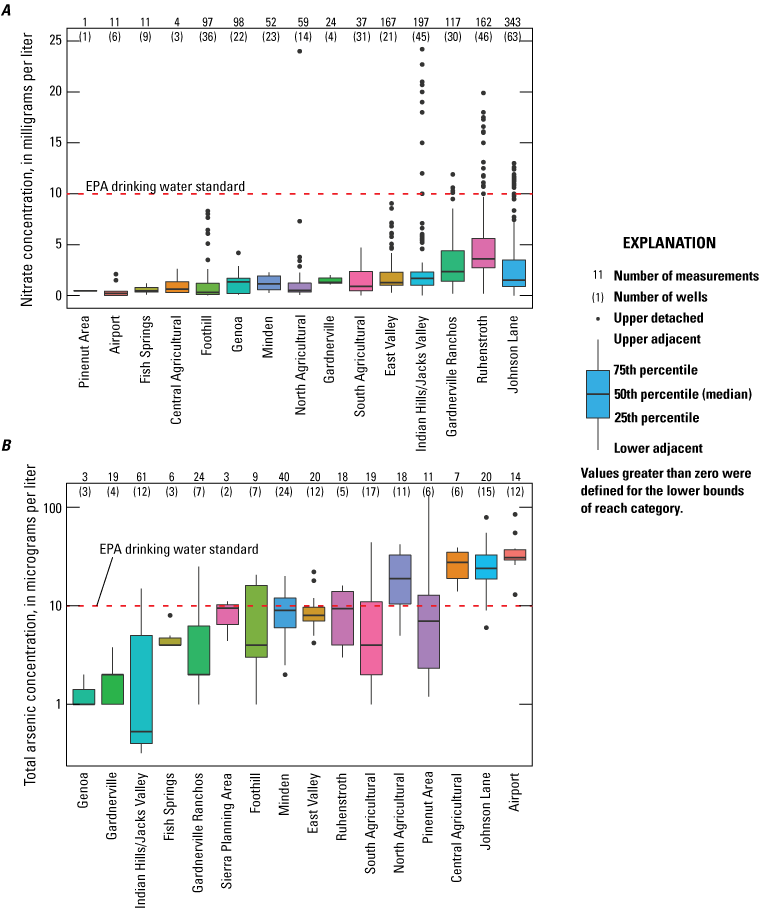
Boxplots of A, nitrate (1983–2022) and B, arsenic (1960–2019) concentrations observed from the active and inactive monitoring well network within the community areas of Carson Valley, Nevada (U.S. Geological Survey, 2022). For each community area, the range in concentrations for all measurements at each well are shown. Concentrations are sorted from low to high on the x-axis. The Environmental Protection Agency (EPA) drinking water standard for nitrate and arsenic is 10 milligrams per liter (mg/L) and 10 micrograms per liter (μg/L), respectively (U.S. Environmental Protection Agency, 2024).
In Central Agricultural, Johnson Lane, and Airport community areas, almost every well sampled had arsenic concentrations that exceed the MCL of 10 μg/L (fig. 7B). Median arsenic concentrations in all wells sampled in the North Agricultural, Central Agricultural, Johnson Lane, and Airport community areas are greater than the MCL of 10 μg/L. In many community areas, there are few groundwater samples analyzed for nitrate and arsenic. There is uncertainty on the spatial extent and temporal variability of nitrate and arsenic given that the monitoring network measures only a subset of areas and is with limited measurements collected over time. Further, the distributions for nitrate and arsenic (fig. 7) do not provide a complete representation of the aquifer within each community area; rather, they are measurements from a few wells sampled over the period of record. Elevated concentrations may be dependent on the screen interval depth in the well and proximity of the well to sources of the constituents.
Temporal Trends in Nitrate Concentrations
Discrete measurements of nitrate concentrations in the 11 monitoring wells in the active monitoring well network for each community area are shown on figure 8 (see table 1 wells 26–36). In Johnson Lane (monitoring well 34; fig. 8A) and Garnerville Ranchos (monitoring well 27; fig. 8F), nitrate has exceeded the EPA MCL of 10 mg/L (U.S. Environmental Protection Agency, 2024). Nitrate concentration is increasing steadily at monitoring well 33 (Johnson Lane) with the last measurement of 7.3 mg/L occurring in 2022 (fig. 8B). Nitrate concentrations observed in monitoring wells 29 (East Valley), 30 (Genoa), 31 and 32 (Johnson Lane), 35 and 36 (Indian Hills/Jacks Valley) are less than 2 mg/L and have not substantially varied over the period of record. Concentrations at monitoring well 31 (Johnson Lane) have been below detection since 2005 when the domestic well was deepened from a well depth of 175 to 350 ft (see table 3 in Naranjo and others, 2013). Before being deepened, nitrate concentrations steadily increased from 0.6 to 1.2 mg/L between 1993 and 2004 (USGS well 390055119421901; U.S. Geological Survey, 2022). Nitrate concentrations at monitoring well 26 (Ruhenstroth) increased over the period of record but have remained relatively constant at 5.6 mg/L since 2010. Nitrate concentrations at monitoring well 28 (East Valley) increased from 2001 to 2007 with a maximum of 9.1 mg/L then increased again from 2019 to 2021 to a second peak of 5.1 mg/L (fig. 8E).
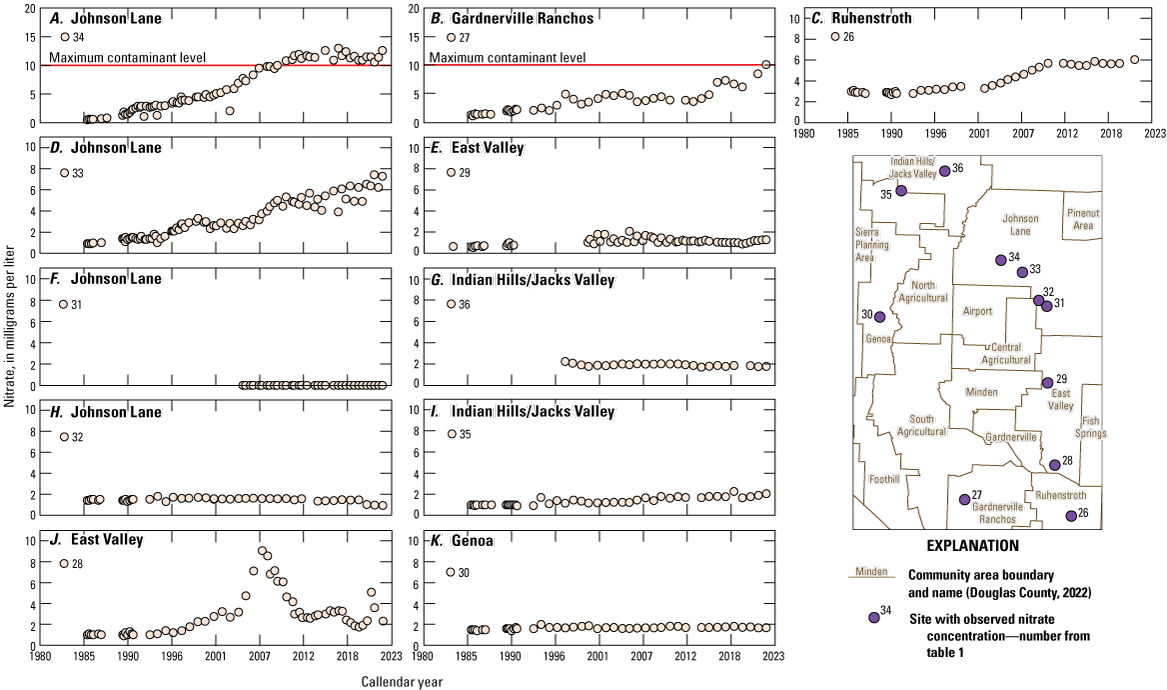
Discrete nitrate concentrations (U.S. Geological Survey, 2022) measured in the active monitoring well network within the community areas of A, Johnson Lane; B, Gardnerville Ranchos; C, Ruhenstroth; D, Johnson Lane; E, East Valley; F, Johnson Lane; G, Indian Hills/Jacks Valley; H, Johnson Lane; I, Indian Hills/Jack Valley; J, East Valley; and K, Genoa. Locations of wells are shown in the inset map.
Statistical Analysis of Water Levels and Nitrate Concentrations
Mann-Kendall trend analysis of depth to water level and nitrate concentrations in active and selected inactive monitoring wells show statistically significant increasing trends in most of the wells (table 4). In this analysis, the increasing depth to water trend indicates declining water levels, and the decreasing depth to water trend indicates a rising water table. The depth to water level from 17 of 26 monitoring wells (65 percent) analyzed is declining (increasing trend in depth to water; p<0.05). Analysis from 3 monitoring wells (12 percent) indicated depth to water was decreasing (p<0.05), and 6 wells indicated stable water levels with no apparent trend. The trend analysis for nitrate concentrations indicates 9 out of 14 monitoring wells (64 percent) are increasing (p<0.05). Only one monitoring well (well 36) indicated a decreasing trend, and three monitoring wells (wells 32, 39, and 41) indicated no trend in conditions. Analysis was not done on one well (well 31) because concentrations were below the level of detection (less than 0.01 mg/L).
Table 4.
Results of Mann-Kendall trend analysis for measured depth to water level and nitrate concentrations in active and selected inactive monitoring wells within the alluvial aquifer of community areas in Carson Valley.[For map identifier (ID) 31. Monitoring wells are shown on figure 1. Abbreviations: mm/dd/yy, month/day/year; N, number of samples in analysis; na, measurements below measurement detection limit; USGS, U.S. Geological Survey; <, less than]
Assessment of Monitoring Well Network
Within the monitoring well network, water-level measurements are made in 9 of the 16 community areas (excluding well 1 in Alpine County) that collectively represent about 24 percent of the Carson Valley area (table 2). There are no water-level measurements being made in Gardnerville, Genoa, Indian Hills/Jack Valley, North Agricultural, or Pinenut communities, which collectively comprise about 76 percent of the Carson Valley area.
In some areas of Carson Valley, nitrate in the groundwater continues to pose risks to domestic wells. Evidence indicates that nitrate contamination has increased rather than decreased in the well network at more locations over time. The extent to which water table variations affect aquifer nitrate concentrations is unknown. In controlled laboratory experiments, fluctuating water-level conditions may promote nitrification, contributing to highly variable nitrate concentrations in the aquifer (Zuo and others, 2023). Groundwater pumping for municipal, agricultural, and domestic uses may also contribute to nitrate removal from the aquifer (Naranjo and others, 2013). Thus, changes in land use or groundwater pumping rates play a role in mobilizing nitrate and arsenic. The existing monitoring well network may not be optimal in assessing the fate and transport of nitrate or arsenic to municipal or domestic wells. Periodic assessment of the monitoring well network can help to determine whether the existing well locations and frequency of sampling are sufficient to establish trends in water quality, especially in areas where there is high existing or planned municipal and domestic use. The monitoring network well density for community areas shown in table 2 can provide insight to areas where data gaps exist. Future expansion of data collection may be needed for tracking changes in water levels, nitrate, and arsenic concentrations with development in these community areas.
Nitrate transport simulations by Naranjo and others (2013) indicate that concentrations would continue to increase in areas of higher density of septic system use and in areas with older septic systems and longer septic-loading periods. The results of the trend analysis herein, a decade later, have shown that observed concentrations are continuing to increase in the alluvial aquifer. The existing network of wells could be improved to measure the change in nitrate concentrations in the community areas with high septic system density, as identified in Naranjo and others (2013), particularly in Indian Hills/Jacks Valley, Gardnerville Ranchos, Ruhenstroth, and Johnson Lane.
Stable trends in nitrate concentrations provide assurance that increased loading and transport from high septic system density areas (Naranjo and others, 2013) are not degrading water quality. For example, well locations 29–32, 35, and 36 (fig. 8) in the East Valley, Johnson Lane, Indian Hills/Jacks Valley, and Genoa have consistently had nitrate concentrations below 3 mg/L. Well location 31 has been consistently below the detection limit since 2002. At these wells, it might be acceptable to reduce the frequency of samples to every 5 years to ensure consistency in the overall trends. New monitoring wells along groundwater flow paths downgradient of high septic density areas, as identified in Naranjo and others (2013), can assist in determining transport away from source areas to other parts of the alluvial aquifer.
Historical data are too scant to allow for a clear understanding of the transport behavior of arsenic in the alluvial aquifer. Spatially, sufficient data exist to demonstrate that western Carson Valley generally has lower arsenic in groundwater than the eastern side. An improved understanding of the spatial distribution could be obtained if arsenic samples were included in the existing nitrate monitoring well network. However, the transport of arsenic to municipal wells would necessitate additional targeted monitoring. For example, an improved understanding of arsenic transport may warrant samples collected from monitoring wells from different redox zones (depths) within the aquifer.
Carson River Basin Hydro Mapper
The CBH tool was developed to provide easy, online access to groundwater, streamflow, and other spatially distributed hydrological data for the Carson River Basin (fig. 9; U.S. Geological Survey, 2023b). The tool provides access to near real-time information on climate, streamflow, and reservoir level as well as nitrate and arsenic data. Discrete water-level data measured and reported by the USGS, and the NDWR provide users with contextual hydrologic information from a dense monitoring network. The USGS-collected nitrate and arsenic concentrations are also shown through the CBH for groundwater and surface water sites in the Carson River Basin (fig. 10). Data from a single well can be compared to all wells within the Carson River Basin as a timeseries, allowing for efficient evaluation of conditions over time.
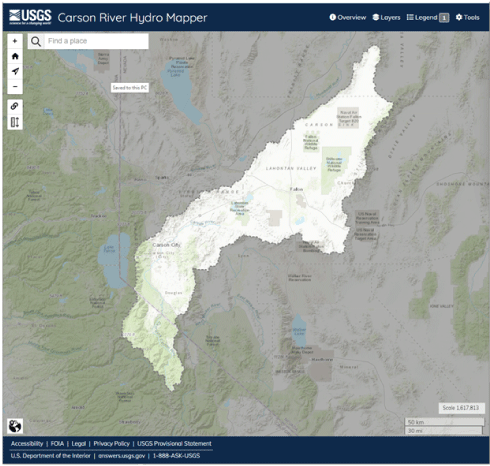
Visualization tool for the Carson River Basin (U.S. Geological Survey, 2023b) showing the boundaries of the hydrographic area.
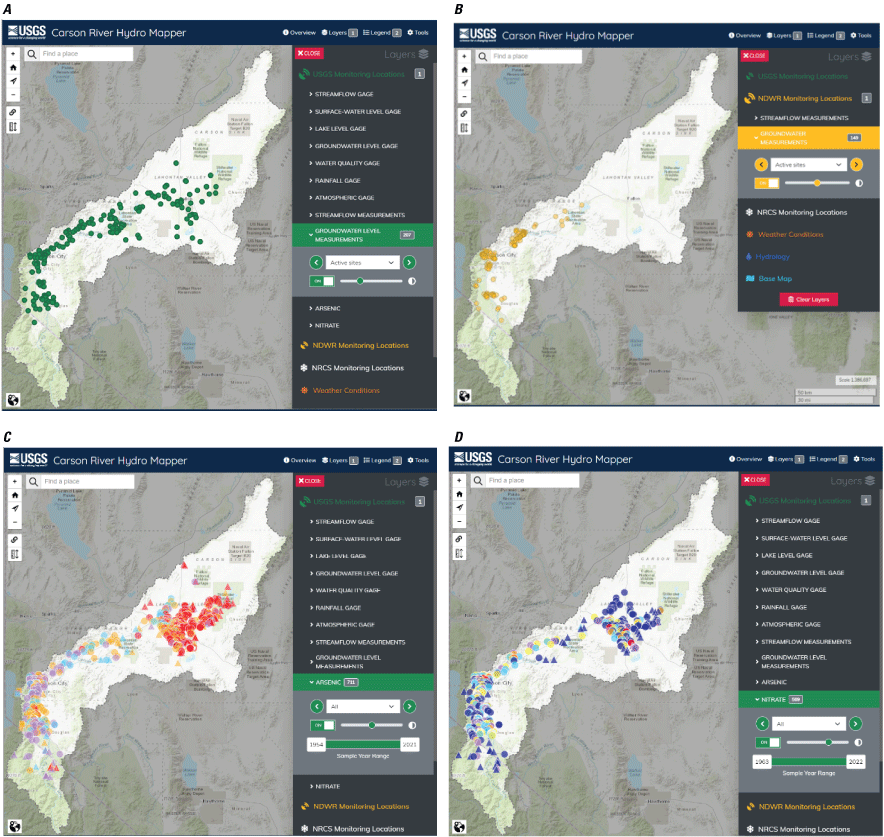
Carson River Basin Hydro Mapper display (U.S. Geological Survey, 2023b) of monitoring wells locations where water-level data are collected by A, the U.S. Geological Survey (USGS); B, the State of Nevada Division of Water Resources (NDWR); and analysis of C, arsenic and D, nitrate from USGS measured wells throughout the Carson River Basin. Data are accessed from the USGS National Water Information System (U.S. Geological Survey, 2022) and NDWR (State of Nevada Division of Water Resources, 2022).
Summary
The U.S. Geological Survey (USGS), in cooperation with Douglas County, Nevada, describes the spatial and temporal trends in water levels and groundwater nitrate concentrations in Carson Valley, Douglas County, Nevada. In addition, an assessment of the groundwater monitoring network and an online tool for tracking changes in water quality and quantity within the Carson River Basin are provided. The USGS maintains a network of monitoring wells within 10 community areas of Carson Valley with 25 wells monitored for groundwater levels from 1980 to 2022, and 11 wells used to monitor water-quality for nitrate from 1983 to 2022. Arsenic has been analyzed in discrete samples collected periodically (1960–2019), but arsenic analyses are not included in the routine monitoring well network.
Water levels, nitrate, and arsenic concentrations measured from active and inactive monitoring wells were evaluated for each community area by graphical and statistical analysis. It is important to note that many of these community areas do not have sufficient data to adequately characterize the water-quality or water-level conditions. For example, the Pinenut, North Agricultural, Indian Hills/Jacks Valley, Genoa, and Gardnerville community areas have no monitoring wells in the network for water levels. Although a long-term dataset exists for arsenic, samples for arsenic analyses are not routinely collected from the same wells, precluding long-term trend analysis for this analyte. Nitrate monitoring within the Ruhenstroth, Johnson Lane, Gardnerville Ranchos, and Indian Hills/Jacks Valley community areas have clusters of wells with nitrate concentrations exceeding the U.S. Environmental Protection Agency (EPA) maximum contaminant level (MCL). Additional wells within community areas could be used to define the extent and potential transport away from areas of high septic density and other possible contributing sources. For example, nitrate monitoring in the vicinity of the unlined reservoir in the East Valley area (near well 20) could be used to determine the effects of the reclaimed water on the aquifer. Arsenic concentrations remain a concern for domestic well users in community areas, but little data were available to evaluate temporal trends. However, historical data collected between 1960 and 2019 indicate community areas on the east side of the Carson River have a great number of wells that exceed the arsenic EPA MCL.
Results of the trend analysis of active and selected inactive wells indicate water levels are declining (p<0.05) in 17 of 26 monitoring wells (65 percent). Areas with the largest change in water levels are within the community areas of Airport, Johnson Lane, Ruhenstroth, South Agricultural, East Valley, and Fish Springs. Variations in water levels measured from Central Agricultural, Minden, Foothill, Alpine County, and Gardnerville Ranchos also show periods of increasing and decreasing trends over time, but the long-term trend is declining (p<0.05). The trend analysis for nitrate concentrations indicates that 9 out of 14 monitoring wells (64 percent) are statistically increasing (p<0.05). Data from one monitoring well indicated a decreasing trend, and three monitoring wells indicated no trend in conditions. Analysis was not done on one well given that all concentrations were below the level of detection (less than 0.01 milligrams per liter [mg/L]). Previous investigations on nitrate have indicated that community areas of high septic system density contribute nitrogen to the aquifer (Rosen, 2003; Naranjo and others, 2013).
The development of the Carson River Basin Hydro Mapper (CBH) visualization tool for the Carson River Basin provides a useful tool to evaluate trends in water levels measured by the USGS and State of Nevada Department of Water Resources (NDWR). As new data are collected and approved by the USGS and NDWR, data will automatically be presented within the tool. The CBH provides access to the active and historical nitrate and arsenic data collected by the USGS. Plotting tools provide quick access to visualize data with embedded links to the raw data stored in the National Water Information System and NDWR databases. Along with streamflow, other hydrologic data, such as surface water levels (for example, Lahonton Reservoir), precipitation, snow depth, and snow water equivalent data, are shown in real time. The CBH provides water availability and water-quality information that can be easily examined by water managers, the scientific community, and the public to better understand water resources throughout the basin.
References Cited
Alvarez, N., and Seiler, S., 2004, Sources of phosphorus to the Carson River upstream from Lahontan Reservoir, Nevada and California, water years 2001–02: U.S. Geological Survey Scientific Investigations Report 2004–5186, 96 p., accessed November 10, 2023, at https://doi.org/10.3133/sir20045186.
Alvarez, N.L., Pahl, R.A., and Rosen, M.R., 2018, Groundwater contributions to excessive algal growth in the East Fork Carson River, Carson Valley, west-central Nevada, 2010 and 2012: U.S. Geological Survey Scientific Investigations Report 2018–5102, 94 p., accessed November 10, 2023, at https://doi.org/10.3133/sir20185102.
Anning, D.W., Paul, A.P., McKinney, T.S., Huntington, J.M., Bexfield, L.M., and Thiros, S.A., 2012, Predicted nitrate and arsenic concentrations in basin-fill aquifers of the southwestern United States: U.S. Geological Survey Scientific Investigations Report 2012–5065, 115 p., accessed November 10, 2023, at https://doi.org/10.3133/sir20125065.
Arienzo, M.M., Saftner, D., Bacon, S.N., Robtoy, E., Neveux, I., Schlauch, K., Carbone, M., and Grzymski, J., 2022, Naturally occurring metals in unregulated domestic wells in Nevada, USA: Science of the Total Environment, v. 851, part 2, 12 p., accessed November 10, 2023, at https://doi.org/10.1016/j.scitotenv.2022.158277.
Bukowski, J., Somers, G., and Bryanton, J., 2001, Agricultural contamination of groundwater as a possible risk factor for growth restriction or prematurity: Journal of Occupational and Environmental Medicine, v. 43, no. 4, p. 377–383, accessed November 10, 2023, at https://doi.org/10.1097/00043764-200104000-00016.
Busbee, M.W., Kocar, B.D., and Benner, S.G., 2009, Irrigation produces elevated arsenic in the underlying groundwater of a semi-arid basin in southwestern Idaho: Applied Geochemistry, v. 24, no. 5, p. 843–859, accessed November 10, 2023, at https://doi.org/10.1016/j.apgeochem.2009.01.011.
Canter, L.W., and Knox, R.C., 1985, Septic system effects on groundwater quality (1st ed.): New York City, N.Y., Lewis Publishers, 360 p., accessed November 10, 2023, at https://doi.org/10.1201/9780203739877.
Chiu, H.F., Tsai, S.S., and Yang, C.Y., 2007, Nitrate in drinking water and risk of death from bladder cancer—An ecological case control study in Taiwan: Journal of Toxicology and Environmental Health, part A, v. 70, no. 12, p. 1000–1004, accessed November 10, 2023, at https://doi.org/10.1080/15287390601171801.
Covay, K.J., Banks, J.M., Bevans, H.E., and Watkins, S.A., 1996, Environmental and hydrologic settings of the Las Vegas Valley area and the Carson and Truckee River basins, Nevada and California: U.S. Geological Survey Water Resources Investigations Report 96–4087, 72 p., accessed January 20, 2021, at https://doi.org/10.3133/wri964087.
Cunningham, W.L., and Schalk, C.W., comps., 2011, Groundwater technical procedures of the U.S. Geological Survey: U.S. Geological Survey Techniques and Methods, book 1, chap. A1, 151 p. [Available at https://doi.org/10.3133/tm1A1.]
De Roos, A.J., Ward, M.H., Lynch, C.F., and Cantor, K.P., 2003, Nitrate in public water supplies and the risk of colon and rectum cancers: Epidemiology, v. 14, no. 6, p. 640–649, accessed July 10, 2023, at https://www.jstor.org/stable/3703422.
Douglas County, 2021, Community areas: ArcGIS online, accessed October 1, 2021, at https://douglasnvgis.maps.arcgis.com/home/index.html.
Focazio, M.J., Reilly, T.E., Rupert, M.G., and Helsel, D.R., 2002, Assessing ground-water vulnerability to contamination—Providing scientifically defensible information or decision makers: U.S. Geological Survey Circular 1224, 33 p., accessed December 20, 2022, at https://doi.org/10.3133/cir1224.
Garcia, K.T., 1989, Ground-water quality in Douglas County, western Nevada: U.S. Geological Survey Water-Resources Investigation Report 87–4269, 107 p., accessed July 10, 2023, at https://doi.org/10.3133/wri874269.
Helsel, D.R., Hirsch, R.M., Ryberg, K.R., Archfield, S.A., and Gilroy, E.J., 2020, Statistical methods in water resources: U.S. Geological Survey Techniques and Methods, book 4, chap. A3, 458 p., accessed July 10, 2023, at https://doi.org/10.3133/tm4A3. [Supersedes USGS Techniques of Water-Resources Investigations, book 4, chap. A3, version 1.1.]
Hopenhayn, C., 2006, Arsenic in drinking water—Impact on human health: Elements, v. 2, no. 2, p. 103–107, accessed July 10, 2023, at https://doi.org/10.2113/gselements.2.2.103.
Kendall, C., Young, M.B., and Silva, S.R., 2010, Applications of stable isotopes for regional to national-scale water quality and environmental monitoring programs, chap. 5 of West, J.B., Bowen, G.J., Dawson, T., and Tu, K.P., eds., Isoscapes—Understanding movement, pattern, and process on earth through isotope mapping: Springer, p. 89–112, accessed July 10, 2023, at https://link.springer.com/chapter/10.1007/978-90-481-3354-3_5.
Kitlasten, W., Morway, E.D., Niswonger, R.G., Gardner, M., White, J.T., Triana, E., and Selkowitz, D., 2021, Integrated hydrology and operations modeling to evaluate climate change impacts in an agricultural valley irrigated with snowmelt runoff: Water Resources Research, v. 57, no. 6, 30 p., accessed July 10, 2023, at https://doi.org/10.1029/2020WR027924.
Lico, M.S., 1997, Quality of ground water beneath urban and agricultural lands in Las Vegas Valley and the Carson and Truckee River Basins, Nevada—Implications for water supply: U.S. Geological Survey Water-Resources Investigations Report 97–4259, 24 p., accessed July 10, 2023, at https://doi.org/10.3133/wri974259.
Maurer, D.K., 1986, Geohydrology and simulated response to ground-water pumpage in Carson Valley, a river-dominated basin in Douglas County, Nevada, and Alpine County, California: U.S. Geological Survey Water Resources Investigations Report 86–4328, 109 p., accessed December 20, 2022, at https://doi.org/10.3133/wri864328.
Maurer, D.K., and Berger, D.L., 2007, Water budgets and potential effects of land and water-use changes for Carson Valley, Douglas County, Nevada, and Alpine County, California: U.S. Geological Survey Scientific Investigations Report 2006–5305, 64 p., accessed December 19, 2022, at https://doi.org/10.3133/sir20065305.
Maurer, D.K., Paul, A.P., Berger, D.L., and Mayers, C.J., 2009, Analysis of streamflow trends, ground-water and surface-water interactions, and water quality in the upper Carson River Basin, Nevada and California: U.S. Geological Survey Scientific Investigations Report 2008–5238, 192 p., accessed December 19, 2022, at https://doi.org/10.3133/sir20085238.
McMahon, P.B., and Chapelle, F.H., 2008, Redox processes and water quality of selected principal aquifer systems: Groundwater, v. 46, no. 2, p. 171–343, accessed December 20, 2022, at https://doi.org/10.1111/j.1745-6584.2007.00385.x.
Naranjo, R.C., Welborn, T.L., and Rosen, M.R., 2013, The distribution and modeling of nitrate transport in the Carson Valley alluvial aquifer, Douglas County, Nevada: U.S. Geological Survey Scientific Investigations Report 2013–5136, 51 p., accessed July 10, 2023, at https://doi.org/10.3133/sir20135136.
Nolan, B.T., Hitt, K., and Ruddy, B., 2002, Probability of nitrate contamination of recently recharged groundwaters in the conterminous United States: Environmental Science and Technology, v. 36, no. 10, p. 2109−2280, accessed July 10, 2023, at https://doi.org/10.1021/es0113854.
Paul, A.P., Seiler, R.L., Rowe, T.G., and Rosen, M.R., 2007, Effects of agriculture and urbanization on quality of shallow ground water in the arid to semiarid western United States, 1993–2004: U.S. Geological Survey Scientific Investigations Report 2007–5179, 56 p., accessed December 20, 2022, at https://doi.org/10.3133/sir20075179.
Paul, A.P., Welborn, T.L., and Naranjo, R.C., 2017, Groundwater sites evaluated to assess the vulnerability of public supply wells to increasing arsenic concentrations in southeastern Carson Valley, Douglas County, Nevada: U.S. Geological Survey data release, accessed January 12, 2024, at https://doi.org/10.5066/F75B00Z5.
R Core Team, 2021, R—A language and environment for statistical computing: Vienna, Austria, R Foundation for Statistical Computing, Version 2022.12.0+353, accessed January, 1, 2021, at https://www.R-project.org/.
Rosen, M.R., 2003, Trends in nitrate and dissolved-solids concentrations in ground water, Carson Valley, Douglas County, Nevada, 1985–2001: U.S. Geological Survey Water-Resources Investigations Report 03–4152, 6 p., accessed July 10, 2023, at https://doi.org/10.3133/wri034152.
Saftner, D.M., Bacon, S.N., Arienzo, M.M., Robtoy, E., Schlauch, K., Neveux, I., Grzymski, J.J., and Carbone, M., 2023, Predictions of arsenic in domestic well water sourced from alluvial aquifers of the Western Great Basin, USA: Environmental Science and Technology, v. 57, no. 8, p. 3124–3133. [Available at https://doi.org/10.1021/acs.est.2c07948.]
Saint-Jacques, N., Parker, L., Brown, P., Dummer, T.J.B., 2014, Arsenic in drinking water and urinary tract cancers—A systematic review of 30 years of epidemiological evidence: Environmental Health, v. 13, article 44, 32 p., accessed July 10, 2023, at https://doi.org/10.1186/1476-069X-13-44.
Shipley, D.O., and Rosen, M.R., 2005, Commentary—Identification of nitrate and dissolved-solids sources in ground water by GIS analysis: Environmental Practice, v. 7, no. 1, p. 32–43, accessed July 10, 2023, at https://doi.org/10.1017/S1466046605050039.
State of Nevada Division of Water Resources, 2022, Water use and availability—Water level data: State of Nevada Division of Water Resources, accessed December 10, 2022, at http://water.nv.gov/WaterLevelData.aspx.
Thiros, S.A., Paul, A.P., Bexfield, L.M., and Anning, D.W., 2015, The quality of our Nation’s waters—Water quality in basin-fill aquifers of the southwestern United States—Arizona, California, Colorado, Nevada, New Mexico, and Utah, 1993–2009: U.S. Geological Survey Circular 1358, 113 p., accessed December 20, 2022, at https://doi.org/10.3133/cir1358.
Thodal, C.E., 1996, Trends in chloride, dissolved-solids, and nitrate concentrations in ground water, Carson Valley and Topaz Lake Areas, Douglas County, Nevada, 1959–88: U.S. Geological Survey Water-Resources Investigations Report 95–4254, 32 p., accessed December 2, 2022, at https://doi.org/10.3133/wri954254.
Thomas, J.M., Thodal, C.E., and Seiler, R.L., 1999, Identification of nitrate sources contributing to ground water in the Indian Hills Area of Douglas County, Nevada: U.S. Geological Survey Water Resources Investigations Report 99–4042, 22 p., accessed July 10, 2023, at https://doi.org/10.3133/wri994042.
U.S. Environmental Protection Agency, 2024, Ground water and drinking water—National primary drinking water regulations—Inorganic chemicals, accessed June 21, 2024, at https://www.epa.gov/ground-water-and-drinking-water/table-regulated-drinking-water-contaminants.
U.S. Geological Survey, 2018, General introduction for the “National Field Manual for the Collection of Water Quality Data” (ver. 1.1, June 2018): U.S. Geological Survey Techniques and Methods, book 9, chap. A0, 4 p. [Available at https://doi.org/10.3133/tm9A0. Supersedes USGS Techniques and Methods, book 9, chap. A0, version 1.0.]
U.S. Geological Survey, 2022, USGS water data for the Nation: U.S. Geological Survey National Water Information System database, accessed December 20, 2022, at https://waterdata.usgs.gov/nwis/.
U.S. Geological Survey, 2023a, Guidelines for field-measured water-quality properties (version 1.1, July 17, 2023): U.S. Geological Survey Techniques and Methods, book 9, chap. A6.0, 22 p. [Available at https://doi.org/10.3133/tm9A6.0. Supersedes USGS Techniques of Water Resources Investigations, book 9, chap. A6.0, version 2.0.]
U.S. Geological Survey, 2023b, Carson Basin Hydro Mapper: U.S. Geological Survey web page, accessed December 30, 2023, at https://webapps.usgs.gov/carsonriverbasinhydromapper/.
Ward, M.H., Jones, R.R., Brender, J.D., De Kok, T.M., Weyer, P.J., Nolan, B.T., Villanueva, C.M., and Van Breda, S.G., 2018, Drinking water nitrate and human health—An updated review: International Journal of Environmental Research and Public Health, v. 15, no. 7, 1557 p., accessed July 10, 2023, at https://doi.org/10.3390/ijerph15071557.
Ward, M.H., Kilfoy, B.A., Weyer, P.J., Anderson, K.E., Folsom, A.R., and Cerhan, J.R., 2010, Nitrate intake and the risk of thyroid cancer and thyroid disease: Epidemiology, v. 21, no. 3, p. 389–395, accessed July 10, 2023, at https://doi.org/10.1097/EDE.0b013e3181d6201d.
Ward, M.H., Mark, S.D., Cantor, K.P., Weisenburger, D.D., Correa-Villasenor, A., and Zahm, S.H., 1996, Drinking water nitrate and the risk of non-Hodgkin’s lymphoma: Epidemiology, v. 7, no. 5, p. 465–471, accessed October 1, 2021, at https://pubmed.ncbi.nlm.nih.gov/8862975/.
Welch, A.H., 1994, Ground-water quality and geochemistry in Carson and Eagle Valley, Western Nevada and Eastern California: U.S. Geological Survey Open-File Report 93–33, 99 p., accessed December 20, 2022, at https://doi.org/10.3133/ofr9333.
Welch, A.H., and Lico, M.S., 1998, Factors controlling As and U in shallow ground water, southern Carson Desert, Nevada: Applied Geochemistry, v. 13, no. 4, p. 521–539, accessed October 1, 2021, at https://doi.org/10.1016/S0883-2927(97)00083-8.
Welch, A.H., Lico, M.S., and Hughes, J.L., 1988, Arsenic in ground water of the western United States: Ground Water, v. 26, no. 3, p. 333–347. [Available at https://doi.org/10.1111/j.1745-6584.1988.tb00397.x.]
Weyer, P.J., Cerhan, J.R., Kross, B.C., Hallberg, G.R., Kantamneni, J., Breuer, G., Jones, M.P., Zheng, W., and Lynch, C.F., 2001, Municipal drinking water nitrate level and cancer risk in older women—The Iowa women’s health study: Epidemiology, v. 12, no. 3, p. 327–338, accessed July 10, 2023, at https://www.jstor.org/stable/3703710.
Yager, R.M., Maurer, D.K., and Mayers, C.J., 2012, Assessing potential effects of changes in water use with a numerical groundwater-flow model of Carson Valley, Douglas County, Nevada, and Alpine County, California: U.S. Geological Survey Scientific Investigations Report 2012–5262, 73 p., accessed December 20, 2022, at https://doi.org/10.3133/sir20125262.
Zuo, R., Zheng, S., Liu, X., Wu, G., Wang, S., Wang, J., Liu, J., Huang, C., and Zhai, Y., 2023, Groundwater table fluctuation—A driving force affecting nitrogen transformation in nitrate-contaminated groundwater: Journal of Hydrology, v. 621, no. 129606., 12 p. [Available at https://doi.org/10.1016/j.jhydrol.2023.129606.]
Conversion Factors
U.S. customary units to International System of Units
Datum
Vertical coordinate information is referenced to North American Vertical Datum of 1988 (NAVD 88).
Horizontal coordinate information is referenced to the North American Datum of 1983 (NAD 83).
Altitude, as used in this report, refers to distance above the vertical datum. Altitude is referenced to the NAVD 88.
Supplemental Information
Concentrations of chemical constituents in water are given in either milligrams per liter (mg/L) or micrograms per liter (µg/L).
For more information concerning the research in this report, contact the
Nevada Water Science Center
U.S. Geological Survey
2730 N. Deer Run Road, Suite 3
Carson City, Nevada 89701
https://www.usgs.gov/centers/nv-water
Publishing support provided by the U.S. Geological Survey Science Publishing
Network, Sacramento Publishing Service Center
Disclaimers
Any use of trade, firm, or product names is for descriptive purposes only and does not imply endorsement by the U.S. Government.
Although this information product, for the most part, is in the public domain, it also may contain copyrighted materials as noted in the text. Permission to reproduce copyrighted items must be secured from the copyright owner.
Suggested Citation
Naranjo, R.C., and Bubiy, A., 2024, Assessment of water levels, nitrate, and arsenic in the Carson Valley Alluvial Aquifer and the development of a data visualization tool for the Carson River Basin, Nevada (ver. 1.1, September 2024): U.S. Geological Survey Open-File Report 2024–1045, 29 p., https://doi.org/10.3133/ofr20241045.
ISSN: 2331-1258 (online)
Study Area
| Publication type | Report |
|---|---|
| Publication Subtype | USGS Numbered Series |
| Title | Assessment of water levels, nitrate, and arsenic in the Carson Valley Alluvial Aquifer and the development of a data visualization tool for the Carson River Basin, Nevada |
| Series title | Open-File Report |
| Series number | 2024-1045 |
| DOI | 10.3133/ofr20241045 |
| Edition | Version 1.0: August 2024; Version 1.1: September 2024 |
| Publication Date | August 22, 2024 |
| Year Published | 2024 |
| Language | English |
| Publisher | U.S. Geological Survey |
| Publisher location | Reston, VA |
| Contributing office(s) | Nevada Water Science Center, Oklahoma-Texas Water Science Center |
| Description | vii, 29 p. |
| Country | United States |
| State | Nevada |
| Other Geospatial | Carson River Basin |
| Online Only (Y/N) | Y |