

Evaluation of Alternative Coatings for U.S. Geological Survey Water-Quality Samplers
Links
- Document: Report (3.46 MB pdf) , HTML , XML
- Data Release: USGS data release - Data to support the evaluation of alternative Coatings for USGS Water-Quality Samplers
- Download citation as: RIS | Dublin Core
Abstract
Each year, U.S. Geological Survey (USGS) personnel collect approximately 52,000 water-quality samples from rivers and streams across the United States. Several samplers are used by the USGS for water-quality sample collection in riverine environments. These samplers are coated with Plasti Dip to protect the exterior of the sampler; however, Plasti Dip is susceptible to fraying and wear, requiring maintenance. Alternative coatings were tested to determine if a different coating is better suited for the samplers. The alternative coatings included Raptor, powder coating, and DuraCoat; a fifth option was bare metal. Samplers with different coatings were evaluated based on initial coating application, equipment blank samples, a controlled wear test, blank sample collection with worn samplers, maintenance and re-coating of samplers, and field-use and wear tracking. The powder-coated sampler proved to be the top performer overall in the study.
Introduction
Each year, U.S. Geological Survey (USGS) personnel collect approximately 52,000 water-quality samples from rivers and streams across the United States (Karen Rice, U.S. Geological Survey, written commun., 2023). “The National Field Manual for the Collection of Water-Quality Data” (NFM; U.S. Geological Survey, variously dated) and “A Guide to the Proper Selection and Use of Federally Approved Sediment and Water-Quality Samplers” (Davis and the Federal Interagency Sedimentation Project, 2005) describe the use of a variety of water-quality samplers for the collection of discrete-water samples. Samplers used include the DH-95 (fig. 1A), D-96 (fig. 1B), and DH-2 (fig. 1C). The appropriate sampler for the site is chosen based on the velocity and depth of the stream. Samplers are susceptible to heavy wear due to the environmental conditions in which they are used. Occasional maintenance is required to ensure the samplers are kept in appropriate condition to protect sample integrity.
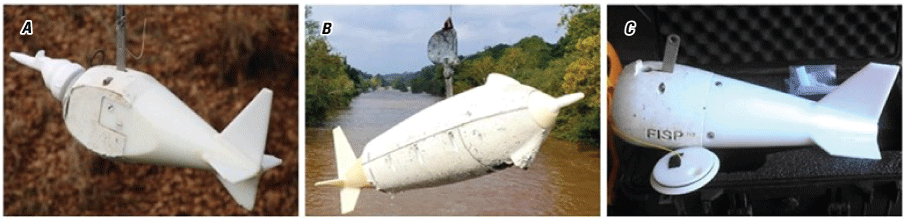
Photographs showing, A, DH-95, B, D-96, and, C, DH-2 water-quality samplers displaying moderate coating wear such as dents, abrasions, discoloration, and coating peeling. Photograph A taken by Ken Hyer, U.S. Geological Survey (USGS), on December 10, 2007. Photograph B taken by Jimmy Webber, USGS, on September 20, 2018. Photograph C taken by Jimmy Webber, USGS, on June 05, 2013.
Currently, the exterior and interior of the samplers are coated with Plasti Dip to maintain a smooth surface and prevent contamination of the water-quality sample from substances adhering to the handled exterior of the sampler (U.S. Geological Survey, 2004). Over time, however, the Plasti Dip is susceptible to tearing and fraying; thus, maintenance of the sampler requires sanding, priming, and applying a fresh coat of Plasti Dip. This maintenance can be time-consuming. The nature of Plasti Dip weathering, including the aforementioned physical properties of tearing and fraying in addition to the acceleration of damage over time with frequent sampler use, has brought into question whether other coating options are more durable.
Potential alternative coatings identified for the study were powder coating, Raptor truck-bed liner, DuraCoat, and bare metal. A study to test the performance of these alternative coatings and the currently used Plasti Dip coating was completed by personnel in the Virginia and West Virginia Water Science Center from November 2020 through June 2022 to determine the optimal coating, assessing factors for cost, durability, and potential contamination of samples for USGS water-quality samplers. This report describes the methods and results of the performance tests of the samplers with various coatings.
Methods
DH-95 samplers (fig. 1A) were used for the study as the Virginia and West Virginia Water Science Center had five samplers readily available for use. The following four coating options were selected for testing: Plasti Dip, powder coating, Raptor, and DuraCoat; a fifth option was bare metal. Factors considered when evaluating the optimal coating material were (1) total cost, preparation time, and ease of coating application and coating maintenance; (2) the potential for sample contamination due to product content; and (3) the durability of the coating over time in both controlled and field-use settings. Each sampler underwent the following steps to test these factors:
-
1. Initial coating application
-
2. Equipment blank sample collection
-
3. Controlled wear test
-
4. Blank sample collection with worn samplers
-
5. Re-coating of samplers
-
6. Field testing and wear tracking
Initial Coating Application
The first step in the study was to apply the coating to each sampler while evaluating the cost, time, and ease of the coating application process. To prepare the samplers for coating, all hanger bars and fins were removed, and each sampler was sand blasted by a professional vendor to obtain a smooth surface. Following this step, the bare sampler was set aside and ready for use. The samplers receiving Plasti Dip, Raptor, and DuraCoat coatings were each completed following the recommended instructions listed by their respective manufacturers. Samplers were coated in two stages, applying the exterior coating first, setting to dry for one to two days, and then applying the interior coating. The powder-coated sampler was delivered to Hanover Powder Coating to be treated with a white powder-coat finish.
Plasti Dip is a synthetic polymer coating applied with an aerosol spray application. It requires Plasti Dip primer, which was applied to the sampler one hour prior to the coating application. Each coat of Plasti Dip was sprayed onto the sampler and set to dry for four hours before applying the next coat. Three coats were applied per manufacturer recommendation, consuming approximately 1¼ cans of Plasti Dip. Any remaining coating material was saved for touch-ups or future applications.
The powder-coated sampler was prepared by an external vendor. The powder-coat material consists of fine particles of pigment and resin electrostatically dusted onto the sampler's surface. The vendor completed the coating process in three weeks, although wait times can vary by selected vendor. Touch-up of the powder-coated sampler was not possible, as the sampler must be fully sandblasted prior to every powder-coating application.
Raptor coating is a urethane-based product applied with an aerosol spray application. It also had a hardener additive, which added time in preparation of the can and required the can to be used within 24 hours. Two coats were applied following the manufacturer’s instructions of keeping a 2- to 3-foot (ft) spray distance. Although Raptor manufacturer’s dry time states 20 minutes between coatings, the observed dry time was two days. This extended the application process to four days and also required a second can, as the first can was no longer usable after 24 hours.
DuraCoat is an acrylic enamel product applied with an aerosol spray application. It required a hardener additive, which was added just prior to using the spray. The can was shaken for two minutes, the hardener was added, and the can was shaken for another two minutes. The coating was sprayed on with the recommended distance of 10 inches from the surface to avoid dripping. Three coats were applied, leaving five minutes of dry time between coats and a full 24 hours of dry time after the final coat. To complete the process, approximately 1¼ cans of DuraCoat were consumed to fully coat the sampler. The remaining spray was saved for touch-ups, but it must be used within four weeks because of the hardener additive.
Equipment Blank Sample Collection
A series of equipment blanks was collected and processed to quantify the potential for each coating type to contaminate the environmental sample. Equipment blanks were collected following standard USGS procedures (U.S. Geological Survey, variously dated). Equipment used for each blank included an 8-liter (L) polyethylene churn splitter, 20-L plastic wash basin, coated DH-95 sampler body, and 1-L polytetrafluoroethylene (PTFE) sampler bottle. The wash basins were newly purchased for this study; however, the churn splitters, samplers, and sampler bottles were used stock from the Virginia and West Virginia Water Science Center. Inorganic blank water (IBW) was used for all blanks and was obtained from National Field Service Supply. Samples were submitted to the National Water Quality Laboratory (NWQL) to be analyzed for nutrients and trace elements (sample containers and parameters listed in table 1.1). Five blank sample sets were submitted for each of the five sampler coatings. The following process was completed for each sampler:
-
1. Initial equipment blank with 8-L churn.—An initial equipment blank was processed from the churn using a PTFE sampler bottle. The churn and sampler bottle were triple rinsed with deionized water from the in-house laboratory source, Millipore Integral Deionized Water (DIW) system. The churn and sampler bottle were then native-water rinsed with the IBW following procedures in the NFM (U.S. Geological Survey, 2002b). The remaining volume of IBW was poured into the sampler bottle and then into the funnel assembly of the churn, filling the churn to just less than 4 L of water. Blank water was then processed into the sample containers (refer to appendix 1) following recommended guidance from NFM (U.S. Geological Survey, 2002a) and NWQL. Samples were labeled, bagged, and refrigerated immediately after processing.
-
2. Equipment blank with 20-L wash basin.—A basin was designated for each sampler to be used during both rounds of blank sample processing. The basin was triple rinsed with DIW from the Millipore Integral DIW system, then native-water rinsed and filled with five 4-L containers of IBW. The sampler bottle was native-water rinsed with water from the basin, then used to pour a native-water rinse into the churn, then used to fill the churn with 4 L of water. The blank samples were then processed from the churn following the steps previously listed for the initial blank.
While this sample set was being processed, one additional 4-L container of IBW was poured into the basin to provide enough volume for the remaining three blank sample sets. The selected DH-95 sampler (with the tail removed) was lowered into the wash basin and submerged in blank water.
-
3. Set of three consecutive equipment blanks from wash basin with sampler body.—The next three blank sample sets were processed from the wash basin with the DH-95 coated (one bare) sampler soaking (fig. 2). For the first blank sample, the sampler had been soaking for 10 minutes. The subsequent blank samples were processed after the sampler soaked for 20 minutes and then at 30 minutes. The 10-minute soaking interval was chosen to provide adequate soaking time for the samplers to yield sufficient leaching or contamination potential.
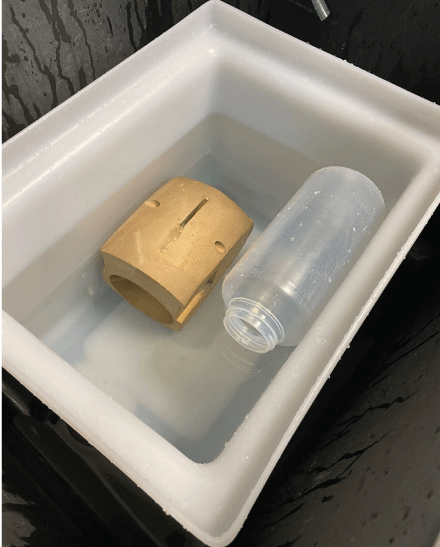
Photograph showing blank water-quality sample processing from a wash basin using a bare sampler. Photograph taken by Alyssa Thornton, U.S. Geological Survey, on December 2, 2020.
Controlled Wear Test
A controlled wear test exposed the samplers to abrasive action and impact damage, simulating wear-and-tear that samplers would typically endure with regular field use but in an accelerated time frame. This stage of the study was designed to test the durability of each sampler coating. Photographs of the samplers were taken before and after the wear test to document the condition of the coatings.
Before starting the wear test, the tail section was removed from the samplers. A rope was tied around the sampler, feeding it through the hole where the sampler bottle was loaded. Samplers were set on a concrete surface, and a 40-ft track was measured and marked. Each sampler was pulled at a consistent rate of approximately 2 feet per second (ft/s) along the 40-ft concrete track twice on each side, subjecting each to abrasion. Photographs were taken after each pass to document the progressive damage (fig. 3).
A controlled damage test also was performed on the bottom of the samplers by dropping them onto a bed of cobbles to simulate a sampler striking a streambed. Samplers were held at a height of 4 ft and dropped onto the cobble bed two times. Photographs of the damage were taken afterward.
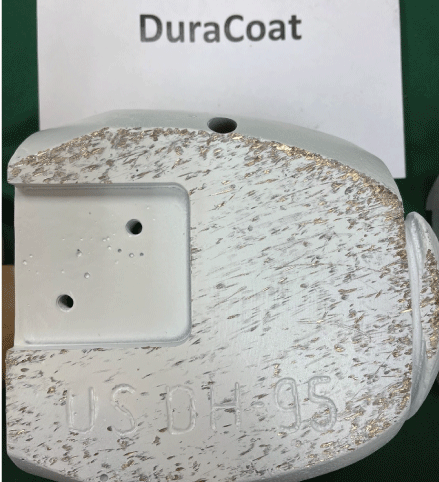
Photograph showing damage to the side of the DuraCoat sampler (fins removed) following the controlled wear test. Photograph taken by Alyssa Thornton, U.S. Geological Survey, on December 2, 2020.
Blank Sample Collection With Worn Samplers
The previously described equipment blank sample processing steps were repeated using the worn samplers. This stage of the study was designed to measure any release of chemical constituents from coating material following significant wear of the samplers.
Re-Coating of Samplers
After evaluating damage to each sampler during the controlled wear test and then processing the second round of blank samples with worn samplers, the five samplers were prepped and re-coated to their original condition. Sampler bodies were kept consistent throughout the study so that the selected coating was the same for both initial coating and re-coating phases. Each sampler was sand blasted to present a smooth exterior surface, then the bare sampler was set aside, the powder-coated sampler was delivered to Hanover Powder Coating for treatment, and the Plasti Dip, DuraCoat, and Raptor samplers were re-coated following the same procedures as the original coating process.
Field Testing and Wear Tracking
Once re-coated, the samplers were reinstated into regular field use. Samplers were utilized across Virginia from December 2020 through June 2022. The extended timeline was necessary for samplers to sustain sufficient wear for the field damage evaluation. Field use was tracked with a spreadsheet to ensure utilization varied by person and site. Field use information recorded on the spreadsheet included the selected coated (one bare) sampler used, personnel, site location, cross-sectional width, number of sampling stations, and total sampler dips. Eleven personnel varied their use of the samplers so that no sampler was favored by a particular person with a different use behavior. Samplers were used at 26 sites, and the samplers were used from bridges at all but one site, where the sampler was used from a cableway. Bridge characteristics varied by site, with cross-sectional widths ranging from 20- to 1,200-ft, and railing types varied by design and material (steel and concrete guardrails). Bridge characteristics are essential, as the act of moving the samplers between bridge sampling stations was a notable source of damage to the samplers. In-stream characteristics differed across the sampling sites. Streambed textures varied from silt and sand to bedrock, and flow conditions ranged from small streams with a discharge of 300 cubic feet per second (ft3/s) to major rivers with a discharge of 45,000 ft3/s. Each sampler was used between 35 and 45 times during the study.
Results
The sampler coatings were evaluated on their performance pertaining to the coating application process, laboratory blank results, and susceptibility to wear. An evaluation of all sampler coatings in each phase of the study follows.
Evaluation of Coating Application
The sampler-coating process was evaluated on the cost of application, ease of application, and quality of application due to variability in staff skill.
In terms of cost, including materials and staff time, the differences between sampler coatings were negligible. Each sampler cost less than $165 in materials and services to complete. Total staff time required was no more than four hours per sampler-coating application over the course of several days.
The ease of application and quality of application varied among the coatings. The easiest coating types were the bare and powder-coated samplers, which required minimal staff effort. The most skillfully applied coating was the powder-coated sampler because it was completed by a professional vendor. The most difficult coating to apply was Raptor due to the 2- to 3-ft recommended spray distance required to prevent drips or runs during the application. When applied properly, Raptor spray applied a good thick coating; but the quality of the application varied greatly if manufacturer instructions were not explicitly followed. DuraCoat was also difficult to apply with a 10-inch recommended spray distance. Maintaining the spray distance was a critical factor in the resulting quality of the application and meticulosity was required. Plasti Dip coating was the easiest to apply by the Virginia and West Virginia Water Science Center staff, and no issues were observed with the application in part due to waiting the maximum dry time between coats.
To provide a quantitative assessment, the sampler coatings were given a score of 1 through 5 (table 1) for each pertinent aspect of the coating process.
Evaluation of Blank Results
The blank sample set for each sampler included an equipment blank each of the churn and the basin, a 10-minute soaked sampler blank (sampler blank 1), 20-minute soaked sampler blank (sampler blank 2), and 30-minute soaked sampler blank (sampler blank 3). A set of these five samples was submitted for each of the five samplers after the initial coating application and again after the controlled wear test. Samples were shipped to NWQL for analysis of major ions, trace metals, nutrients, and total organic carbon (table 1.1). The NWQL schedules selected by the study’s development team were SCH2848 for major ions and trace elements, SCH1128 for nutrients, and SCH899 for organic carbon. The major ions and trace elements schedule was chosen to represent a standard metals analysis suite. Considering the sampler body composition is predominately copper and tin, both analytes should have ideally been included in the laboratory request; however, tin was not included in the selected NWQL schedules.
The blank sample processing procedures were designed to measure the maximum potential contamination due to the various coating’s chemical content. The procedures were not designed to mimic real-world sampling as that would require flowing water, and the samples were processed from containers of still blank water. Additionally, in real-world settings, the sample water would enter the bottle through the nozzle upstream of the sampler, therefore theoretically never contacting the sampler body prior to entering the sample bottle or bag. In this study, the blank samples were collected from water in contact with the coated sampler body for 10 to 30 minutes, likely providing the maximum contamination. The study design did not mimic environmental conditions, and this was considered when evaluating the results of the blank samples.
An additional flaw in the study was the absence of equipment acid rinsing immediately prior to sample collection and processing. Sampling equipment utilized in the study, including basins, churns, and sampler bottles, had been washed with Liquinox, rinsed three times with tap water then three times with DIW; however, none of the equipment had been acid rinsed immediately prior to collecting the samples. Elevated concentrations of copper, lead, and calcium, described in the section below, were detected in several churn and basin equipment blank samples and may be attributed to this oversight. Despite that, there were discernable patterns of increasing concentrations of these and other analytes in sampler blanks 1, 2, and 3 from all samplers that correlate with increasing length of time the coated (one bare) samplers were soaking. Therefore, when evaluating the final results, a greater importance was placed on the observed increasing concentration patterns in the soaking sampler blanks and notably high concentrations, as opposed to low-level detections.
The complete data set to support this study was provided in the data release “Data to Support the Evaluation of Alternative Coatings for USGS Water-Quality Samplers,” (Thornton, 2025). Of the full list of analytes, most had no detectable quantities in any blank sample throughout the study (table 2). Nitrite, molybdenum, and sulfate were detected in a few samples; however, all detections were low-level values above the detection limit but below the laboratory reporting level for that constituent, and, therefore, not listed in the results (table 3).
Table 2.
Blank water-quality sample parameters, detection limits, reporting limits, and number of detections.[Data are from U.S. Geological Survey, 2023. Specific conductance is in microsiemens per centimeter at 25 degrees Celsius (µS/cm at 25 °C). CaCO3, calcium carbonate; mg/L, milligrams per liter; µg/L, micrograms per liter; SiO2, silicon dioxide]
Analytes with reported values above detection limits were copper, lead, calcium, chloride, barium, lithium, and zinc (table 3). Most detections were low level and sporadic throughout the sample set, although there were a few exceptions with higher concentrations and some notable patterns. Samples termed “sampler blank 1,” “sampler blank 2,” and “sampler blank 3” for all coatings had the most results reported above detection limit. An increase in concentrations of analytes in some sample sets was observed between sampler blanks 1, 2, and 3, corresponding with the increasing amount of time each sampler was soaked (10, 20, and 30 minutes, respectively).
Table 3.
Blank water-quality sample results greater than the detection limit for copper, lead, calcium, chloride, barium, lithium, and zinc.[Dates given in Month–Day–Year format. Parameter codes shown in parentheses under the analyte name. µg/L, micrograms per liter; mg/L, milligrams per liter; n, below the reporting level but at or above the detection limit; <, less than; r, value verified by rerun, same method; d, sample was diluted]
Analytes with the most concerning results were copper, zinc, and lead. Copper was nearly ubiquitous, with detections in 46 of the 50 blank samples, however, over half of the reported values were below the laboratory reporting level and above the long-term method detection level (<0.4 milligrams per liter [mg/L]). The most elevated copper concentrations (3.5 micrograms per liter [µg/L] to 28.3 µg/L) were reported in the bare metal sampler blank samples, from both the initial round of blank samples and the second round of blank samples following the controlled wear test. The bare sampler blanks also had elevated concentrations of zinc (3.9 µg/L to 12.7 µg/L). These were the only samples throughout the study that reported any detectable quantities of zinc. Lead concentrations were detected in 32 of the 50 blank samples. Notable concentrations of lead were reported for several Raptor sampler blank samples (10.2 µg/L to 108 µg/L), with a pattern of increasing concentrations that correlates with the increasing length of time in which the sampler was soaked.
Remaining blank sample results presented no major concerns. Calcium concentrations were detected in 21 of the 50 blank samples, although most were low-level detections measuring below the laboratory reporting level and above the long-term method detection level. There was a pattern of increasing calcium as samplers soaked longer for nearly all coating types. Chloride, barium, and zinc had reported concentrations above the detection limit in various sampler blank samples, but no detections in the equipment blanks. Lithium was reported in elevated concentrations for three samples associated with the Raptor-coated sampler after the controlled wear test.
For commonly detected analytes copper, lead, and calcium, relative percent difference (table 4) was calculated for each sampler blank 1, 2, and 3 result to the churn and basin blank sample results to convey the magnitude of increasing concentrations across the sample set.
Table 4.
Relative percent difference of copper, lead, and calcium results.[μg/L, micrograms per liter; mg/L, milligrams per liter; RPD, relative percent difference]
Overall, every sampler coating was associated with a number of detections in their respective blank sample set. The bare metal and Raptor coating sample sets had the highest number of detections. The highest magnitude of detections was reported in the Raptor (lead), powder-coating (lead), and bare (copper, lead) sample sets. Based on the results, each sampler was given a score from 1 (worst—highest contamination potential) to 5 (best—lowest contamination potential) listed in table 5.
Table 5.
Blank water-quality sampler evaluation scores by coating type after initial coating and after controlled wear.Potential Sources of Contamination
The prevalence of contamination in the blank samples is notable. By categorizing the blank samples into equipment blanks (churn and basin) and sampler blanks (1, 2, and 3), it is evident that the vast majority of contamination was in the sampler blank samples, which suggests that the source of contamination is likely associated with the physical sampler. There were no consistent, discernable patterns between the sampler blank results after initial coating application in comparison to sampler blank results after the controlled wear test, indicating that coating wear does not correlate with an increase in contamination. In addition to potential contamination directly from the sampler coatings, there were other possible sources of contamination that may have contributed to some or all the elevated concentrations in the blank samples.
-
• USGS sampler body.—USGS samplers are made of bronze, which is predominately copper (typically 88 percent in industrial bronze) and tin (typically 12 percent) but can also contain aluminum, manganese, nickel, phosphorus, silica, arsenic, and zinc. Copper was detected in nearly all samples with the highest concentrations in the bare sampler set, corroborating that contamination may be from the sampler itself. Tin was not requested in the trace element suite from NWQL; therefore, we do not have that data. As for the other trace elements that are occasionally present in bronze, none were detected in the blank sample set except for zinc, which was only present in the bare sampler blank samples. This again supports that the sampler itself can be a source of contamination, in particular if not coated.
-
• Sandblasting process.—All samplers were sandblasted by Hanover Powder Coating. Although the exact chemical content of the material used in sandblasting at their facility could not be disclosed, the material mainly consists of finely cut glass and minerals (Hanover Powder Coating, undated). Residue from this material may have adsorbed to the sides of the samplers, contaminating the sampler blank samples. The pattern of greater contamination prevalence in sampler blanks versus the equipment blanks supports this as a potential source.
-
• Wash basins and churns.—As mentioned previously, an oversight in this study was the failure to conduct an acid wash with the basins and churns prior to using the equipment for the study. The acid-rinsing would have eliminated any prior trace elements present in the equipment, allowing any detections to be attributed to other sources, most notably the samplers.
-
• Environmental dust.—During the basin soaks of 5-minutes, 10-minutes, and 15-minutes, the basins were uncovered. This allowed the potential for workplace contamination due to dust.
Acknowledgement of these potential sources of contamination is important, despite the inability to characterize the source(s) with this dataset. Furthermore, the presence of contamination in this study does not directly imply a risk with properly collected, real-world samples. To reiterate, the study utilized methods to measure maximum-potential contamination whereas real-world samples are likely to have a minimum-potential contamination when collected and handled properly. In real-world settings, the water entering the sampler through the nozzle would not contact the sampler body itself. Additionally, real-world samples are recommended to be collected following standard USGS Clean Hands, Dirty Hands techniques (U.S. Geological Survey, 2006), which can help minimize the potential contamination through proper sample and equipment handling.
Evaluation of Controlled Wear and Field Wear
Sampler wear was examined after the controlled wear test and the field-testing period. Descriptions of how each sampler exhibited wear-and-tear were recorded and approximate quantifications of the amount of wear observed were estimated using a visual percentage estimator (fig. 4).
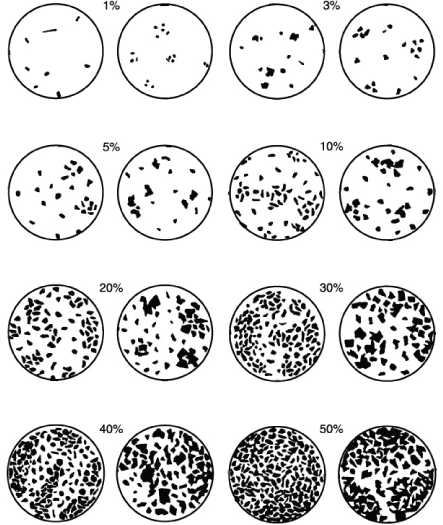
Image showing the visual percentage estimator used for damage evaluation (Shipboard Scientific Party, 2002, fig. 9).
Results of the controlled wear test showed that samplers are more susceptible to wear by abrasive damage as opposed to strike damage. Substantially more damage was observed on the sides of the samplers that endured the abrasive action of dragging than the bottom of the samplers that endured the drop test. Wear characteristics were similar across the samplers, all displaying scratches and some flaking (fig. 5).
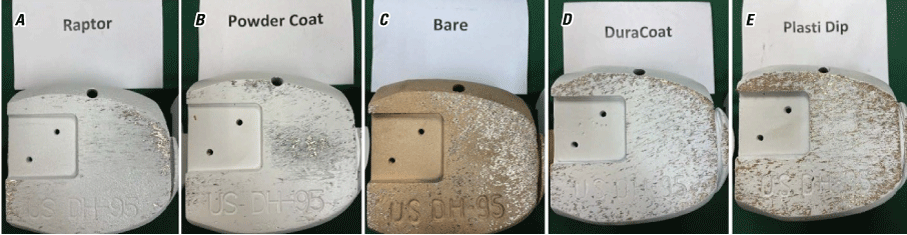
Photographs showing the damage to the sides of water-quality samplers after the controlled wear test. Photographs taken by Alyssa Thornton, U.S. Geological Survey, on December 2, 2020. A, Raptor. B, Powder coat. C, Bare. D, DuraCoat. E, Plasti Dip.
Results of the damage assessment from both the controlled wear test and field use are listed in table 6. From the controlled wear test, the Raptor coated sampler was most resistant to damage with only 10 percent damage observed. The powder-coated sampler also was more resistant to damage with 20 percent observed. DuraCoat and the bare sampler each displayed 40 percent damage, while Plasti Dip performed the worst, with 60 percent damage observed.
Table 6.
Damage assessment of water-quality sampler coatings after controlled wear test and field use.Sampler wear and damage also were examined following the field-use period from December 2020 through June 2022. The damage observed on the field-tested samplers was more difficult to assess, as there was a greater variety of damage characteristics beyond previously observed scratches and flaking, which included chipping, gouging, dents, peeling, and staining. The percentage of damage also was more challenging to evaluate for each sampler as it was not even on the surfaces. The damage typically was more concentrated around the edges of the sampler sides, the ring around the sampler base surface, and the front lip of the sampler surrounding where the sampler bottle is inserted. These more heavily damaged points on the samplers correlate with specific in-field wear actions, such as the sampler contacting or dragging against the bridge when moving between stations, the sampler being set on a bridge or road surface before and after sample collection, the sampler contacting a rocky stream bed during sample collection, and the sampler being struck with in-stream debris during collection (fig. 6).
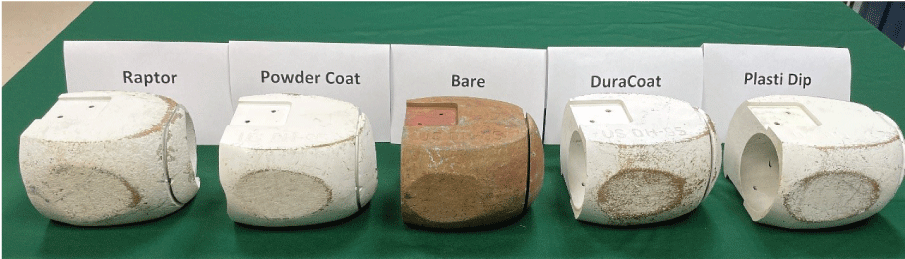
Photograph showing the damage to water-quality samplers after field use. Photograph taken by Alyssa Thornton, U.S. Geological Survey, on June 1, 2022.
From the field-use period, the DuraCoat sampler displayed the greatest amount of wear with 50 percent of the sampler surface displaying damage. Wear characteristics included flaking, scratches, and peeling on the exterior of the sampler, particularly on the sides and bottom of the sampler. Flaking pattern was of concern due to the potential to contaminate the sample with notable pieces of DuraCoat material.
The Plasti Dip sampler was 40 percent damaged. Notable peeling was observed around the interior edge and front lip of the sampler where the sample bottle is inserted, posing a concern for sample contamination due to Plasti Dip material flaking off and entering the sampler. On the exterior, scratches were observed on the sides and bottom of the sampler.
The Raptor sampler was 30 percent damaged and displayed the most variety in wear characteristics. The exterior of the sampler showed a speckled pattern from a combination of tiny pocks and black discoloration in spots, in addition to the more typical scratches. The front edge of the sampler had areas where the coating had chipped off. On the sides of the sampler, the coating was also missing in areas due to being worn and scratched off.
The powder-coated sampler was 20 percent damaged. There were some scratches and gouges on the exterior of the sampler, and areas where the coating had scratched off on edges of the sampler that make frequent contact with bridges and stream-bed surfaces. There were also chipping patterns noted at the front edge of the sampler.
The bare metal sampler was 20 percent damaged. Bare metal was the one sampler in the study without a coating that could exhibit peeling, flaking, chipping, or other forms of coating removal; therefore, assessment of the wear damage focused on impacts to the metal surface. There were notable scratches to the surface as well as staining, with patches of maroon and blue-green discoloration.
Each coating (one bare) sampler was given a durability score for both the controlled wear and field wear testing (table 7). Assessments involved observing the wear on all faces of the exterior of the sampler and the interior cavity, and then quantifying that wear using a visual percentage estimator.
Table 7.
Durability evaluation of water-quality samplers based on controlled-wear test and field use.[Evaluated on a scale of 1 to 5, with 1 being the least durable, and 5 being the most durable]
Evaluation of the coating damage from both the controlled wear test and field use test showed that the powder coating and Raptor samplers were most resistant to wear and damage, while the Plasti Dip sampler was most susceptible.
Summary
Sampler coatings were evaluated and scored on each element of the study (table 8). No single sampler coating excelled in all assessments, nor did a single sampler coating perform poorly in all assessments. However, some sampler coatings demonstrated concerning performance in one or more element that could arguably remove them from consideration. DuraCoat presented difficulties in the coating application process. Raptor also presented significant difficulties in the coating application process as well as having concerning blank results. The bare metal sampler delivered poor blank results.
Table 8.
Final evaluation of water-quality samplers by coating type based on application, contamination, and durability.[Evaluated on a scale of 1 to 5, with 1 being the worst score, and 5 being the best score]
Sampler coatings with the best scores from the coating application process were powder coating and bare sampler. Coatings with the best results from the blank sample set were Plasti Dip and DuraCoat. Coatings with the best durability were powder coating and Raptor.
The powder-coating sampler was the overall best performer in the study. The process to apply the powder coating was simple and cost-efficient as it was completed by professional vendor for a reasonable price. There were no significant concerns with the results of the blank samples. The powder-coated sampler demonstrated the best resiliency to wear and tear, which, because of reduced maintenance requirements, can be a time- and cost-saving benefit.
Acknowledgments
This study was funded by the USGS Water Mission Area with Virginia and West Virginia Water Science Center support. Special thanks to the former Federal Interagency Sedimentation Program Chief and lead developer of the above-mentioned samplers, Wayne O’Neal (now with Carnet Technology), for his assistance in identifying various coatings to test. Thank you to Stan Skrobialowski (retired) and the Water Mission Area team for their support and assistance in initiating the study. Thank you to Doug Moyer and John Jastram for their support and guidance throughout this process. I thank Brandon Cohick for his time commitment and for completing the initial phases of the study. Brandon Cohick, Chelsea Vande Pol, Taylor Camper, John Davis, Richie Dang, Patricia Morgan, Jonathan Wilson, Taylor Gillum, Dan Burns, Jimmy Webber, and Sam Miller helped with field data collection and documentation. Thank you to Doug Chambers (retired) for guidance during several phases of the study, from development through review. Thanks to Karen Rice (retired) and Joe Duris for their insight and assistance in reviewing and finalizing this work.
References Cited
Davis, B.E., and the Federal Interagency Sedimentation Project, 2005, A guide to the proper selection and use of Federally approved sediment and water-quality samplers: U.S. Geological Survey Open-File Report 2005–1087, 20 p., accessed November 2023 at https://doi.org/10.3133/ofr20051087.
Hanover Powder Coating, [undated], Hanover powder coating—Marine, cycle, auto, industrial, decoration, furniture: Hanover Powder Coating website, accessed May 2024 at http://hanoverpowdercoating.com.
Shipboard Scientific Party, 2002, Figure F9, in Explanatory Notes, chap. 2 of Peter, L.L., ed., Proceedings of the Ocean Drilling Program: Initial Reports vol. 197, prepared by the Ocean Drilling Program, College Station, Texas, p. 54, accessed June 2022 at https://doi.org/10.2973/odp.proc.ir.197.102.2002. [Also available at http://www-odp.tamu.edu/publications/197_IR/chap_02/c2_f9.htm#255885.]
Thornton, A.M., 2025, Data to support the evaluation of alternative Coatings for USGS Water-Quality Samplers: U.S. Geological Survey data release, https://doi.org/10.5066/P144VS6G.
U.S. Geological Survey, 2002a, Capsule- and disk-filter procedure, section 5.2.1.A (version 3.0, March 2016) of Wilde, F.D., ed., Processing of water samples: U.S. Geological Survey Techniques of Water-Resources Investigations, book 9, chap. A5, accessed November 2023 at https://doi.org/10.3133/twri09A5.
U.S. Geological Survey, 2002b, Processing of water samples (ver. 2, April 2002) of Wilde, F.D., ed., Processing of water samples: U.S. Geological Survey Techniques of Water-Resources Investigations, book 9, chap. A5, accessed November 2023 at https://doi.org/10.3133/twri09A5.
U.S. Geological Survey, 2004, General cleaning procedures, section 3.2 of Cleaning of equipment for water sampling (ver. 2.0, April 2004): U.S. Geological Survey Techniques of Water-Resources Investigations, book 9, chap. A3, accessed November 2023 at https://pubs.usgs.gov/twri/twri9a3/final508Chap3book.pdf.
U.S. Geological Survey, 2006, Preventing sample contamination, section 4.0.2 (ver. 2.0, September 2006) of Collection of water samples: U.S. Geological Survey Techniques of Water-Resources Investigations, book 9, chap. A4, accessed November 2020 at https://doi.org/10.3133/twri09A4.
U.S. Geological Survey, 2023, Containers used for samples by the National Water Quality Laboratory: U.S. Geological Survey, accessed November 2020 at https://wwwnwql.cr.usgs.gov/qas/Containers%20at%20NWQL.pdf.
U.S. Geological Survey, [variously dated], National field manual for the collection of water-quality data, section A of Handbooks for water-resource investigations: U.S. Geological Survey Techniques of Water-Resources Investigations, book 9, 10 chap. (A0–A8, A10), accessed November 2020 at https://pubs.water.usgs.gov/twri9A.
Reference Cited
U.S. Geological Survey, 2023, Containers used for samples by the NWQL [National Water Quality Laboratory]: U.S. Geological Survey, accessed November 2020 at https://wwwnwql.cr.usgs.gov/qas/Containers%20at%20NWQL.pdf.
Appendix 1
Blank Sample Container Details and Processing Procedures
Blank samples were processed in the order listed below. Details of the container type are included along with the necessary steps for filling each bottle and any preservation needed. All samples were stored on ice and immediately shipped to National Water Quality Laboratory.
-
1. Unfiltered, chilled, acidified nutrient sample (WCA; 125-milligrams per liter [mg/L] clear high-density polyethylene [HDPE] bottle)—triple rinsed with deionized water (DIW), rinsed with water from the churn, filled to bottle shoulder, acidified with 1 mL sulfuric acid
-
2. Total organic carbon (TOC; 125-mg/L amber glass bottle)—filled to bottle shoulder with water from the churn
-
3. Raw, unacidified sample (RU; 250-mg/L clear HDPE bottle)—triple rinsed with DIW, rinsed with water from the churn, filled to bottle shoulder
-
4. Attach 0.45-micron capsule filter, prime with 2 liters (L) DIW then 1 L water from the churn
-
5. Filtered, chilled sample (FCC; 125-mg/L amber HDPE bottle)—triple rinsed with DIW, rinsed with filtered water from the churn, filled to bottle shoulder
-
6. Filtered, acidified sample (FA; 250-mg/L acid-rinsed HDPE bottle)—triple rinsed with DIW, rinsed with filtered water from the churn, filled to the bottle shoulder, acidified with 2 mL nitric acid
-
7. Filtered, unacidified sample (FU; 250-mg/L clear HDPE bottle)—triple rinsed with DIW, rinsed with filtered water from the churn, filled to the bottle shoulder
Table 1.1.
Blank sample containers, lab schedules, and parameters.[Data are from U.S. Geological Survey, 2023. Specific conductance is in microsiemens per centimeter at 25 degrees Celsius (µS/cm at 25 °C). NWQL, National Water Quality Laboratory; WCA, unfiltered, chilled, acidified nutrient sample; N, nitrogen; mg/L, milligrams per liter; TOC, total organic carbon; RU, raw, unacidified sample; µs/cm, microsiemens per centimeter; C, Celsius; FU, filtered, unacidified sample; CaCO3, calcium carbonate; FCC, filtered, chilled sample; FA, filtered acidified; SiO2, silicon dioxide; µg/L, micrograms per liter]
Conversion Factors
U.S. customary units to International System of Units
Temperature in degrees Celsius (°C) may be converted to degrees Fahrenheit (°F) as follows:
°F = (1.8 × °C) + 32.
Temperature in degrees Fahrenheit (°F) may be converted to degrees Celsius (°C) as follows:
°C = (°F – 32) / 1.8.
Director, Virginia and West Virginia Water Science Center
U.S. Geological Survey
1730 East Parham Road
Richmond, Virginia 23228
or visit our website at
https://www.usgs.gov/centers/virginia-and-west-virginia-water-science-center
Publishing support provided by the Baltimore Publishing Service Center.
Disclaimers
Any use of trade, firm, or product names is for descriptive purposes only and does not imply endorsement by the U.S. Government.
Although this information product, for the most part, is in the public domain, it also may contain copyrighted materials as noted in the text. Permission to reproduce copyrighted items must be secured from the copyright owner.
Suggested Citation
Thornton, A.M., 2025, Evaluation of alternative coatings for U.S. Geological Survey water-quality samplers: U.S. Geological Survey Open-File Report 2025–1016, 15 p., https://doi.org/10.3133/ofr20251016.
ISSN: 2331-1258 (online)
| Publication type | Report |
|---|---|
| Publication Subtype | USGS Numbered Series |
| Title | Evaluation of alternative coatings for U.S. Geological Survey water-quality samplers |
| Series title | Open-File Report |
| Series number | 2025-1016 |
| DOI | 10.3133/ofr20251016 |
| Publication Date | April 16, 2025 |
| Year Published | 2025 |
| Language | English |
| Publisher | U.S. Geological Survey |
| Publisher location | Reston, VA |
| Contributing office(s) | Virginia and West Virginia Water Science Center |
| Description | Report: iv, 15 p.; Data Release |
| Online Only (Y/N) | Y |
| Additional Online Files (Y/N) | N |