

Generalized Potentiometric Maps of the Fort Union, Hell Creek, and Fox Hills Aquifers within the Standing Rock Reservation
Links
- Document: Pamphlet (2.6 MB pdf) , HTML , XML
- Sheets:
- Data Release: USGS data release - Datasets used to create generalized potentiometric maps of the Fort Union, Hell Creek, and Fox Hills aquifers within the Standing Rock Reservation
- NGMDB Index Page: National Geologic Map Database Index Page (html)
- Download citation as: RIS | Dublin Core
Acknowledgments
The authors would like to thank the Standing Rock Sioux Tribe for their assistance with well inventory and funding. The authors would also like to thank the reviewers of the manuscript and maps for their input and expertise.
Abstract
Generalized potentiometric surfaces of the Fort Union, Hell Creek, and Fox Hills aquifers were constructed to assess the groundwater resources of the Standing Rock Indian Reservation. Additionally, this information can provide water managers with tools and data to effectively manage water resources in the future. Previous studies that mapped the geology and hydrogeology of the area at differing scales were used to confirm in which aquifer the study wells were completed. Water-level data from wells are provided by the U.S. Geological Survey Groundwater System Inventory database, the South Dakota Department of Agriculture and Natural Resources, and the North Dakota Department of Water Resources. Hydrographs were constructed for five selected observation wells to evaluate historical water-level fluctuations and trends. Hydrographs for the Hell Creek aquifer showed a flat trend with a rise in 2020. Hydrographs for the deeper Fox Hills aquifer showed that water levels fluctuated in response to climatic conditions and demonstrated an increasing trend in water-level elevations starting in 2010. Hydrographs were not constructed for any wells completed in the Fort Union Formation because none of the wells had continuous long-term measurements.
Generalized potentiometric surfaces, constructed from interpolating water-level elevations, gave insight into groundwater flow directions. Groundwater in the Fort Union aquifer likely flows radially outward from the northwest part of the study area to the northeast and south-southeast parts. Groundwater in the Hell Creek aquifer generally flows from higher elevations in the northwest towards lower areas, where surface-water tributaries have incised into the aquifer. Groundwater in the Fox Hills aquifer likely flows from higher elevations in the west, southwest, and central parts of the study area towards the valleys of the Grand River and Missouri River.
Most wells used for constructing potentiometric maps had only one recorded water-level measurement from drillers at the time of well construction. These measurements are often subject to error because the well is still recovering and because of spatial limitations of data availability. Also, because single water-level measurements were recorded at different points in time, additional uncertainty is introduced by fluctuating climatic conditions effect on water levels. Potentiometric map interpretation limitations are a result of areas with sparse data. Limitations also arise from potentiometric surfaces generalizing a complex and dynamic hydrogeologic system; however, the generalized potentiometric surface maps can be used to assist water managers and can help prioritize locations for future monitoring in areas with high uncertainty from sparse existing data.
Introduction
The Standing Rock Sioux Tribe of North & South Dakota (the Tribe) and the U.S. Geological Survey (USGS) completed a comprehensive assessment of groundwater resources within the Standing Rock Reservation (fig. 1). This assessment is intended to help inform effective management of groundwater resources and provide data for addressing water rights issues of the Tribe. Water resource managers can use this assessment as a contribution towards future water resource management planning.
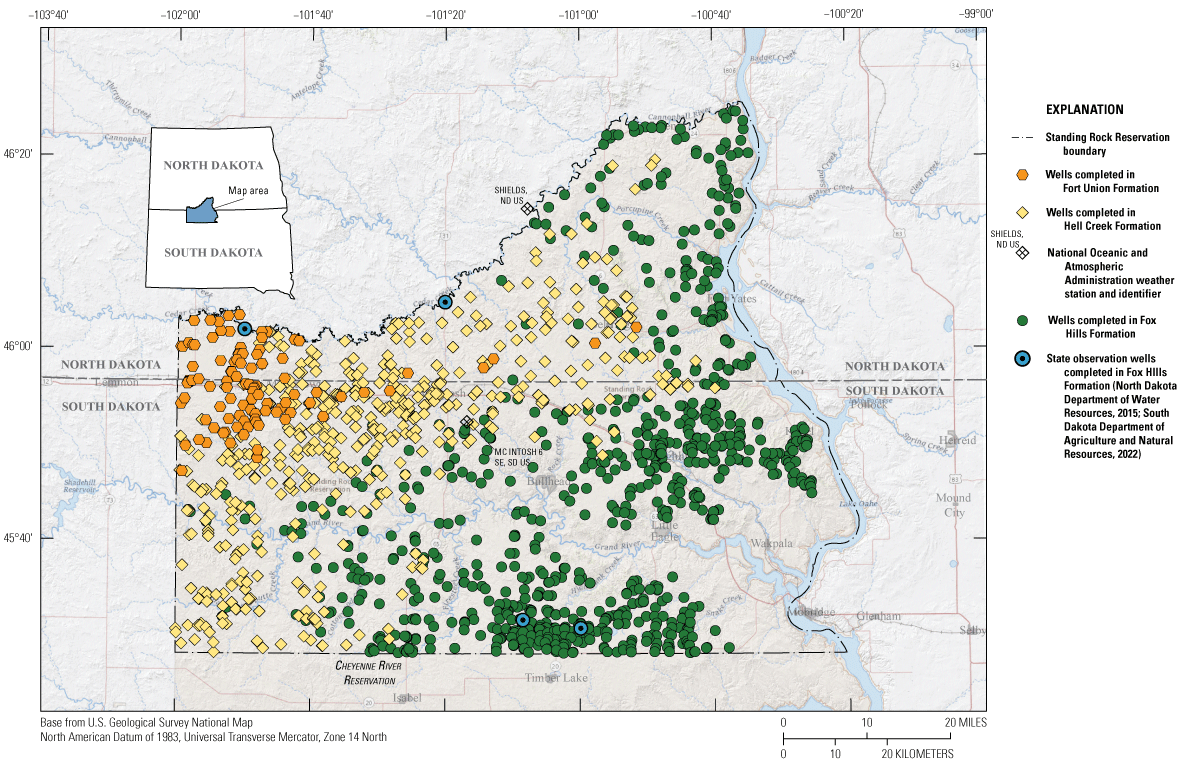
The study area and wells used in the construction of potentiometric surfaces for the Fort Union, Hell Creek, and Fox Hills aquifers, Standing Rock Reservation.
Groundwater is a vital resource for domestic and agricultural purposes for the region’s population. The primary land use on the Tribe’s land is cattle ranching and farming, with residents sparsely dispersed across 3,572 square miles in North and South Dakota. A primary concern for groundwater resources in the area is the potential for water quality and quantity effects from rapidly developing energy extraction in western North and northwestern South Dakota that is advancing towards the Tribe boundaries (Bartos and others, 2022). This energy extraction is causing concerns regarding future stresses on the quantity and quality of groundwater resources near the Tribe.
Purpose and Scope
The purpose of this report is to provide generalized potentiometric surface maps of the Fort Union, Hell Creek, and Fox Hills aquifers (sheet 1) within the boundaries of the Standing Rock Reservation. A potentiometric surface is a map of groundwater-level elevations (also known as hydraulic heads) represented by the water-table elevation in unconfined parts of an aquifer or by the elevation to which water will rise in a tightly cased well screened in a confined or semiconfined aquifer (Carter and others, 2002). The scope of this report is to describe and document the data and methods used to create the generalized potentiometric surface maps of the Fort Union, Hell Creek, and Fox Hills aquifers. Contour maps of the potentiometric surfaces were constructed to better understand general groundwater-flow directions. Water-levels from 1,605 wells collected between 1917 and 2022 were used to construct the maps of the Fox Hills (sheet 2), Hell Creek (sheet 3), and Fort Union (sheet 4) aquifers.
Previous Potentiometric Maps
Previous potentiometric maps of aquifers within the Standing Rock Reservation were made by Federal and State agencies. In 1975, the North Dakota Department of Water Resources (NDDWR) published maps of the groundwater resources as part of a larger county groundwater study (Randich, 1975). In 1982, The USGS previously published detailed maps of the hydrogeology, water chemistry, and potentiometric surfaces within the Standing Rock Reservation (Howells, 1982). A hydrogeologic framework was published with potentiometric surfaces for the Williston Basin on a regional scale that included the area of study in this report (Thamke and others, 2014). The Williston Basin maps were at a smaller scale than the Howells (1982) maps and divided the Fort Union aquifer into three subunits and the Hell Creek aquifer into two subunits. Aquifer-top elevation contours from Howells (1982) and Thamke and others (2014) were used to confirm the aquifer designation of wells in the study area. Where the aquifer tops of the two studies did not agree, the Howells (1982) dataset was preferred because the study was at a larger map scale and more detailed. This study builds upon previous studies by including wells drilled and water levels measured since the Howells study in 1982.
Description of Study Area
The study area covers 2.3 million acres within the boundaries of the Standing Rock Reservation. The Standing Rock Reservation includes Sioux County, North Dakota, and Corson County, South Dakota, and small areas of Dewey and Ziebach Counties in South Dakota. The eastern border is Lake Oahe, a reservoir on the Missouri River; the county lines of Adams in North Dakota and Perkins in South Dakota form the western boundary; the Cannonball River and Cedar Creek form the northern border; and the Cheyenne River Indian Reservation forms the southern border (fig. 1).
Physiography and Climate
The study area is within the Missouri Plateau division of the Great Plains physiographic province (Fenneman, 1946). Elevation of the land surface ranges from about 2,700 feet (ft) above sea level in the western edge of the study area to about 1,590 ft above sea level in the southeast part of the study area near the Missouri River (sheet 1). The topography of the land contains steep gullies and ravines where drainages have eroded into the soft geological materials exposed at the surface (Howells, 1982; sheet 1). Normal annual precipitation from 1991 to 2020 for the study area ranged from 17.1 to 19.2 inches (in.; PRISM Climate Group, 2022).
Two climate stations with long-term global monthly precipitation summaries were available and downloaded from the National Oceanic and Atmospheric Administration National Centers for Environmental Information. The stations were near Shields, N. Dak., and McIntosh, S. Dak. (fig. 1; Lawrimore and others, 2016). Mean annual precipitation was higher at the Shields station with a value of 16.03 in. and lower at the McIntosh station with a value of 14.98 in. (table 1). Monthly precipitation at both stations is greatest in the spring and summer months, with the maximum at both stations measured in June (table 2).
Table 1.
Summary of precipitation for two climate stations in the study area, Standing Rock Reservation.[Data are summarized from National Oceanic and Atmospheric Administration global monthly precipitation summaries (Lawrimore and others, 2016). NOAA, National Oceanic and Atmospheric Administration; %, percent; ND, North Dakota; US, United States; SE, southeast; SD, South Dakota]
| NOAA station number | Station name (fig. 1) | Precipitation, in inches | Period of record | |||
|---|---|---|---|---|---|---|
| Mean | 25th percentile | Median | 75th percentile | |||
| USC00328065 | SHIELDS, ND US | 16.03 | 13.40 | 15.94 | 18.46 | 1951–2022 |
| USC00395381 | MC INTOSH 6 SE, SD US | 14.98 | 12.88 | 14.95 | 18.14 | 1916–2022 |
Table 2.
Monthly precipitation statistics for two climate stations in the study area, Standing Rock Reservation.[Data are summarized from National Oceanic and Atmospheric Administration global monthly precipitation summaries (Lawrimore and others, 2016). ND, North Dakota; US, United States; SE, southeast; SD, South Dakota]
Geology and Hydrogeology of the Fort Union, Hell Creek, and Fox Hills Formations
The Standing Rock Indian Reservation is near the southeastern limits of the Williston Basin, a geologic basin made of dipping sedimentary rock units and known for its extensive petroleum reserves. The eastern boundary of the reservation lies at the western edge of the glacial ice margins that formed during times of glaciation (Bartos and others, 2022; Howells, 1982). Howells (1982) used soil maps, test drilling, field reconnaissance, and geologic data to produce maps of the area’s surficial geology, which included alluvium deposits, buried glacial deposits, and outcrops of the Fort Union, Hell Creek, Fox Hills, and Pierre Shale. The Fort Union, Hell Creek, and Fox Hills Formations are the most widely used aquifers in the study area, and only wells completed in these aquifers were analyzed for this report.
The youngest bedrock unit in the study area is the Tertiary-aged Fort Union Formation, which occupies a small area in the northwest corner of the study area (sheet 1). The Fort Union Formation (also called the Fort Union Group) is 0–350 ft thick in the study area. The formation also contains three stratigraphic members within the study area—the upper Tongue River Member, the middle Cannonball Member, and the basal Ludlow Member (Howells, 1982; Randich, 1975). The Tongue River member consists of poorly consolidated, interbedded, and very fine- to medium-grained sandstone, siltstone, claystone, shale, and lignite. The Cannonball Member of the Fort Union Formation is poorly consolidated, gray to yellow, and very fine- to medium-grained sandstone, siltstone, claystone, and dark-gray shale. The Cannonball Member contains persistent sandstone beds in the study area. The Ludlow Member consists of poorly consolidated sequences of buff and very fine- to medium-grained sandstone, siltstone, and claystone interbedded with lignite and shale (Howells, 1982; Randich, 1975). Perched water tables in the Fort Union Formation within the study area are common. Wells in the Fort Union Formation within the study area often have low yields of less than 10 gallons per minute (Howells, 1982).
Underlying the Fort Union Formation is the Cretaceous-aged Hell Creek Formation that can extend to about 370 ft thick in the study area and the uppermost bedrock unit where the Fort Union is absent (Howells, 1982; sheet 1). The Hell Creek Formation is a pale darkish blue, buff, brown to gray, and black bentonitic shale with poorly consolidated coarse to fine-grained quartzose sandstone and thin beds of lignite (Howells, 1982, Randich, 1975). The Hell Creek Formation is unconfined in areas where it crops out and confined where it is overlain by the Fort Union Formation. Wells in the Hell Creek Formation may supply adequate yields for stock and domestic use where the thickness is generally more than 100 ft (Howells, 1982).
The Cretaceous-aged Fox Hills Formation underlies the Hell Creek Formation and ranges from 0 to about 350 ft thick in the study area and is the uppermost bedrock unit where the Hell Creek Formation is absent. The Fox Hills Formation is composed of dark gray to greenish-gray silty to sandy clay, clayey silt, and very fine-grained sandstone. Areas of the Fox Hills Formation contain a poorly consolidated dark gray to yellowish-orange sandstone overlying the lower units (Howells, 1982; Randich, 1975). The Fox Hills Formation is unconfined where it crops out and confined where it is overlain by the Hell Creek Formation or both the Hell Creek and Fort Union Formations. The upper contact with the Hell Creek Formation and lower contact with the Pierre Shale is gradational. Wells in the Fox Hills Formation can supply high yields of fresh to saline water for stock and domestic use (Howells, 1982).
The oldest bedrock unit exposed in the study area is the Cretaceous-aged Pierre Shale. The Pierre Shale is exposed where the Grand River, along with other tributaries and drainages, have eroded the upper geologic units in the southeastern part of the study area (sheet 1). The Pierre Shale underlies the three previously mentioned aquifers considered in this study and consists of a grey and brown-to-black bentonitic shale with zones of limestone and iron concretions. The Pierre Shale is a relatively impermeable confining unit compared to the overlying Fox Hills Formation and is not a reliable source of water for stock or domestic use (Howells, 1982; Randich, 1975).
Data and Methods
This section describes the data and methods used to construct generalized potentiometric-surface maps for the Fort Union (sheet 4), Hell Creek (sheet 3), and Fox Hills (sheet 2) aquifers within the study area. Water levels were downloaded from three separate sources—the USGS Ground Water Site Inventory (GWSI) system, the NDDWR, and the South Dakota Department of Agriculture and Natural Resources (SDDANR).
Groundwater Wells
Most of the well information in the GWSI database was from water-well completion reports and driller logs. The water level listed on the drillers report, the location, well depth, aquifer, and water use were recorded in GWSI. Most of the reported water use for the wells in GWSI were for domestic and stock purposes (fig. 2A). Well construction dates in the GWSI ranged from 1910 to 2019 (fig. 2D). Several of these driller logs and water-well completion reports do not report the location of the well with high accuracy. Additionally, the driller logs and completion reports often only report to the nearest quarter section of the Public Land Survey System section-township-range system. The Standing Rock Sioux Tribe assisted with refining well location information in the GWSI database to get more accurate locations, elevations, and water levels when possible. In total, the Tribe and USGS visited 487 of the 1,317 wells in the GWSI database within the study area (fig. 2C). Most wells only had one recorded water-level in GWSI, with a small number of wells having more than two water-level measurements (fig. 2B).
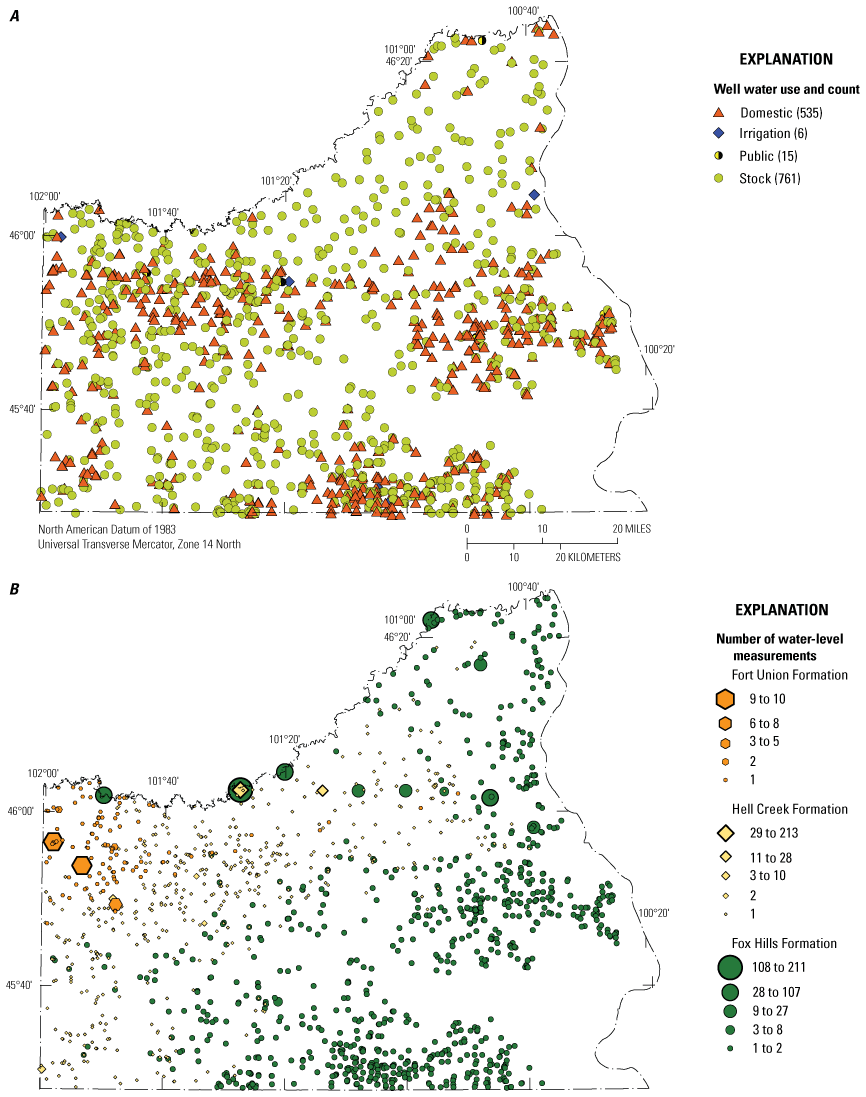
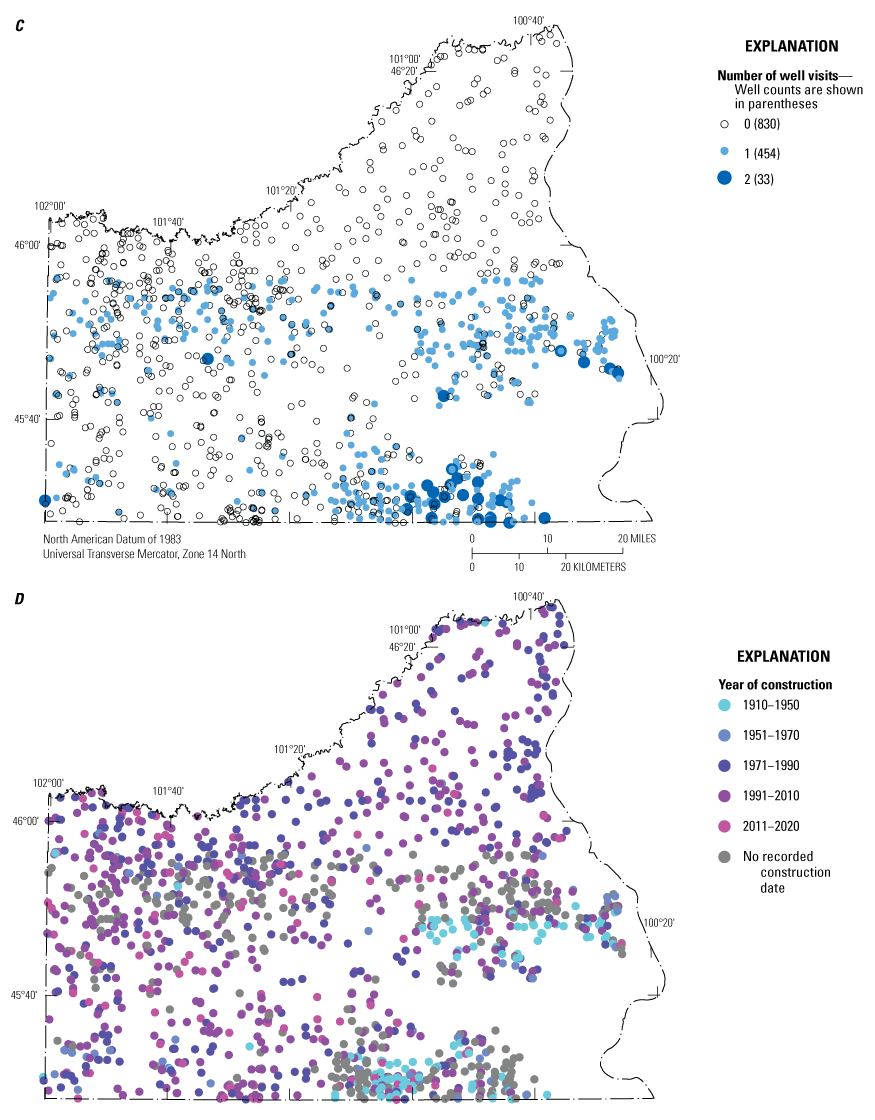
The distribution and characteristics of wells used in the creation of the potentiometric surface maps. A, water use recorded in the U.S. Geological Survey Ground Water Site Inventory (GWSI) of wells in the study area; B, the number of water-level measurements recorded in wells in the study area available in GWSI; C, The number of recorded visits to wells in the study area in GWSI; and, D, recorded well construction dates in the study area.
Water levels from observation wells provided by the SDDANR (2022) and NDDWR (2015) were used to supplement the water-levels from GWSI to make the potentiometric surface maps (fig. 1). Two observation wells monitored by the SDDANR (CN-57AR and CN-57BR) were completed in the Fox Hills aquifer and had the longest, most-complete record of any dataset. The NDDWR observation well database included wells that also had water-level measurements in GWSI. Where water-level data overlapped, USGS data from GWSI were used for this study. Ten NDDWR observation wells were used in the creation of the potentiometric surfaces and all 10 were also present in GWSI.
Well Hydrographs
Selected observation wells where multiple water-level measurements were made through time were used to construct hydrographs (fig. 3). Only one observation well—site 460244101272702—within the Hell Creek Formation had a long enough record to document long-term water-level trends of at least 20 years. The hydrograph of the observation well completed in the Hell Creek Formation showed a mostly flat trend for most of the period of record, until the groundwater level steeply rose at the beginning of 2020. Observation wells completed within the Fox Hills Formation showed increasing trends in water-levels from about 2010 to 2022 (fig. 3). The two SDDANR observation wells completed in the Fox Hills Formation with longer periods of record showed water levels within the Fox Hills aquifer changed in response to fluctuations in local climate as seen from National Centers for Environmental Information climate data (fig. 4). As shown in figure 5, the cumulative departure from monthly average precipitation closely correlates to the water-level fluctuations of both SDDANR observation wells.
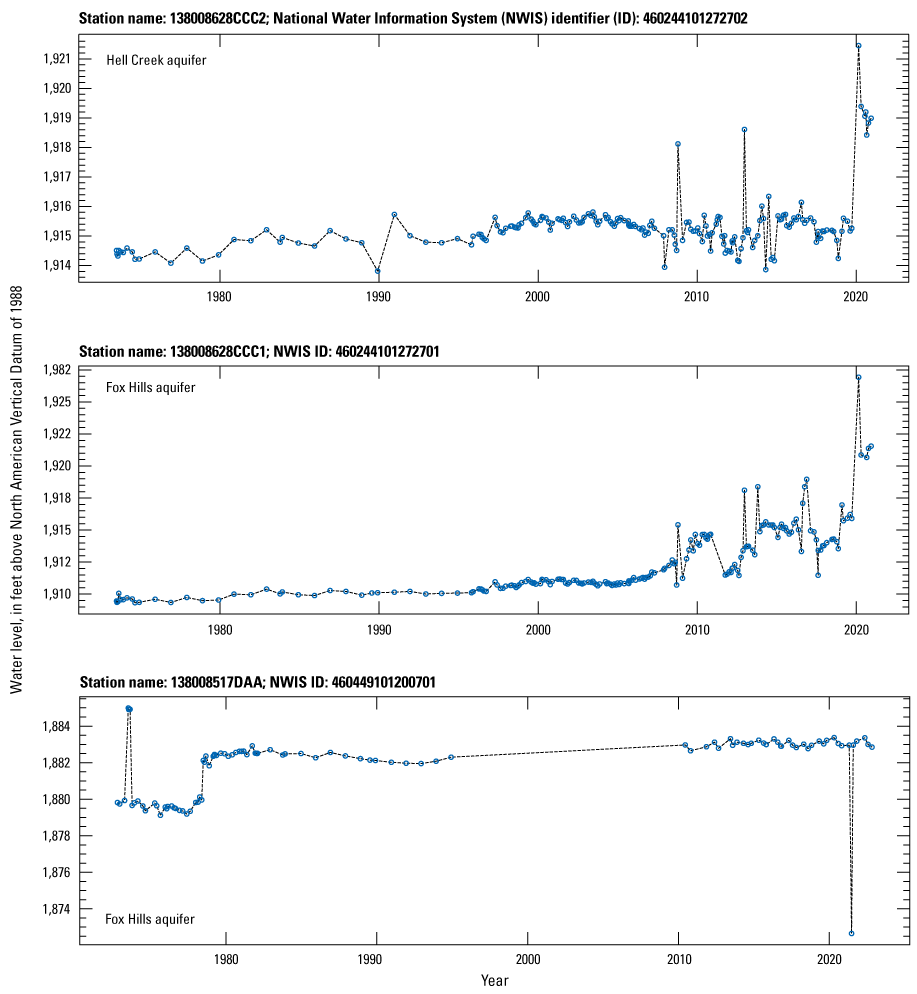

Well hydrographs from selected observation wells completed in the Hell Creek and Fox Hills aquifers within the study area, Standing Rock Reservation.
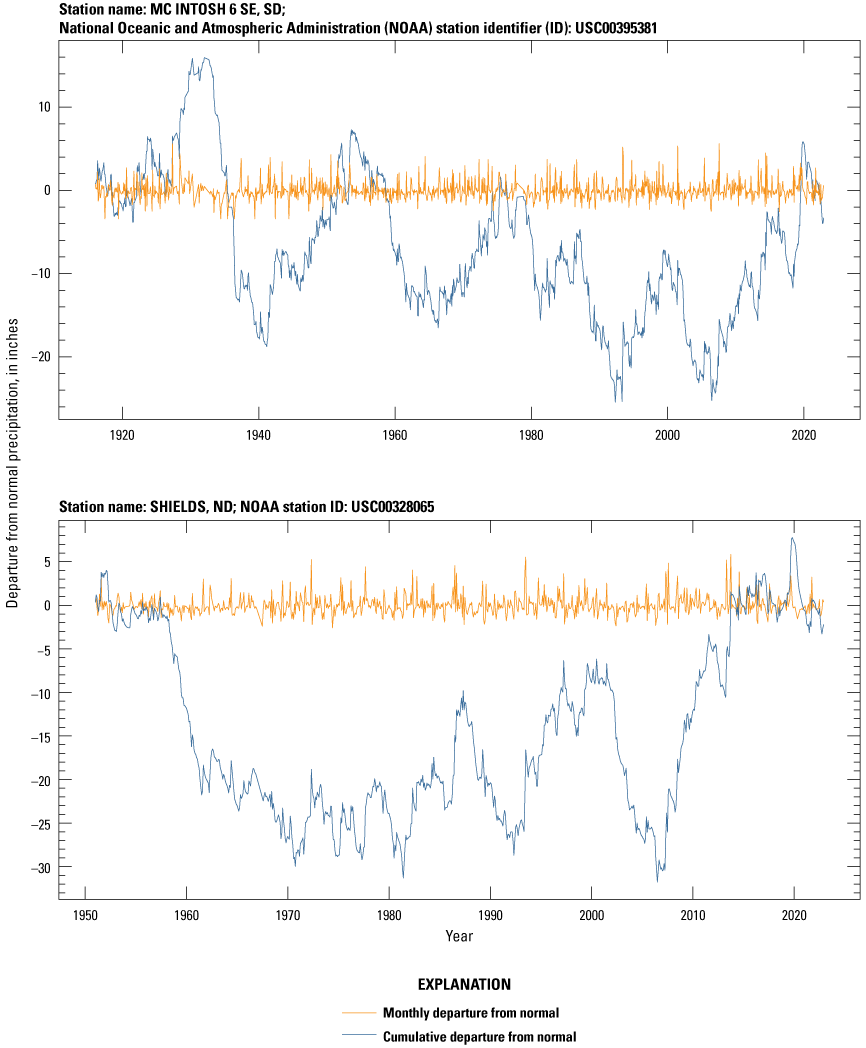
Precipitation for McIntosh and Shields climate stations showing monthly and cumulative departure from normal in the study area, Standing Rock Reservation.
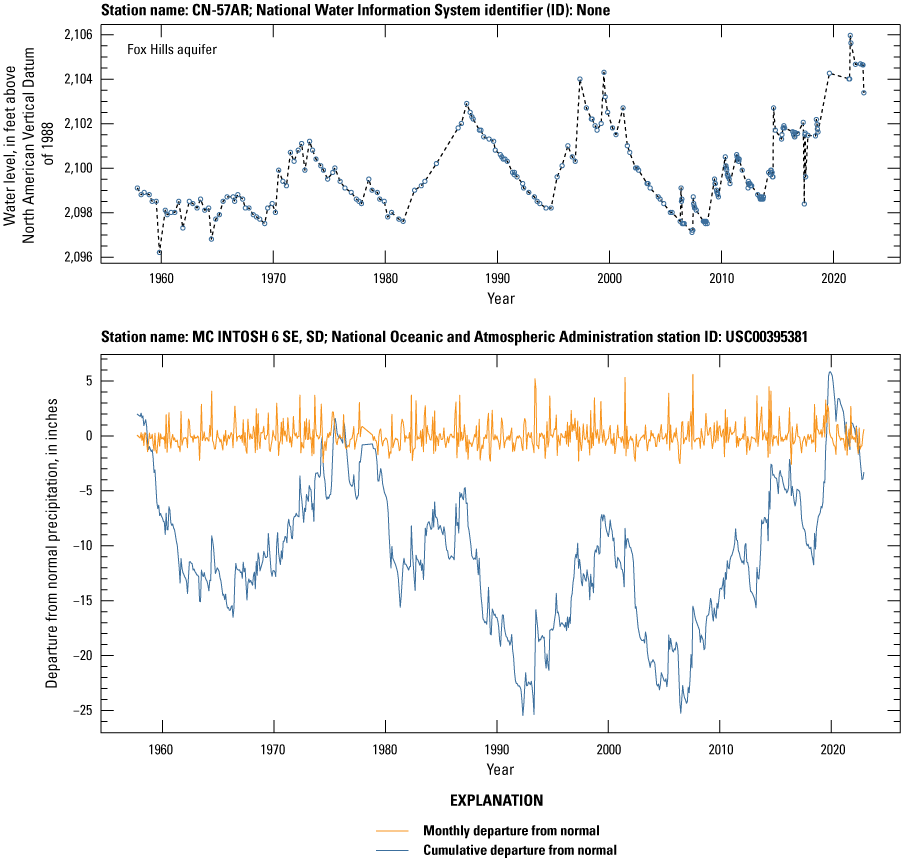
Comparison of precipitation at the McIntosh climate station and a hydrograph of an observation well completed in the Fox Hills aquifer in the study area, Standing Rock Reservation.
Generalized Potentiometric-Surface Maps
Water-level data from GWSI, NDDWR, and SDDANR were used to construct generalized potentiometric-surface maps representing average conditions of the Fort Union, Hell Creek, and Fox Hills Formations. The water-level measurements mean was used for wells with more than one water-level measurement. Recorded depth to water-levels were converted to hydraulic head by subtracting the water level from the land-surface elevation at the well location. Wells with location information and average hydraulic-head data used in the creation of the potentiometric-surface maps are available in the data release associated with this report (Anderson, 2024). Hydraulic-head values were spatially interpolated using Simple Kriging methods using the Geostatistical Wizard, available in ArcGIS Pro (Esri, 2023), to create 2-dimensional potentiometric surfaces. A nondeterminative interpolation method was preferred to a determinative exact interpolation method such as inverse distance weighting or radial basis functions. This was because hydraulic head measurements calculated for different years may be representative of different local climatic conditions. The interpolated potentiometric surfaces were contoured using contour intervals of 50 ft and smoothed to correct for extreme changes in the potentiometric surfaces in areas of sparse data.
Groundwater Flow
The generalized potentiometric surface maps were used to estimate groundwater-flow directions of the three aquifers within the study area (sheets 2–4). Groundwater-flow directions were assumed to be perpendicular to the potentiometric contours. The potentiometric surface of the Fort Union aquifer in the study area shows that water originating in the northwest part of the study area flows radially outward to the northeast and south-southeast (sheet 4). The two isolated areas of the Fort Union aquifer in the north-central area of the map did not have enough data to interpolate a potentiometric surface or estimate flow direction. The potentiometric surface of the Hell Creek aquifer illustrates that water flows from higher elevations toward areas where drainages have incised into the aquifer (sheet 3). Higher hydraulic head elevations of the Hell Creek aquifer are in the southwest and northwest parts of the map. An isolated region of the Hell Creek aquifer in the northernmost part of the map did not have enough data to estimate a potentiometric surface or flow direction. The potentiometric surface of the Fox Hills aquifer shows that groundwater likely flows from high elevations in the west, southwest, and central parts of the maps towards the valleys of the Grand and Missouri Rivers. Data in the northwest part of the study area are sparse, and the flow direction in this area is uncertain.
Data and Interpretive Limitations
The available data and interpretation methods used to construct the potentiometric-surface maps have limitations. Most of the data used to construct the maps consisted of a single water-level measurement made by a well driller at the time of well construction. Drillers’ measurements could be from uncalibrated instruments subject to errors or from a well in which the water level had not fully recovered after well completion and development. Additionally, single water-level measurements were collected in different years, during different climatic conditions, and at different depth intervals within the aquifer; therefore, the potentiometric surfaces are considered general and not specific.
Data interpretation had limitations because potentiometric contours are nonunique numeric approximations of a complex and dynamic system. The three aquifers likely consist of areas where water tables could be perched or noncontinuous, which can affect the interpretation of a continuous potentiometric surface. Taylor and Alley (2001) showed the importance of long-term groundwater-level monitoring and the effects of data gaps when spatially interpreting water-level data. Areas with sparse data create regions in the potentiometric surface maps with less accurate interpretations and highly inferred contours.
Summary
The Standing Rock Sioux Tribe of North & South Dakota partnered with the U.S. Geological Survey to complete a cooperative study to assess the groundwater resources of the Standing Rock Reservation. Additionally, this study provides water managers with tools and data to effectively manage water resources in the future. Previous studies mapped the geology and hydrogeology of the area at differing scales and were used to confirm aquifer designations of the wells within the study area. Water-levels of wells from the U.S. Geological Survey Groundwater System Inventory database, the South Dakota Department of Agriculture and Natural Resources, and the North Dakota Department of Water Resources were used to construct a generalized potentiometric surface of the Fort Union, Hell Creek, and Fox Hills aquifers.
Hydrographs were constructed for five selected observation wells to evaluate historical water-level fluctuations and trends. Hydrographs for the Hell Creek aquifer showed a flat trend with a spike in 2020. Hydrographs for the Fox Hills aquifer showed water-levels fluctuated in response to climatic conditions and an increasing trend in water-level elevations was observed from 2010 to 2022. Hydrographs were not constructed for any wells completed in the Fort Union Formation because none of the wells had continuous long-term measurements.
Generalized potentiometric surfaces constructed from interpolating water-level elevations gave insights into groundwater flow directions. Groundwater in the Fort Union aquifer likely flows radially outward from the northwest part of the study area towards the northeast and south-southeast. Groundwater in the Hell Creek aquifer generally flows from high elevations toward areas where drainages have incised into the aquifer. Groundwater in the Fox Hills aquifer likely flows from high elevations in the west, southwest, and central parts of the study area towards the valleys of the Grand and Missouri Rivers.
Single water-level measurements from drillers at the time of well construction are subject to error and spatial limitations of data availability. Also, single water-level measurements were recorded at different times during different climate conditions. Interpretation limitations of the potentiometric maps were the result of areas with sparse data. Limitations also arise from the generalized interpretation of the potentiometric surfaces of a complex and dynamic hydrogeologic system; however, the generalized potentiometric surface maps can be used to assist water managers in the development of future monitoring programs in areas with high uncertainty and sparse data.
References Cited
Anderson, T.M., 2024, Datasets used to create generalized potentiometric maps of the Fort Union, Hell Creek, and Fox Hills aquifers within the Standing Rock Reservation: U.S. Geological Survey data release, https://doi.org/10.5066/P9KG3KOE.
Bartos, T.T., Sando, S.K., Preston, T.M., Delzer, G.C., Lundgren, R.F., Nustad, R.A., Caldwell, R.R., Peterman, Z.E., Smith, B.D., Macek-Rowland, K.M., Bender, D.A., Frankforter, J.D., and Galloway, J.M., 2022, Potential effects of energy development on environmental resources of the Williston Basin in Montana, North Dakota, and South Dakota—Water resources (ver. 1.1, October 2022): U.S. Geological Survey Scientific Investigations Report 2017–5070–C, 159 p., accessed April 2023 at https://doi.org/10.3133/sir20175070C.
Carter, J.M., Driscoll, D.G., Williamson, J.E., and Lindquist, V.A., 2002, Atlas of water resources in the Black Hills area, South Dakota: U.S. Geological Survey Hydrologic Investigations Atlas HA–747, 120 p. [Also available at https://pubs.usgs.gov/ha/ha747/.]
Esri, 2023, Kriging in Geostatistical Analyst: Esri, ArcGIS Pro Desktop Tool Reference, accessed April 2023, at https://pro.arcgis.com/en/pro-app/latest/help/analysis/geostatistical-analyst/kriging-in-geostatistical-analyst.htm.
Howells, L.W., 1982, Geohydrology of the Standing Rock Indian Reservation: North and South Dakota: Hydrologic Atlas, v. 644, accessed April 2023 at https://doi.org/10.3133/ha644.
Lawrimore, J.H., Ray, R., Applequist, S., Korzeniewski, B., and Menne, M.J., 2016, Global Summary of the Month (GSOM), Version 1.0.3 [precipitation]: National Oceanic and Atmospheric Administration National Centers for Environmental Information web page, accessed September 2023 at https://doi.org/10.7289/V5QV3JJ5.
North Dakota Department of Water Resources [NDDWR], 2015, Ground/surface water data: North Dakota State Water Commission web page, accessed April 2023 at https://www.swc.nd.gov/info_edu/map_data_resources/groundsurfacewater/.
PRISM Climate Group, 2022, United states average total precipitation, 1991-2020 (800m; ASCII GRID): PRISM web page, accessed December 2022 at https://prism.oregonstate.edu.
Randich, P.G., 1975, Ground-water basic data for Grant and Sioux Counties, North Dakota: U.S. Geological Survey for North Dakota State Water Commission County Ground Water Studies 24, part II, and North Dakota Geological Survey Bulletin 67, part II, 303 p. [Also available at https://www.swc.nd.gov/info_edu/reports_and_publications/county_groundwater_studies/pdfs/Grant_Sioux_Part_II.pdf.]
South Dakota Department of Agriculture and Natural Resources [SDDANR], 2022, Observation Wells data: South Dakota Department of Agriculture and Natural Resources database, accessed December 2022 at https://apps.sd.gov/NR69obswell/default.aspx.
Taylor, C.J., and Alley, W.M., 2001, Ground-water-level monitoring and the importance of long-term water-level data: U.S. Geological Survey Circular 1217, 68 p. [Also available at https://doi.org/10.3133/cir1217.]
Thamke, J.N., LeCain, G.D., and Ryter, D.W., Sando, Roy, and Long, A.J., 2014, Hydrogeologic framework of the uppermost principal aquifer systems in the Williston and Powder River structural basins, United States and Canada (ver. 1.1, December 2014): U.S. Geological Survey Scientific Investigations Report 2014–5047, 38 p. [Also available at https://doi.org/10.3133/sir20145047.]
Conversion Factors
U.S. customary units to International System of Units
Temperature in degrees Fahrenheit (°F) may be converted to degrees Celsius (°C) as follows:
°C = (°F – 32) / 1.8.
Datum
Vertical coordinate information is referenced to the North American Vertical Datum of 1988 (NAVD 88).
Horizontal coordinate information is referenced to the North American Datum of 1983 (NAD 83).
Supplemental Information
Water level is given in feet below land surface as positive and feet above land surface as negative.
For more information about this publication, contact:
Director, USGS Dakota Water Science Center
821 East Interstate Avenue, Bismarck, ND 58503
1608 Mountain View Road, Rapid City, SD 57702
605–394–3200
For additional information, visit: https://www.usgs.gov/centers/dakota-water
Publishing support provided by the Rolla Publishing Service Center
Disclaimers
Any use of trade, firm, or product names is for descriptive purposes only and does not imply endorsement by the U.S. Government.
Although this information product, for the most part, is in the public domain, it also may contain copyrighted materials as noted in the text. Permission to reproduce copyrighted items must be secured from the copyright owner.
Suggested Citation
Anderson, T.M., and Lundgren, R.F., 2024, Generalized potentiometric maps of the Fort Union, Hell Creek, and Fox Hills aquifers within the Standing Rock Reservation: U.S. Geological Survey Scientific Investigations Map 3516, 4 sheets, includes 13-p. pamphlet, https://doi.org/10.3133/sim3516.
ISSN: 2329-132X (online)
Study Area
| Publication type | Report |
|---|---|
| Publication Subtype | USGS Numbered Series |
| Title | Generalized potentiometric maps of the Fort Union, Hell Creek, and Fox Hills aquifers within the Standing Rock Reservation |
| Series title | Scientific Investigations Map |
| Series number | 3516 |
| DOI | 10.3133/sim3516 |
| Publication Date | February 02, 2024 |
| Year Published | 2024 |
| Language | English |
| Publisher | U.S. Geological Survey |
| Publisher location | Reston, VA |
| Contributing office(s) | Dakota Water Science Center |
| Description | Pamphlet: vii, 13 p.; 4 Sheets: 42.00 x 36.00 inches or smaller; Data Release |
| Country | United States |
| State | North Dakota, South Dakota |
| Other Geospatial | Fort Union, Hell Creek, and Fox Hills aquifers, Standing Rock Reservation |
| Online Only (Y/N) | Y |
| Additional Online Files (Y/N) | Y |