

2022 Drought in New England
Links
- Document: Report (15.4 MB pdf) , HTML , XML
- Tables:
- Table 7.1 (6.88 KB txt) - Streamgages used in a drought analysis for New England in 2022
- Table 7.2 (9.11 KB txt) - Groundwater monitoring stations used in a drought analysis for New England in 2022
- Appendixes:
- Appendix 1 (1.13 MB pdf) - Drought in Connecticut in 2022
- Appendix 2 (1.26 MB pdf) - Drought in Maine in 2022
- Appendix 3 (0.98 MB pdf) - Drought in Massachusetts in 2022
- Appendix 4 (0.99 MB pdf) - Drought in New Hampshire in 2022
- Appendix 5 (1.00 MB pdf) - Drought in Rhode Island in 2022
- Appendix 6 (0.98 MB pdf) - Drought in Vermont in 2022
- Dataset: USGS National Water Information System database - USGS water data for the nation
- NGMDB Index Page: National Geologic Map Database Index Page (html)
- Download citation as: RIS | Dublin Core
Acknowledgments
The authors thank the numerous partners, collaborators, and stakeholders who cooperate with the U.S. Geological Survey (USGS) to maintain the network of streamflow and groundwater-level monitoring sites in New England. The authors thank Janet Barclay of the USGS for her contributions to this report and the many hydrologic technicians of the USGS in New England for collecting the data that made this study possible.
Introduction
During April through September 2022, much of New England experienced a short but extreme hydrologic drought that was similar to the drought of 2020. By August 2022, Providence, Rhode Island, was declared a Federal disaster area, and New London and Windham counties in Connecticut were declared natural disaster areas. Mandatory water use restrictions were put in place in communities in Connecticut, Massachusetts, New Hampshire, and Rhode Island (Mecray and Borisoff, 2022). Precipitation in many areas of New England fell below normal levels in November 2021 and continued to decline until September 2022, contributing to low streamflows and groundwater levels in the region. U.S. Geological Survey (USGS) streamflow and groundwater conditions from April to September 2022 were used to characterize the hydrologic component of this short-duration drought. Several record low streamflows and groundwater levels were observed across New England, even falling below 2020 levels in parts of southern New England. The severity of this drought varied across New England, and regional and statewide perspectives are presented in this report.
Highlights
-
• May through August in 2022 ranked as the driest for those 4 months in 138 years of record at Boston, Massachusetts, with only 5.74 inches of rain (average of 13.26 inches).
-
• Water levels at 95 USGS groundwater monitoring wells across New England were below normal in August; 16 of these wells recorded their lowest August water level in 25 years.
-
• Flows at 54 USGS streamgages across New England were below normal in August, and 10 of those streamgages recorded their lowest August flows in 30 years.
-
• Two USGS streamgages in Massachusetts (stations 01105600 and 01171500 with 56 and 83 years of record, respectively) had record 7-day average low flows on August 21, 2022, and August 22, 2022, respectively.
Study Area
Data from 78 USGS streamgages and 126 USGS groundwater monitoring wells (fig. 1) were used to characterize the hydrologic component of the 2022 drought in New England. Elevations in New England range from 0 feet (ft) relative to the North American Vertical Datum of 1988 (NAVD 88) at the coastline to 6,288 ft NAVD 88 at Mount Washington in New Hampshire (U.S. Geological Survey, 2023). Geologically, in much of the region, the river valleys consist of sand and gravel deposits, and the upland areas, of till deposits (Soller and Reheis, 2004). Glacial deposits overlay carbonate-rock, sandstone, and crystalline rock. Climatologically, average annual precipitation ranged from 36 to 60 inches for the 30-year period from 1981 through 2010 (PRISM Climate Group, 2020; National Oceanic and Atmospheric Administration, 2022b). Although precipitation is generally evenly distributed throughout the year, the lowest streamflows and groundwater levels are generally in the late summer and early fall.
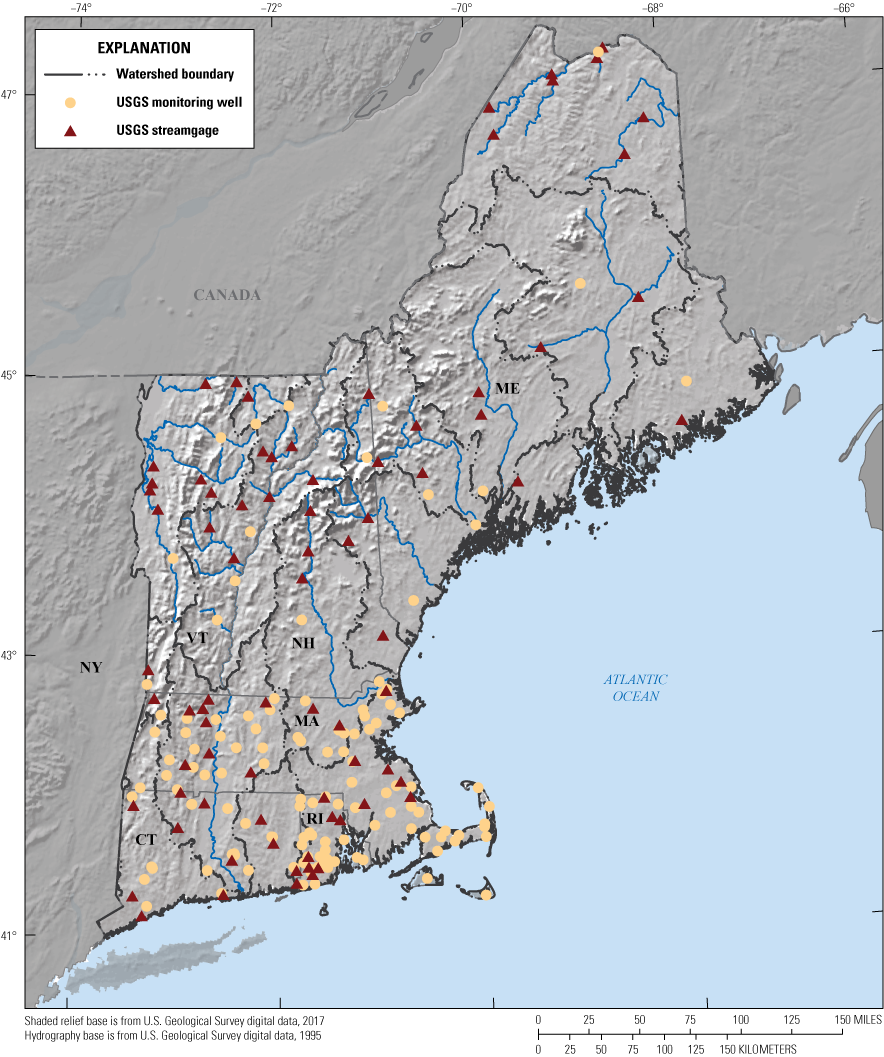
Map showing locations of U.S. Geological Survey (USGS) streamgages and groundwater monitoring wells in New England used for drought analyses for 2022 and boundaries of major watersheds. Watershed boundaries are based on the drainage basin six-digit hydrologic unit code boundaries from the National Hydrology Dataset Plus High Resolution (Moore and others, 2019).
Drought Definition
Droughts are defined by their spatial extent, intensity, magnitude, and duration; the components of the hydrologic cycle they affect; and the systems they affect. For example, a meteorological drought is defined by below-average precipitation, whereas an agricultural drought is defined by below-average soil moisture at a time critical to crop development. Hydrologic droughts are characterized by below-average streamflow or groundwater levels and typically lag meteorological and agricultural droughts; a flash drought is typically defined by how quickly drought conditions intensify. Socioeconomic droughts occur when the demand for goods exceeds supply as a result of shortfalls in water supplies, and ecological droughts are prolonged and widespread deficits in water supplies that create stresses across multiple ecosystems (National Drought Mitigation Center, 2022c). Although the 2022 drought in New England included all the above listed types of drought at different times and to different geographic extents between April and September, this report highlights the hydrologic drought during this period.
Drought Severity
For the purposes of a drought declaration, each of the New England States defines drought levels differently (National Drought Mitigation Center, 2022b). The U.S. Drought Monitor (National Drought Mitigation Center, 2022a) characterizes drought similarly across the States using a combination of indicators including the standardized precipitation index, streamflows percentiles, soil moisture percentiles, and the Palmer drought severity index (based on precipitation and temperature). The U.S. Drought Monitor integrates these indicators into five categories: D0, abnormally dry; D1, moderate drought; D2, severe drought; D3, extreme drought; and D4, exceptional drought. Extreme drought includes widespread crop loss, modified recreation, extremely reduced streamflow to no flow, and increased well drilling and bulk water hauling. Extreme droughts would be expected to happen on average once every 20 to 50 years (Svoboda and others, 2002).
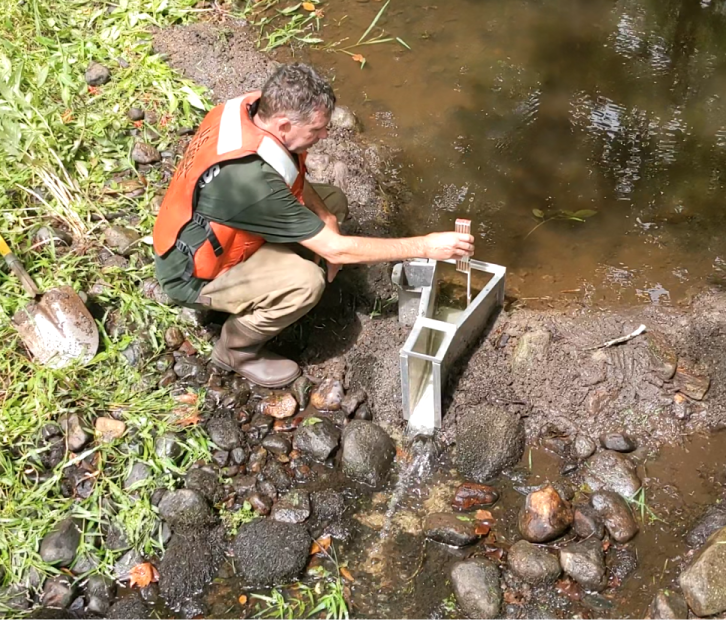
Photograph of a low streamflow measurement made using a Parshall flume at the Pendleton Hill Brook near Clarks Falls, Connecticut (01118300) U.S. Geological Survey streamgage on August 11, 2022; photograph from video by Nigel Pepin, U.S. Geological Survey.
Based on the U.S. Drought Monitor (National Drought Mitigation Center, 2022a), northern parts of Maine, New Hampshire, and Vermont started water year 2022 with dry conditions carried over from summer 2021. Dry conditions started expanding into southern New England in mid-May and were widespread by mid-August, with parts of southeastern New-England reaching extreme drought. At the peak of drought severity in August, Rhode Island, Massachusetts, and Connecticut had 99, 39.5, and 13 percent of their respective areas, in D3–extreme drought conditions. Maine, New Hampshire, and Vermont did not experience as severe conditions, with only a very small part of southeastern New Hampshire along the Massachusetts border meeting the U.S. Drought Monitor’s classification of D3–extreme drought classification during 2022.
Meteorological Drought
Snowpack
Historical data on the water content of snowpack in New England are limited. For much of the late winter and spring 2022, snow water content in coastal Maine was in the lowest 10 to 25 percent of the past 10 years. By April, most of the State except northern Maine had snow water content in the lowest 10 percent of the past 10 years (Maine Geological Survey, 2022). New Hampshire had above average snow water content from the end of January through mid-February in most basins, and then average to below average snow water content in March except in the Mascoma and Lake Francis areas where it remained above average (25 to 70 years of record; New Hampshire Department of Environmental Services, 2022).
Temperature and Potential Evapotranspiration
New England was characterized by above average temperatures and above average potential evapotranspiration for much of summer 2022 (June to August), which was ranked the second warmest in Massachusetts and Rhode Island, the third warmest in Connecticut, and the fourth warmest in New Hampshire based on 128 years (1895–2022) of records (National Oceanic and Atmospheric Administration, 2022c). The meteorological station in Portland, Maine, recorded the second warmest summer on record, with an average temperature of 69.1 degrees Fahrenheit (°F), ranking only lower than summer 2020, which was the warmest on record (National Oceanic and Atmospheric Administration, 2022a). Connecticut, Rhode Island, Massachusetts, and New Hampshire recorded the warmest August on record in 128 years. The average August temperature in Massachusetts was 4.4 °F above average, the furthest from average in all New England States (National Oceanic and Atmospheric Administration, 2022c).
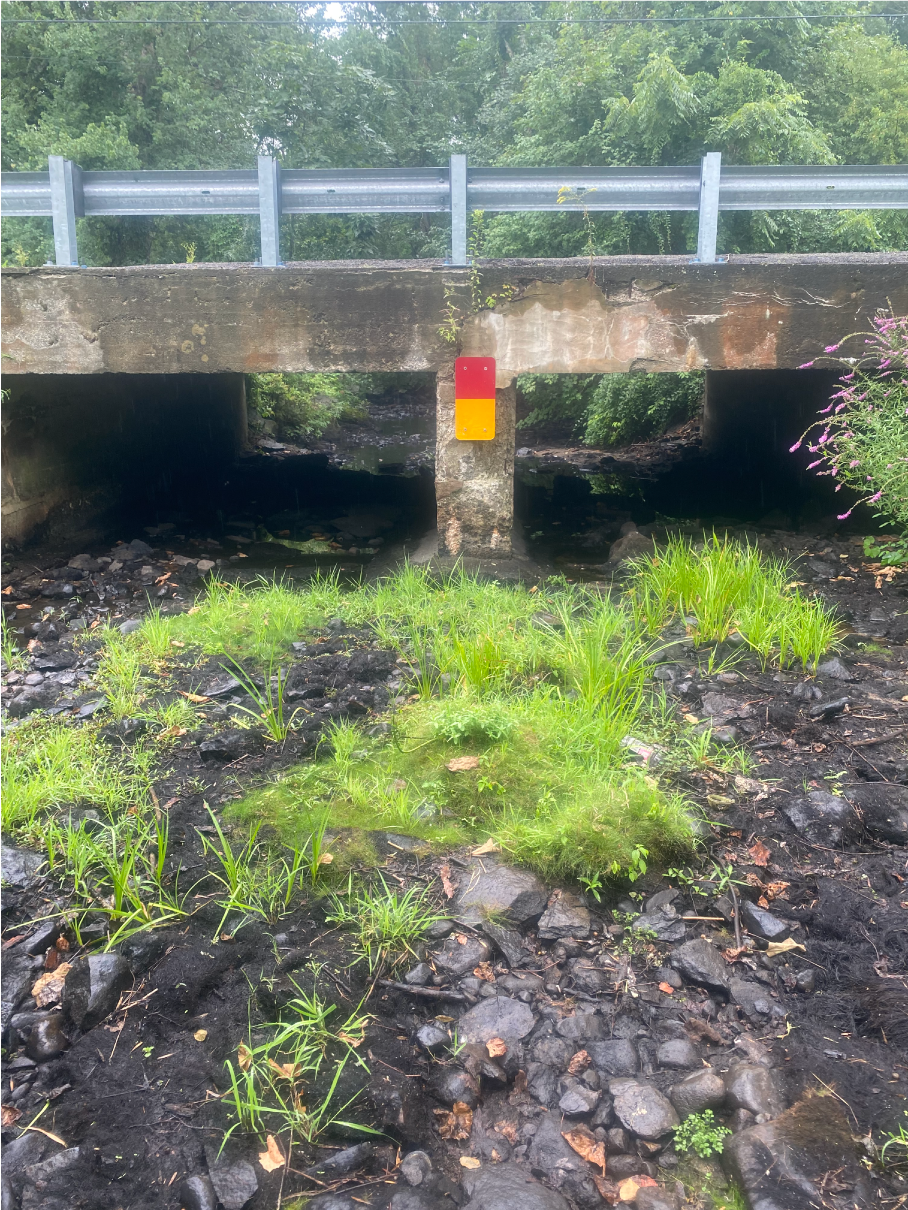
Photograph of streambed with zero streamflow at the Segreganset River near North Dighton, Massachusetts (01109070) U.S. Geological Survey streamgage on August 21, 2022; photograph by Kyle Fronte, U.S. Geological Survey.
In Boston, Massachusetts, cumulative potential evapotranspiration (PET) stayed above average from March through August 2022, with the most rapid increase between June and mid-August. By mid-August, PET in Boston reached more than 5 inches, more than 1.5 inches above average. Cumulative PET in Caribou in northern Maine was up to 0.3 inch above average between May and mid-June and from mid-July to the end of August (National Oceanic and Atmospheric Administration, 2022b; Northeast Regional Climate Center, 2022).
Rainfall
During July to September 2021, many southern New England States had received excess rainfall due to the remnants of tropical storms Henri, Elsa, and Ida, but by November 2021, precipitation had fallen below average in many areas. In water year 2022, much of New England recorded below average precipitation, ranging from 44 inches (greater than [>] 3 inches below average) in Portland, Maine, to 30.77 inches (>16 inches below average) in Westerly, R.I., based on averages from the 1981–2010 period of record (fig. 2; National Oceanic and Atmospheric Administration, 2022a). Precipitation in Westerly was nearly 10 inches below average for water year 2022 by May and continued to decline to >18 inches below the water year average in early September (fig. 2). Stations in Boston recorded the driest May through August ever from 1884 to 2022, with only 5.74 inches of rainfall (average is 13.28 inches; National Oceanic and Atmospheric Administration, 2022a). Many areas of New England received monthly precipitation in June 2022 that was 2 to 3 inches below the average. July 2022 was ranked as the second driest July on record (1893–2022) in Rhode Island, with Providence only receiving 0.46 inch of rainfall (average 3.03 inches; National Oceanic and Atmospheric Administration, 2022a, d).
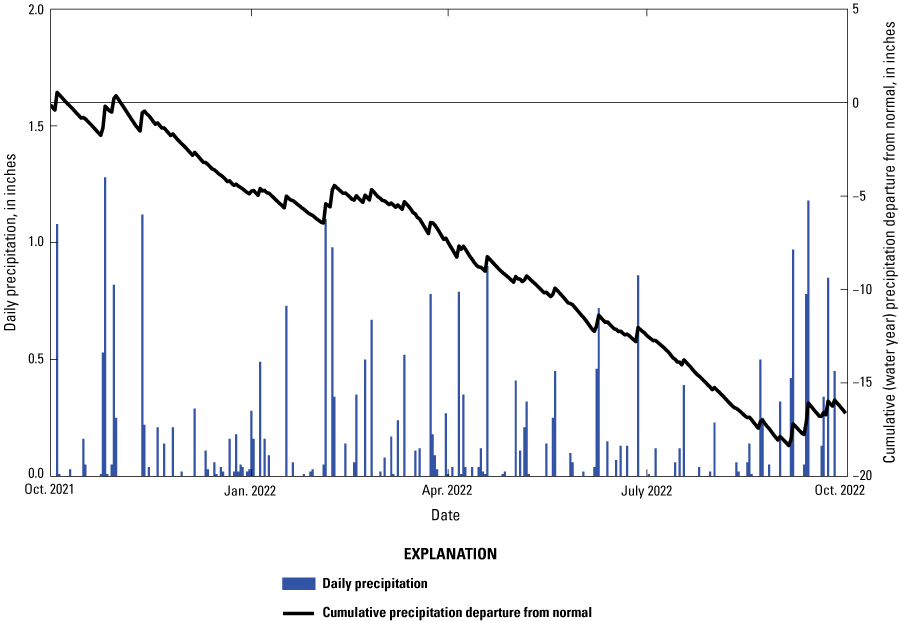
Graph showing total daily rainfall and cumulative precipitation departure from normal for October 1, 2021, through September 30, 2022, at the National Oceanic and Atmospheric Administration meteorological station at the Westerly State Airport (station USW00014794) in Rhode Island. Departure from normal is based on data from 1981 to 2010. Data are from National Oceanic and Atmospheric Administration (2022a).
During 2022, some locations in northern New England recorded above average precipitation, including Burlington, Vermont, which received 3.6 inches more precipitation than a typical April through September period (record from 1884 to 2022). Widespread rainfall in New England in late August and early September 2022 resulted in improvements to the precipitation deficits, with most areas receiving 1 to 5 inches above average rainfall for the month of September. However, parts of Cape Cod and northeastern Massachusetts did not receive notable rainfall in September (National Oceanic and Atmospheric Administration, 2022a).
U.S. Geological Survey Streamflow and Groundwater Level Monitoring Networks in New England
The 2022 hydrologic drought conditions were evaluated using 78 USGS streamgages and 126 USGS groundwater monitoring wells in New England. The 78 streamgages are relatively unaffected by water withdrawals, wastewater discharges, diversions, or dams and have continuous data for at least the past 30 years (April 1993 through September 2022; fig. 1; table 7.1). At USGS streamgages, the stage (stream height) of the river is typically measured at 5- to 15-minute intervals and is then transmitted by telemetry to the USGS for display on the web interface of the USGS National Water Information System (NWIS; U.S. Geological Survey, 2022). Continuous streamflow is computed based on the graphical relation between streamflow and concurrent stage measurements at each streamgage, referred to as a stage-discharge rating curve (Rantz and others, 1982). This rating curve allows for near real-time estimates of streamflow from the transmitted stage values. The rating curve for each streamgage is continually verified and updated with periodic direct measurements, following USGS procedures described in Rantz and others (1982), Sauer and Turnipseed (2010), and Turnipseed and Sauer (2010).
The 126 USGS groundwater monitoring wells used to assess the 2022 hydrologic drought in New England are included in the USGS Climate Response Network (CRN) and have at least 25 years of record (April 1998 through September 2022; fig. 1; table 7.2). Wells in the CRN network are minimally affected by pumping and other anthropogenic stresses (Cunningham and others, 2007). Although a minimum of 30 years of record is typically used for long-term averages, there are a limited number of wells with 30 years of record in New England. The monitoring wells evaluated for this report were completed in glacial sand and gravel or till deposits and are generally shallow-depth wells (9.6 to 110 feet); wells finished in bedrock were excluded from the study.
Of the 126 wells used in the analysis, 61 were physically measured periodically, generally once per month from the 20th day to the end of the month, based on USGS procedures described in Cunningham and Schalk (2011). The remaining 65 wells were monitored in real time, and the water level was recorded hourly or more frequently and transmitted by telemetry. The water level data at real-time monitored wells are verified and updated, as needed, with physical measurements every 2 to 3 months, based on USGS procedures described in Cunningham and Schalk (2011). Water level data for both the monthly measured and real time monitoring wells are available through NWIS (U.S. Geological Survey, 2022). For consistency between well types (monthly and real time), only one daily mean groundwater level was used to represent the month for a real-time monitored site. At the real-time monitored wells, the daily mean groundwater level on the median day the well had been measured before the well was made real time was used. This typically would be 1 day from the 20th day to the end of the month.
Data Analysis
Data analysis methods used in this study are similar to those used in Lombard and others (2020). Hydrologic drought conditions are characterized for streamflows by daily-streamflow percentiles computed from 7-day average streamflows, and for groundwater, as monthly groundwater-level percentiles. For this study, the 7-day average streamflow refers to the average streamflow during the past 7 days at a streamgage, and the average 7-day streamflow refers to the average of the 7-day average streamflows across multiple streamgages in a drainage basin or across New England. Percentiles for streamflows were calculated using 30 years of record (water years 1993 to 2022), and for groundwater levels, using 25 years of record (water years 1998 to 2022). The 25th to 75th percentiles indicate normal conditions, the 76th and greater percentiles are above normal, and the 24th and lower percentiles are below normal. The 10th or lower percentiles are much below normal. Percentiles were also averaged across drainage basins to highlight drought conditions spatially across New England (fig. 3).
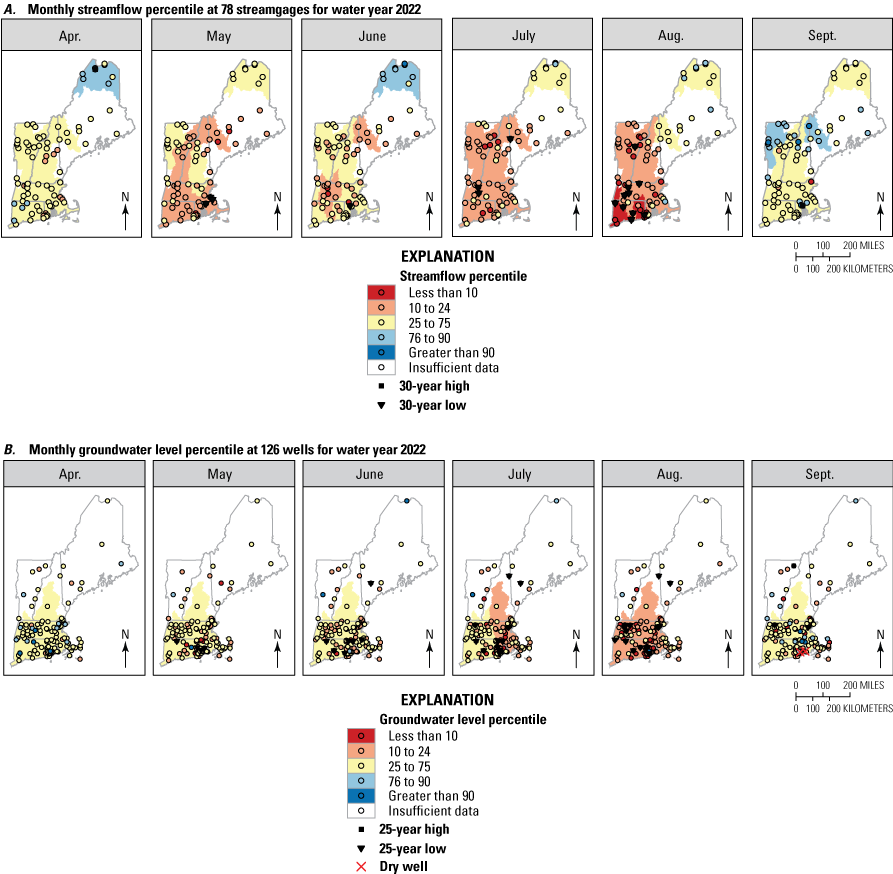
Maps showing percentiles of A, mean monthly streamflow at 78 U.S. Geological Survey streamgages and B, monthly groundwater levels at 126 U.S. Geological Survey observation wells in New England for April through September 2022 compared with the 30-year (1993–2022) and 25-year (1998–2022) conditions, respectively. Watersheds are based on the drainage basin six-digit hydrologic unit code boundaries from the National Hydrology Dataset Plus High Resolution (Moore and others, 2019); watersheds with four or more sites are shaded according to the mean percentile across those sites.
Hydrologic Drought of 2022
Streamflow Conditions
The New England-wide average 7-day flows at 78 streamgages fluctuated in the normal range (25th to 75th percentile) during winter 2021–22 and spring 2022, with a very brief period of below normal flows (less than 25th percentile) around the beginning of February and prolonged normal to above normal flows (>75th percentile) from the middle of February to the end of April. The average 7-day streamflows began to decline in late April and dropped below normal conditions from May 12 to 16, June 6 to 7, July 11 to 18, and August 1 to 20 (fig. 4). The lowest New England-wide average 7-day streamflow percentile for 2022 was on August 8 (18th percentile). Other notable low average 7-day streamflow percentiles were on May 14 (20th percentile) and July 14 (18th percentile). The last date of below normal average 7-day streamflows across New England was on August 20, after which streamflows continued to increase through the remainder of August and September (fig. 4).
The onset of the 2022 drought was earlier (mid-May) than the drought in 2020 (early June); however, New England-wide average 7-day streamflows did not reach the same level of dry conditions as experienced in the 2020 drought when the lowest New England-wide average 7-day streamflow was in the 6th percentile from September 23 through 28, 2020 (fig. 4; Lombard and others, 2020). Additionally, the 2020 drought had longer periods of below normal average 7-day streamflows compared with the 2022 drought. A potential reason that 2022 streamflows did not reach the lower and longer period of percentile levels as seen in 2020 (Lombard and others, 2020) is the spatial variability in the severity of the 2022 drought; sustained normal and above normal streamflows in northern Maine increased New England-wide averaged streamflow throughout the 2022 drought. September rainfalls resulted in most of New England recovering to normal to above normal streamflows (fig. 3A).
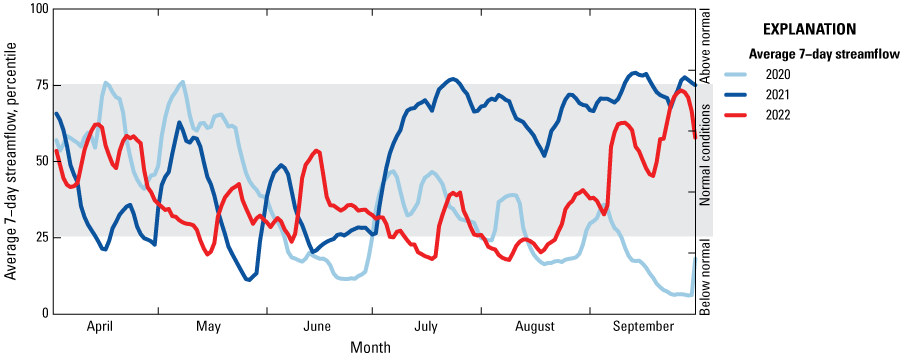
Graph showing the average 7-day streamflow percentile for 78 streamgages in New England from April 1 through September 30 in 2020 (drought conditions), 2021 (above normal conditions), and 2022 (drought conditions) compared with normal conditions (25th to 75th percentile) from water years 1993 to 2022 (area shaded in gray). The minimum average 7-day streamflow in 2022 was in the 18th percentile on August 8, and the maximum average 7-day streamflow in 2022 was in the 73rd percentile on September 26.
The drought in New England varied in severity over three general regions: southern New England (Connecticut, Massachusetts, and Rhode Island), central New England (southern and central Maine, New Hampshire, and Vermont), and northern Maine. Southern New England experienced widespread below normal flow conditions beginning in May, that continued into regionwide below normal flows in July and August when 9 of the 28 streamgages in Connecticut and Massachusetts recorded mean July or August 30-year record lows, with 2 of those 9 streamgages recording mean monthly lows in both July and August (fig. 3A). The 7-day average streamflow at Mill River at Northampton, Mass. (01171500) USGS streamgage reached its lowest values (4.0 ft3/s) on August 22, which is the lowest 7-day average value observed for any month during the past 30 years, including the 2020 drought (fig. 5A). In central New England, below normal conditions were most widespread in July and August when 2 of the 34 streamgages (Wild River at Gilead, Maine [01054200] USGS streamgage in July and East Orange Branch at East Orange, Vt. [01139800] USGS streamgage in August) experienced mean monthly record lows. In northern Maine, normal or above normal streamflow conditions were maintained throughout the study period. All streamgages across New England, except two streamgages in Massachusetts and one streamgage in Vermont, returned to normal or above normal streamflow conditions in September (fig. 3A). State-specific streamflow conditions are discussed briefly in appendixes 1 to 6.
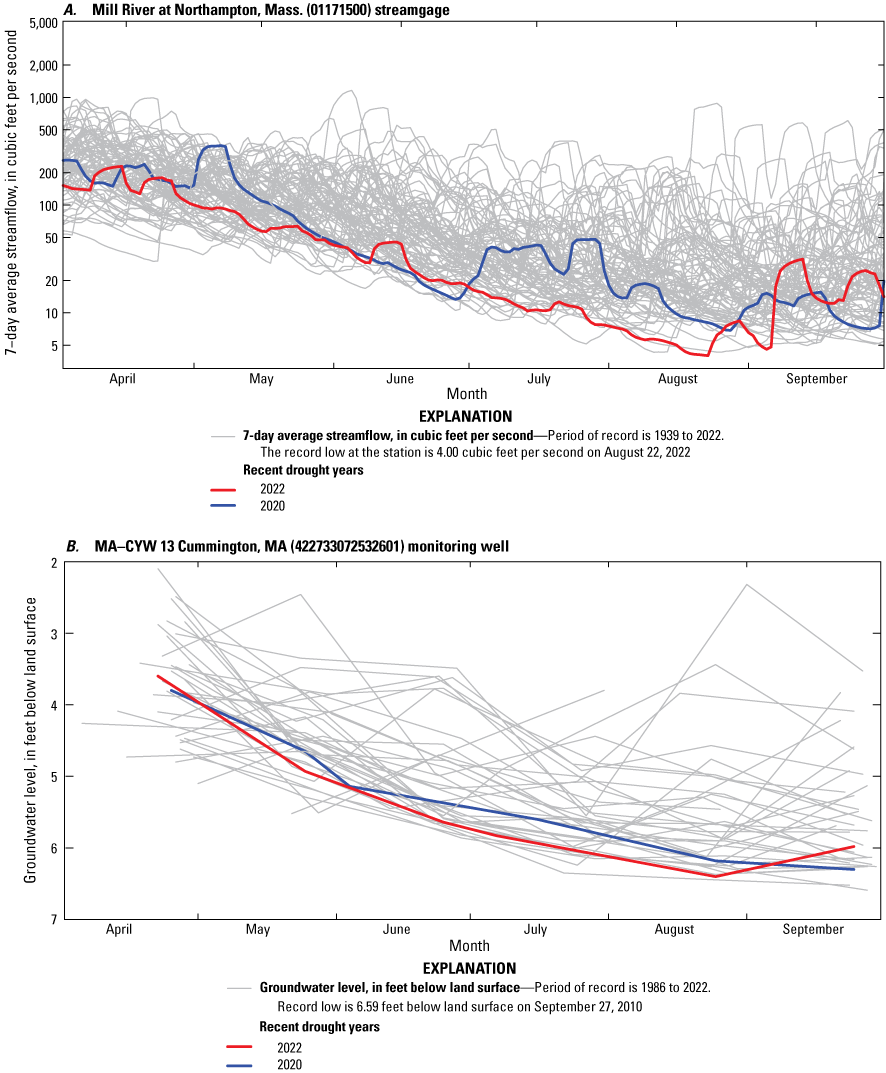
Graphs showing the A, moving average 7-day flows at the Mill River at Northampton, Mass. (01171500) U.S. Geological Survey (USGS) streamgage and B, monthly groundwater levels at the MA–CYW 13 Cummington, MA (422733072532601) USGS monitoring well for each April through September for their period of record.
Despite below normal flows observed at streamgages throughout parts of New England in 2022, only 3 of the 78 streamgages (with 30 to 120 years of record extending through September 2022) included in this study recorded the lowest 7-day average flows during the streamgage’s period of record. The Old Swamp River near South Weymouth, Mass. (01105600; period of record 1966 to 2022) USGS streamgage experienced a record 7-day average low flow on August 21; and the Mill River at Northampton, Mass. (01171500; period of record 1939 to 2022; fig. 5A) and Parker River at Byfield, Mass. (01101000; period of record 1946 to 2022) USGS streamgages experienced record 7-day average low flows on August 22. In contrast, 10 of the 78 streamgages experienced record 7-day average low flows in 2020, including two streamgages in Maine that have a period of record beginning in 1903 (USGS streamgages 01031500 and 01013500). The relative lack of streamgages that experienced record 7-day average low flows in 2022, in comparison to the 2020 drought, could be attributed to the timing of the two droughts. The drought in 2020 peaked in September, which is the month that typically experiences the lowest flows during the year (Lombard and others, 2020). The drought in 2022 peaked in August and generally returned to normal conditions in September across New England (figs. 4 and 5A).
Photograph of a low flow measurement section used at the Byram River at Pemberwick, Connecticut (01212500) U.S. Geological Survey streamgage on August 17, 2022; photograph by Maria Skarzynski, U.S. Geological Survey.
Groundwater Conditions
Parts of northern New England, including Maine and Vermont, experienced below normal groundwater levels in the beginning of water year 2022. Most of southern New England, however, experienced normal to above normal groundwater levels at the beginning of the water year into spring 2022. Groundwater levels in 2022, especially in southern New England, had an earlier onset of widespread below normal conditions (July) than in 2020 (August; fig. 3B; apps. 1 to 6; Lombard and others, 2020). In August, groundwater levels were most severely affected by drought conditions, with more than 75 percent of the monitoring wells (95 of 126) in New England indicating below normal conditions; 16 of these represented a 25-year low for August (fig. 3B). Unlike in 2020 when water levels continued to decline further below normal past the 2020 water year, water levels in 2022 showed substantial recovery in September, with 76 of 126 wells indicating normal or above normal conditions (fig. 3B).
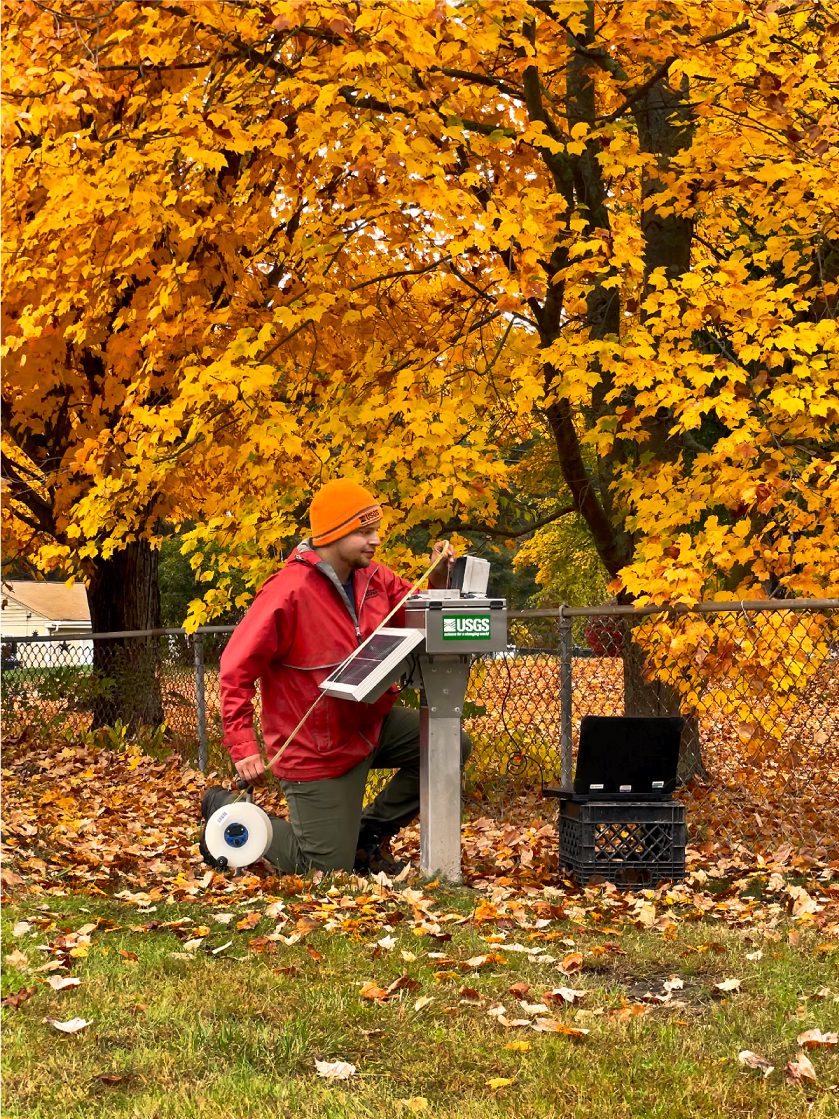
Photograph of a groundwater level measurement taken at the MA–HHW 1R Hardwick, MA (422058072085101) U.S. Geological Survey real-time monitoring well in Hardwick, Massachusetts, on October 17, 2022; photograph by Samuel Banas, U.S. Geological Survey.
Similar to streamflows, the severity of drought effects on groundwater levels in 2022 varied across New England. Water levels were more severely affected by below normal conditions in southern New England, in many cases declining below 2020 water levels in July and August (apps. 1 to 6). For example, the monthly water level at the MA–CYW 13 Cummington, Mass. (422733072532601) USGS monitoring well shows similar conditions in April and May in both 2020 and 2022, but the water level in 2022 declined below 2020 levels from June through August before recovering slightly in September (fig. 5B). In August 2022, the water level at 86 of 108 groundwater monitoring wells was below normal in the three States making up southern New England, with the water level at 14 of these wells representing the 25-year low for August (fig. 3B). In central and northern New England, groundwater levels were only marginally affected, with water levels generally not declining below 2020 conditions (apps. 1 to 6). Of the 18 monitoring wells in central New England and northern Maine, the groundwater level in August was below normal at 9 wells and represented the monthly 25-year low for August at 2 wells.
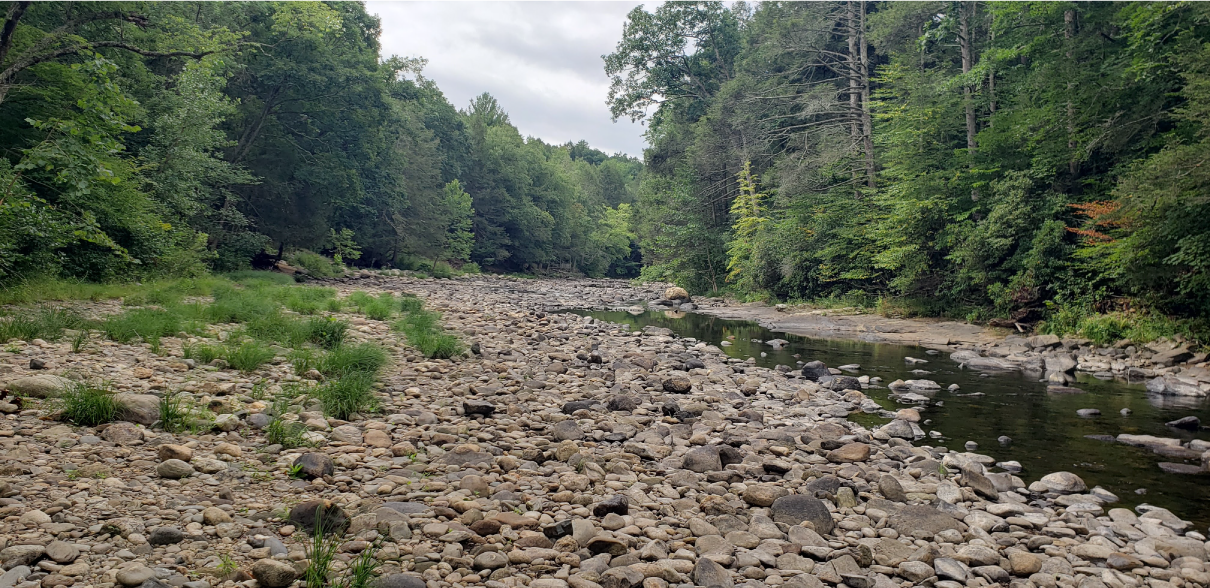
Photograph of low streamflow at the Salmon River near East Hampton, Connecticut (01193500) U.S. Geological Survey streamgage on August 10, 2022; photograph by Tabatha Lewis, U.S. Geological Survey.
Paired Streamflow and Groundwater Responses to Precipitation Deficits
Streamflows and groundwater levels at nearby sites are presented to compare their response to precipitation deficits (figs. 6 and 7). Notable water year precipitation deficits in the Hartford, Conn., area began as early as December 2021, and by August 2022, the Hartford area was nearly 10 inches below average (1981–2010) for the water year (fig. 6A; National Oceanic and Atmospheric Administration, 2022a). In April, streamflows at the Salmon River near East Hampton, Conn. (01193500) USGS streamgage and groundwater levels at the CT–MB 32 Marlborough, CT (413535072253701) USGS monitoring well indicated normal to above normal conditions, but by mid-August streamflows and water levels dropped well below normal conditions (fig. 6B). The Marlborough monitoring well recorded monthly 25-year low groundwater levels in June, July, and August. Flows at the Salmon River streamgage began to recover at the end of August because of increased precipitation. The water level at the monitoring well had a delayed response to the precipitation and only had started recovering slightly in September, remaining below normal at the end of September (fig. 6B).
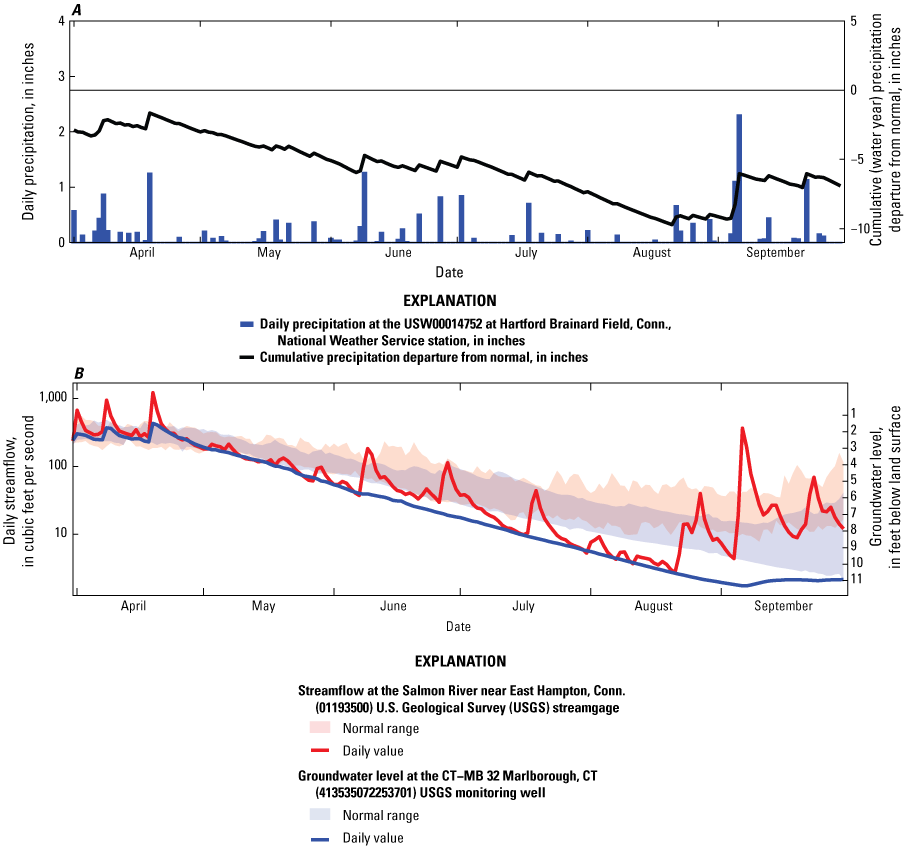
Graphs showing climatic and hydrologic conditions in central Connecticut from April through September 2022. A, Daily total precipitation at the USW00014752 at Hartford Brainard Field, Conn., National Weather Service station. B, Daily mean flow at the Salmon River near East Hampton, Conn. (01193500) U.S. Geological Survey (USGS) streamgage and daily mean groundwater level at the CT–MB 32 Marlborough, CT (413535072253701) USGS monitoring well. Shaded areas for streamflow and groundwater levels represent normal conditions, which are between the 25th and 75th percentiles, based on 30 years of data for streamflow (1993–2022) and 25 years for data for groundwater levels (1998–2022). Precipitation normal is based on averages of 30 years of data (1981–2010).
The precipitation deficit was even more substantial in the Boston area for water year 2022, with deficits during the study period exceeding 4 inches in April and declining to more than 14 inches below normal (1981–2010) by the end of September (fig. 7A; National Oceanic and Atmospheric Administration, 2022a). Streamflow at the Nashoba Brook near Acton, Mass. (01097300) USGS streamgage indicated normal or below normal conditions from April through June, with streamflow generally declining to well below normal conditions in July and August; fig. 7B). Water levels at the MA–ACW 158 Acton, MA (422812071244401) USGS monitoring well, however, started April in the upper range of normal conditions likely due to recharge from rainfall in the summer and early fall 2021. The groundwater level at the well in Acton dropped below normal levels in early July and stayed below normal levels through the end of September, whereas the streamflow at Nashoba Brook showed some improvement from rainfall in late August through September (fig. 7B).
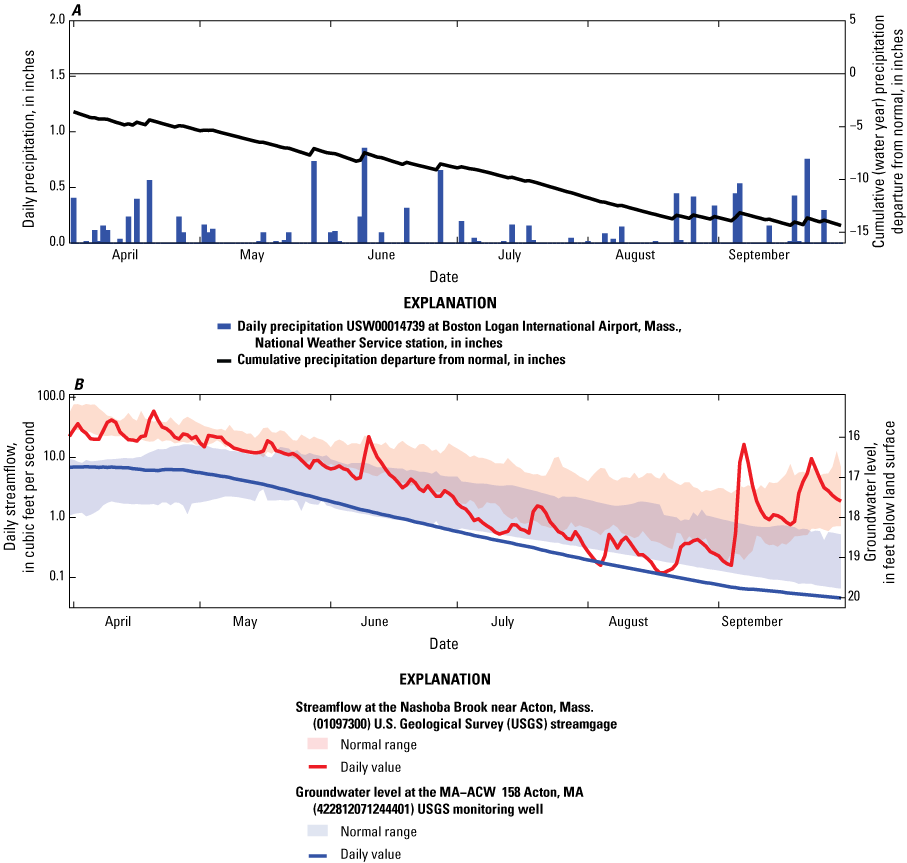
Graphs showing climatic and hydrologic conditions in the Acton, Massachusetts, area, from April through September 2022 for A, daily total precipitation at the USW00014739 at Boston Logan International Airport, Mass., National Weather Service station and B, daily mean flow at the Nashoba Brook near Acton, Mass. (01097300) U.S. Geological Survey (USGS) streamgage and daily mean groundwater levels at the MA−ACW 158 Acton, MA (422812071244401) USGS monitoring well. Shaded areas for streamflow and groundwater levels represent normal conditions, which are between the 25th and 75th percentiles, based on 30 years of data for streamflow (1993–2022) and 25 years for data for groundwater levels (1998–2022). Precipitation normal is based on averages of 30 years of data (1981–2010).
Comparison of Streamflow Statistics to Previous Droughts
Because of the differences in lengths, spatial extents, and types of droughts, it is challenging to put droughts into historical context. A streamgage recording a period of record low with 10 years of record has different implications than a streamgage recording a period of record low with 80 years of record. In an effort to compare droughts across the region during the past 30 years, the analysis computed for this study (table 1) indicated the months and years for which the annual 7-day average streamflow was a 30-year low (between 1993 and 2022) for at least 2 months at more than 10 percent of the 78 streamgages in New England. In 2021, all the 30-year lows happened in the three northern New England States, whereas in 2016, all the 30-year lows happened in the three southern New England States.
For 2016, more than 10 percent of the streamgages had 30-year lows from June to September (table 1); however, more than 20 percent of the streamgages had 30-year lows in July 2016 (all in southern New England). In 1995, 30-year lows were recorded in more than 10 percent of the 78 total streamgages in all States from June through September (table 1), and 30-year lows were recorded in more than 20 percent of the total 78 streamgages in June and July.
The data for 2022 are not included in table 1 because 30-year lows were not recorded at more than 10 percent of the 78 streamgages for the year for a 2-month period; however. more than 10 percent of the 78 streamgages recorded 30-year lows during the month of August in 2022, with these lows recorded in Connecticut, Massachusetts, and Vermont. This type of analysis does not include droughts such as the severe 1960s regional drought because it took place more than 30 years ago, nor does it quantify the compounded effects of multiyear droughts, such as for 1961–69 and 1998–2002 because this analysis is based only on annual 7-day average streamflows.
Table 1.
Drought periods in New England from 1993 to 2022 compiled from 7-day average streamflows that were 30-year lows for at least 2 months at more than 10 percent of the streamgages in New England.[Data are aggregated from the National Water Information System (U.S. Geological Survey, 2022)]
Photograph of the Ammonoosuc River in Bethlehem, New Hampshire (01137500) U.S. Geological Survey streamgage on October 3, 2022; photograph by Sean Stewart, U.S. Geological Survey.
Provisional Nature of the Data
Many of the data presented in this report are provisional and subject to revision following formal quality assurance review by the USGS, as indicated in NWIS (U.S. Geological Survey, 2022).
Summary
From April through September 2022, parts of New England experienced a hydrologic drought (below normal streamflow or groundwater levels); however, the drought was generally confined to May through August and was most prevalent in southern New England. Precipitation was below average for much of New England in April 2022 and continued to rapidly decline throughout the growing season. This resulted in below normal to much below normal streamflows and groundwater levels in southern New England, including Connecticut, Massachusetts, and Rhode Island. Parts of southern Maine, New Hampshire, and Vermont were moderately affected by below normal hydrologic conditions. The hydrologic drought was most severe in August, the month that recorded the greatest number of 30-year low streamflows and 25-year low groundwater levels. Many streamgages and groundwater monitoring wells returned to normal levels in September. The drought in 2022 recorded fewer period of record lows at streamgages than the drought in 2020, in part because of the timing of the drought; period of record lows often happen in September when many of the streamgages had already started to recover in 2022.
References Cited
Cunningham, W.L., Geiger, L.H., and Karavitis, G.A., 2007, U.S. Geological Survey ground-water climate response network: U.S. Geological Survey Fact Sheet 2007–3003, 4 p., accessed December 20, 2022, at https://doi.org/10.3133/fs20073003.
Cunningham, W.L., and Schalk, C.W., comps., 2011, Groundwater technical procedures of the U.S. Geological Survey: U.S. Geological Survey Techniques and Methods, book 1, chap. A1, 151 p., accessed December 20, 2022, at https://doi.org/10.3133/tm1A1.
Lombard, P.J., Barclay, J.R., and McCarthy, D.E., 2020, 2020 drought in New England (ver. 1.1, February 2021): U.S. Geological Survey Open-File Report 2020–1148, 12 p., accessed December 20, 2022, at https://doi.org/10.3133/ofr20201148.
Maine Geological Survey, 2022, Maine cooperative snow survey: Maine Geological Survey data, accessed November 17, 2022, at https://www.maine.gov/dacf/mgs/hazards/snow_survey/.
Mecray, E., and Borisoff, S., 2022, Quarterly climate impacts and outlook—Northeast region; September 2022: National Oceanic and Atmospheric Administration drought report, 3 p., accessed November 17, 2022, at http://www.nrcc.cornell.edu/services/reports/reports/2022-09.pdf.
Moore, R.B., McKay, L.D., Rea, A.H., Bondelid, T.R., Price, C.V., Dewald, T.G., and Johnston, C.M., 2019, User’s guide for the national hydrography dataset plus (NHDPlus) high resolution: U.S. Geological Survey Open-File Report 2019–1096, 66 p., accessed December 21, 2022, at https://doi.org/10.3133/ofr20191096.
National Drought Mitigation Center, 2022a, Current map: National Drought Mitigation Center U.S. Drought Monitor, accessed November 17, 2022, at https://droughtmonitor.unl.edu.
National Drought Mitigation Center, 2022b, State drought plans: National Drought Mitigation Center, accessed January 13, 2022, at https://drought.unl.edu/Planning/DroughtPlans/StatePlans.aspx.
National Drought Mitigation Center, 2022c, Types of drought: National Drought Mitigation Center web page, accessed January 13, 2022, at https://drought.unl.edu/Education/DroughtIn-depth/TypesofDrought.aspx.
National Oceanic and Atmospheric Administration, 2022a, Climate data online: National Oceanic and Atmospheric Administration National Centers for Environmental Information data, accessed on November 17, 2022, at https://www.ncei.noaa.gov/cdo-web/datasets#GHCND.
National Oceanic and Atmospheric Administration, 2022b, Drought status update for the northeast: National Oceanic and Atmospheric Administration National Integrated Drought Information System data, accessed November 16, 2022, at https://www.drought.gov/drought-status-updates/drought-status-update-northeast-8-26-22.
National Oceanic and Atmospheric Administration, 2022c, National temperature and precipitation maps—August 2022: National Oceanic and Atmospheric Administration National Integrated Drought Information System data, accessed November 16, 2022, at https://www.ncei.noaa.gov/access/monitoring/us-maps/1/202208.
National Oceanic and Atmospheric Administration, 2022d, National temperature and precipitation maps—May-July 2022: National Oceanic and Atmospheric Administration National Integrated Drought Information System data, accessed November 16, 2022, at https://www.ncei.noaa.gov/access/monitoring/us-maps/3/202207.
New Hampshire Department of Environmental Services, 2022, Real-time data & information for watersheds in New Hampshire: New Hampshire Department of Environmental Services data, accessed November 17, 2022, at https://www4.des.state.nh.us/rti_home.
Northeast Regional Climate Center, 2022, Potential evapotranspiration for selected locations: Northeast Regional Climate Center data, accessed November 16, 2022, at https://www.nrcc.cornell.edu/wxstation/pet/pet.html.
PRISM Climate Group, 2020, 30-year normal: PRISM Climate Group data, accessed November 15, 2022, at https://prism.oregonstate.edu/normals/.
Rantz, S.E., and others, 1982, Measurement of stage and discharge, v. I of Measurement and computation of streamflow: U.S. Geological Survey Water-Supply Paper 2175, 284 p. [Also available at https://doi.org/10.3133/wsp2175.]
Sauer, V.B., and Turnipseed, D.P., 2010, Stage measurements at gaging stations: U.S. Geological Survey Techniques and Methods, book 3, chap. A7, 45 p. [Also available at https://doi.org/10.3133/tm3A7.]
Soller, D.R., and Reheis, M.C., comps., 2004, Surficial materials in the conterminous United States: U.S. Geological Survey Open-File Report 03–275, scale 1:5,000,000, accessed January 13, 2023, at https://doi.org/10.3133/ofr2003275.
Svoboda, M., LeComte, D., Hayes, M., Heim, R., Gleason, K., Angel, J., Rippey, B., Tinker, R., Paleki, M., Stooksbury, D., Miskus, D., and Stephens, S., 2002, The drought monitor: Bulletin of the American Meteorological Society, v. 83, no. 8, p., 1181–1190, accessed December 21, 2022, at https://www.jstor.org/stable/26215387.
Turnipseed, D.P., and Sauer, V.B., 2010, Discharge measurements at gaging stations: U.S. Geological Survey Techniques and Methods, book 3, chap. A8, 87 p. [Also available at https://doi.org/10.3133/tm3A8.]
U.S. Geological Survey, 2022, USGS water data for the nation: U.S. Geological Survey National Water Information System database, accessed October 10, 2022, at https://doi.org/10.5066/F7P55KJN.
U.S. Geological Survey, 2023, USGS national map: U.S. Geological Survey National Map interactive map viewer, accessed January 13, 2023, at https://maps.usgs.gov/map/.
Appendix 1. Drought in Connecticut in 2022
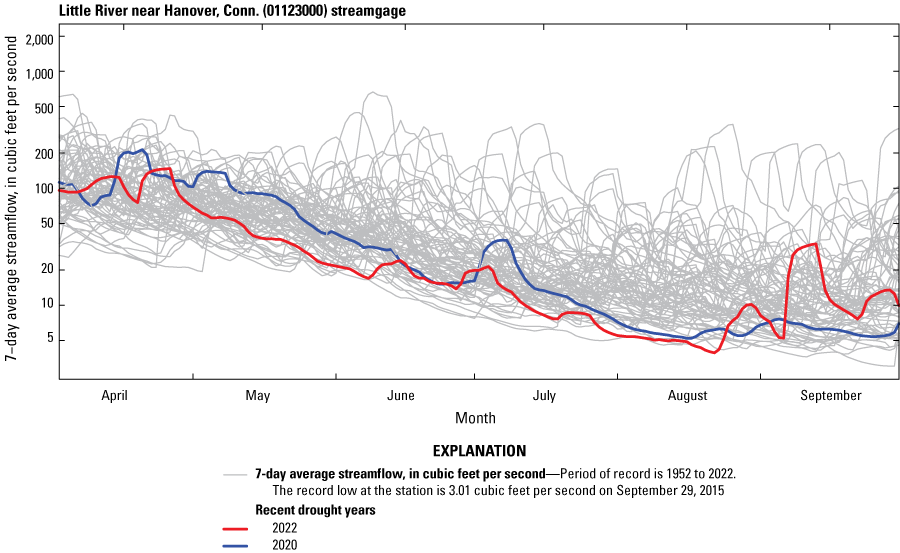
Graph showing the moving average 7-day flows at the Little River near Hanover, Conn. (01123000) U.S. Geological streamgage for April through September for the streamgage period of record.
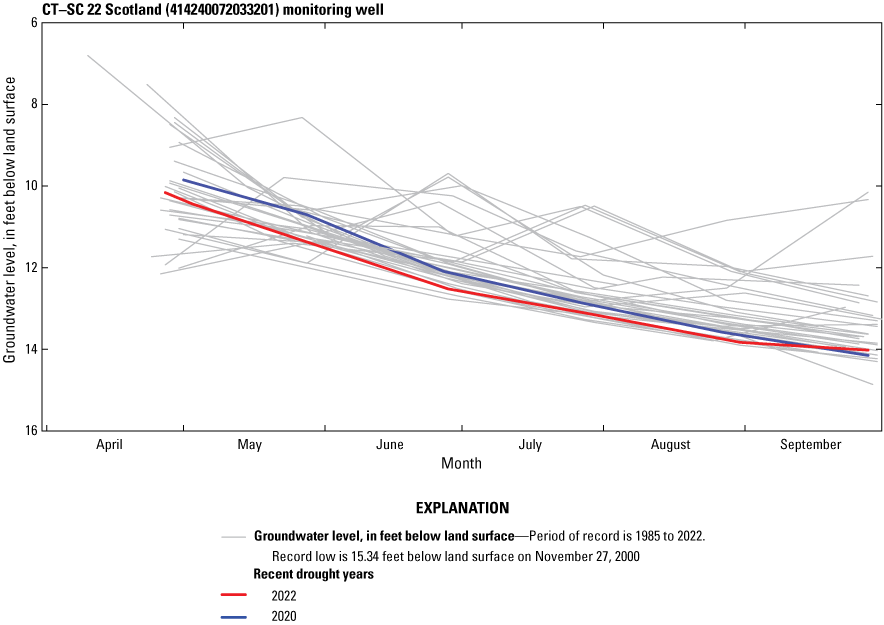
Graph showing monthly groundwater levels at the CT–SC 22 Scotland (414240072033201) monitoring well in Scotland, Conn., for April through September for the well’s period of record.
Appendix 2. Drought in Maine in 2022
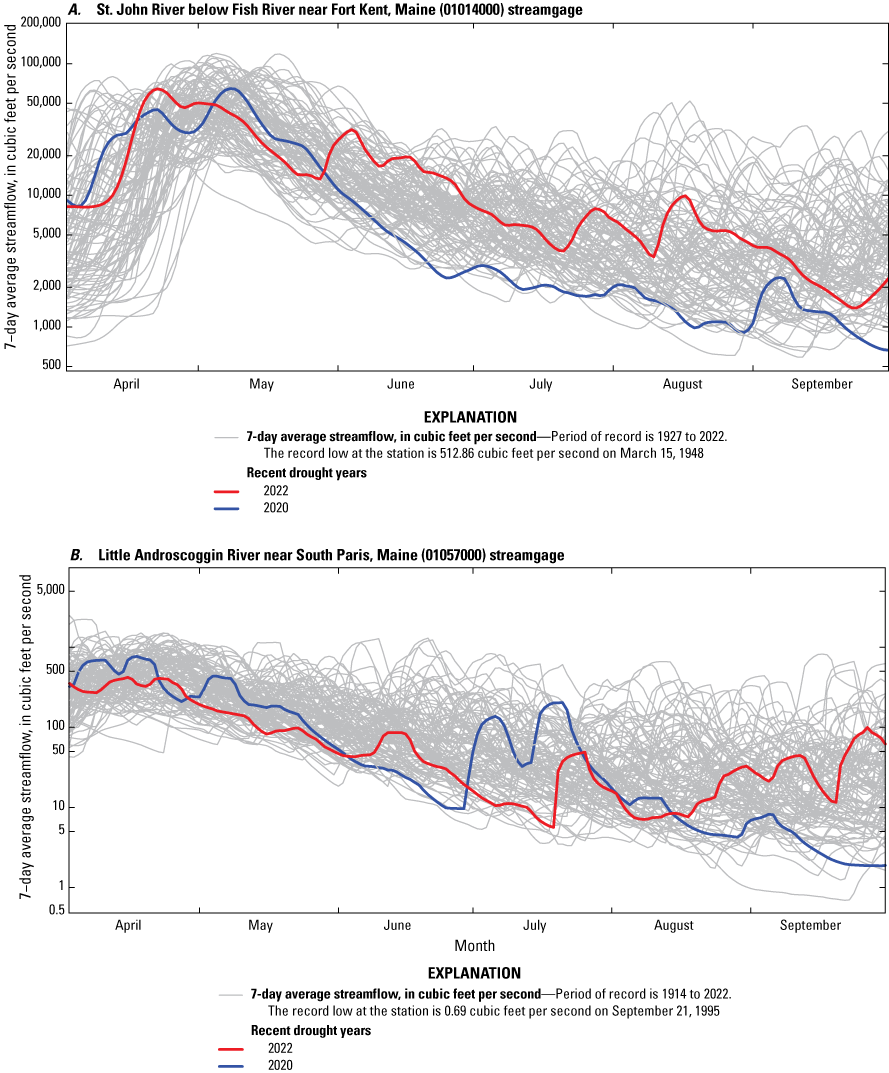
Graphs showing the moving average 7-day flows at the A, St. John River below Fish River near Fort Kent, Maine (01014000) and B, Little Androscoggin River near South Paris, Maine (01057000) U.S. Geological Survey streamgages for April through September for their periods of record.
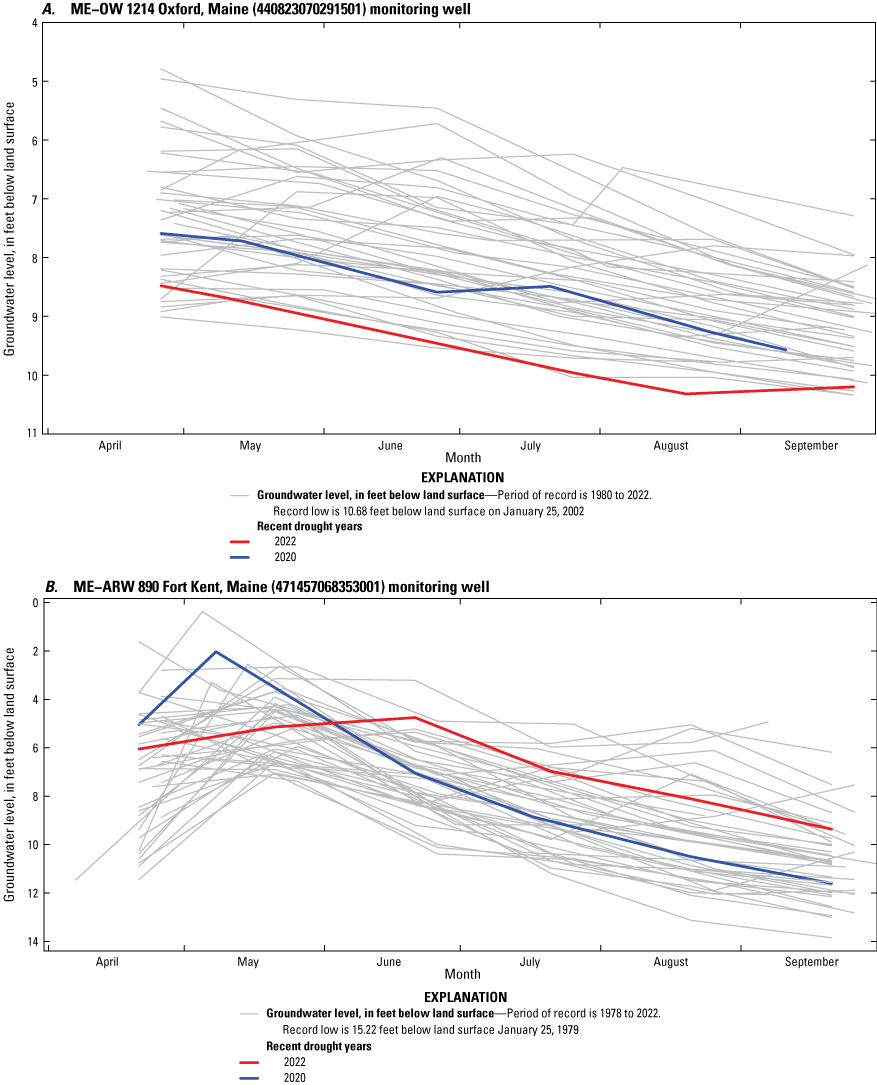
Graphs showing monthly groundwater levels at the A, ME–OW 1214 Oxford, Maine (440823070291501) and B, ME–ARW 890 Fort Kent, Maine (471457068353001) monitoring wells for April through September for their periods of record.
Appendix 3. Drought in Massachusetts in 2022
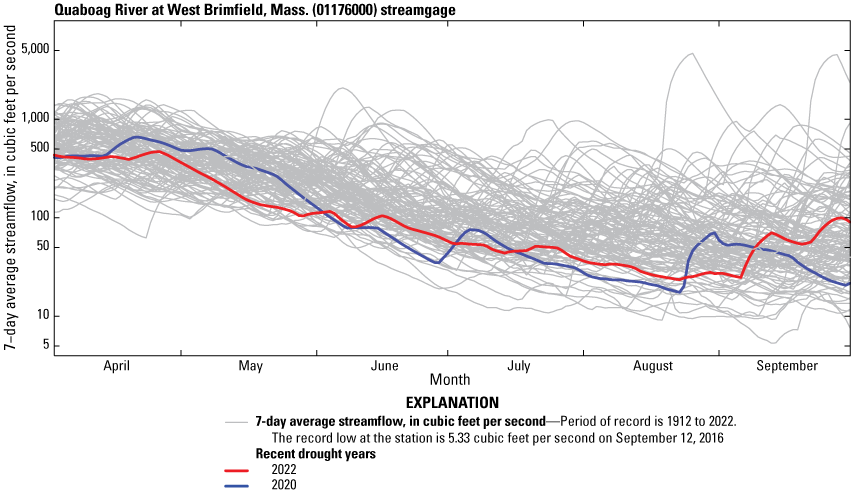
Graph showing the moving average 7-day flows at the Quaboag River at West Brimfield, Mass. (01176000) U.S. Geological Survey streamgage for April through September for the streamgage period of record.
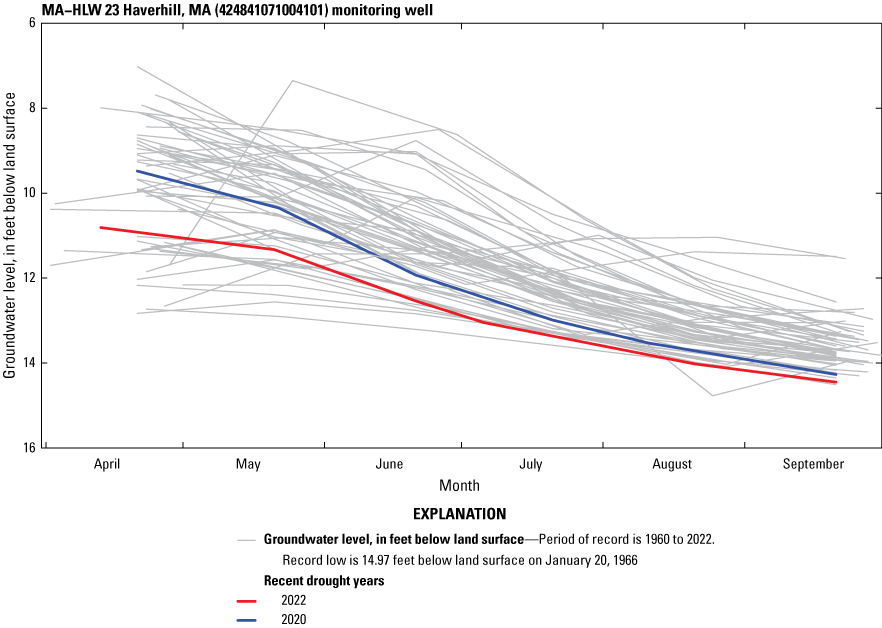
Graph showing monthly groundwater levels at the MA–HLW 23 Haverhill, MA (424841071004101) U.S. Geological Survey monitoring well for April through September for the well’s period of record.
Appendix 4. Drought in New Hampshire in 2022
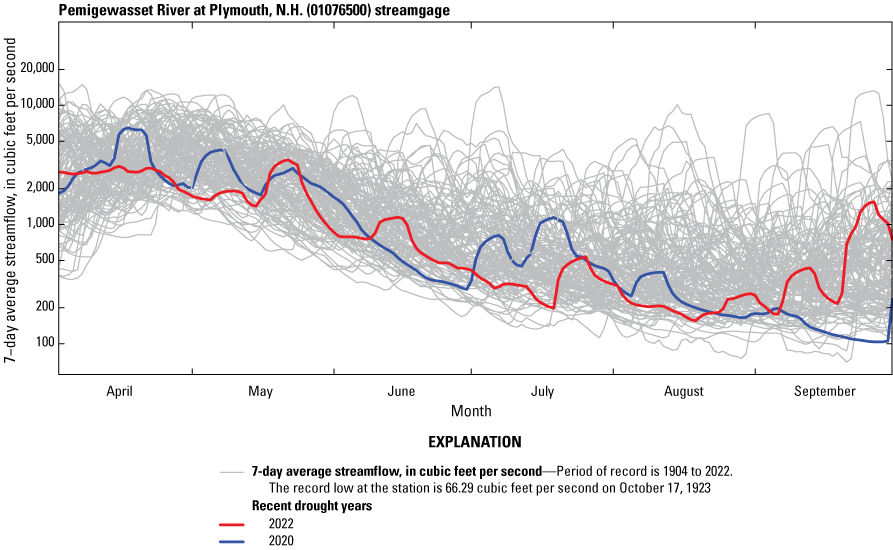
Graph showing the moving average 7-day flows at the Pemigewasset River at Plymouth, N.H. (01076500) U.S. Geological Survey streamgage for April through September for the streamgage period of record.
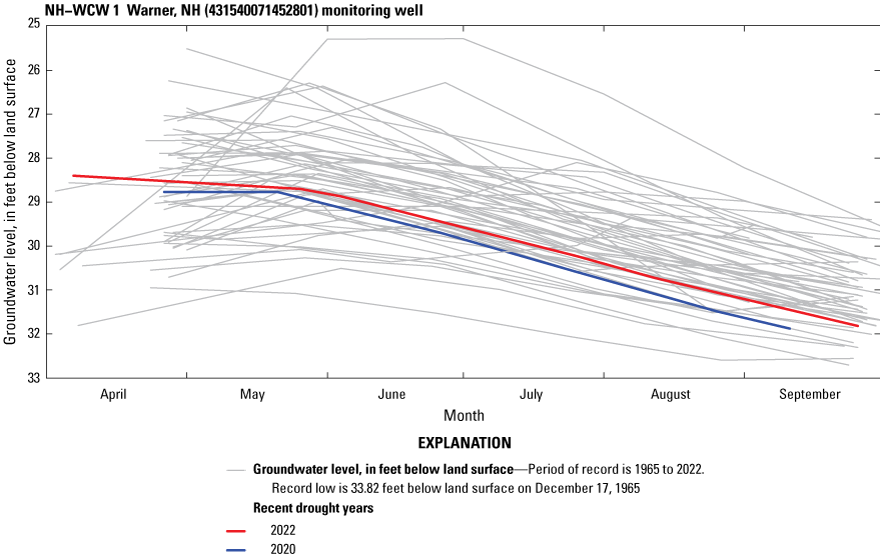
Graph showing monthly groundwater levels at the NH–WCW 1 Warner, NH (431540071452801) U.S. Geological Survey monitoring well for April through September for the well’s period of record.
Appendix 5. Drought in Rhode Island in 2022
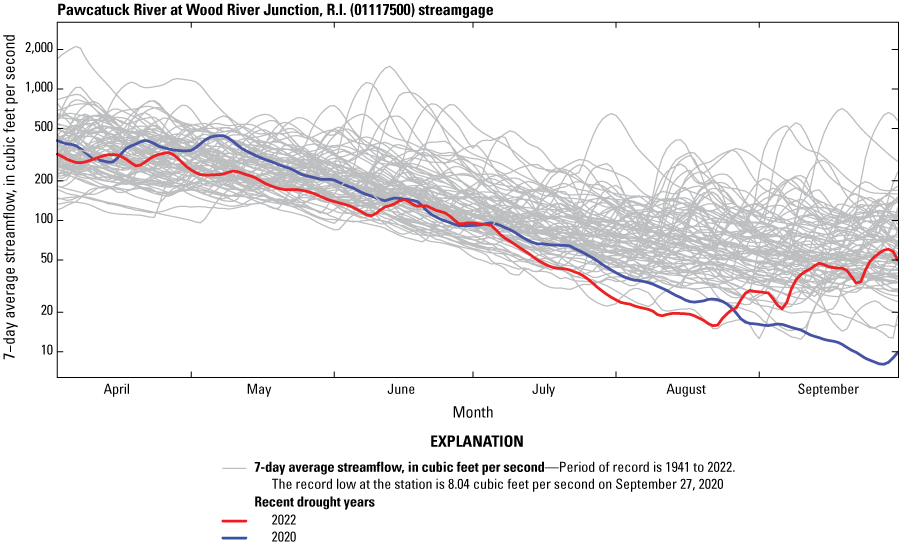
Graph showing the moving average 7-day flows at the Pawcatuck River at Wood River Junction, R.I. (01117500) U.S. Geological Survey streamgage for April through September for the streamgage period of record.
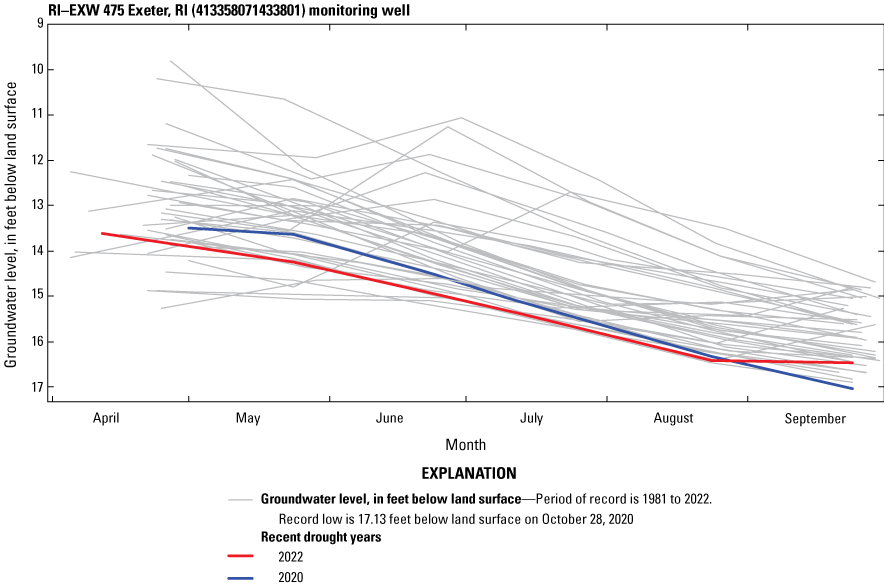
Graph showing monthly groundwater levels at the RI–EXW 475 Exeter, RI (413358071433801) U.S. Geological Survey monitoring well for April through September for the well’s period of record.
Appendix 6. Drought in Vermont in 2022
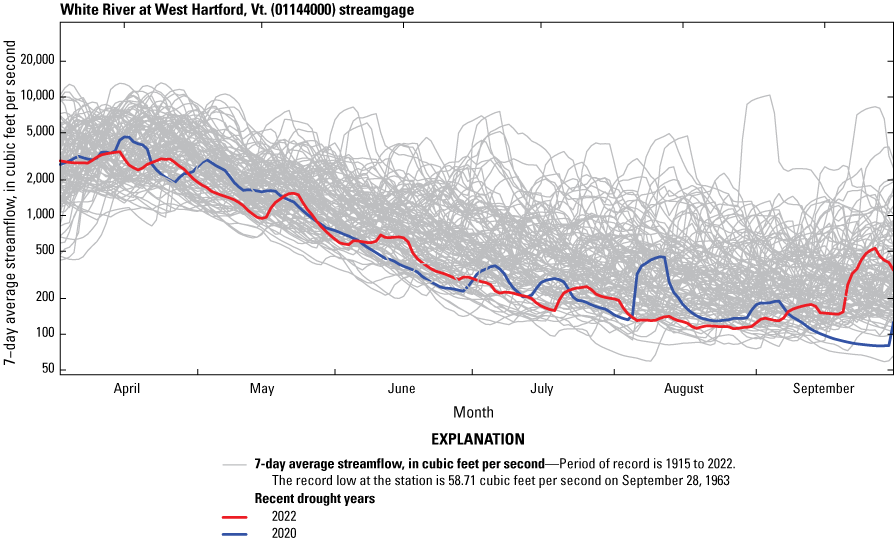
Graph showing the moving average 7-day flows at the White River at West Hartford, Vt. (01144000) U.S. Geological Survey streamgage for April through September for the streamgage period of record.
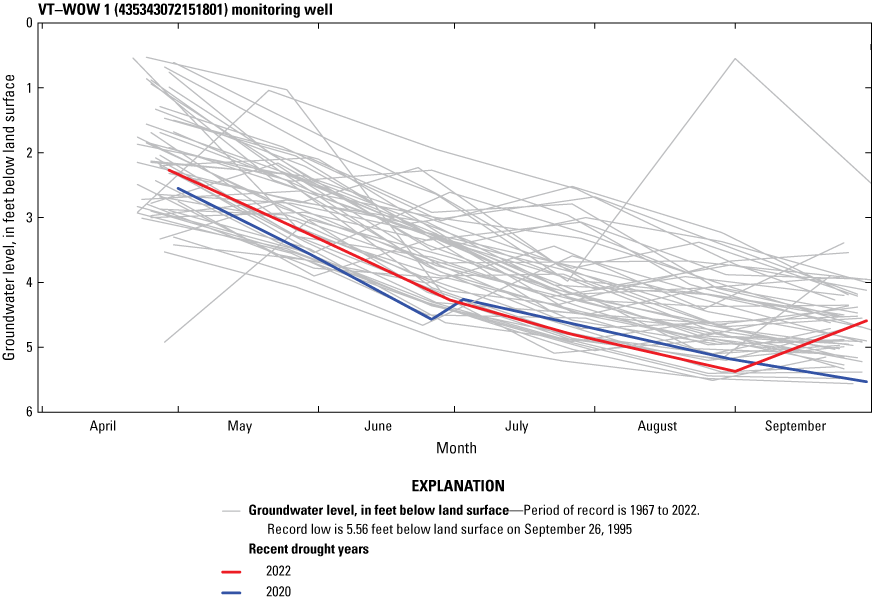
Graph showing monthly groundwater levels at the VT–WOW 1 (435343072151801) U.S. Geological Survey monitoring well in West Fairlee, Vermont, for April through September for the well’s period of record.
Appendix 7. Streamgages and Groundwater Monitoring Stations in New England
Table 7.1.
Streamgages used in a drought analysis for New England in 2022.[Data are from the National Water Information System (U.S. Geological Survey, 2022), unless otherwise indicated. USGS, U.S. Geological Survey; HUC6, drainage basin six-digit hydrologic code from the National Hydrology Dataset Plus High Resolution (Moore and others, 2019)]
Table 7.2.
Groundwater monitoring stations used in a drought analysis for New England in 2022.[Data are from the National Water Information System (U.S. Geological Survey, 2022), unless otherwise indicated. USGS, U.S. Geological Survey; HUC6, drainage basin six-digit hydrologic code from the National Hydrology Dataset Plus High Resolution (Moore and others, 2019)]
References Cited
Moore, R.B., McKay, L.D., Rea, A.H., Bondelid, T.R., Price, C.V., Dewald, T.G., and Johnston, C.M., 2019, User’s guide for the national hydrography dataset plus (NHDPlus) high resolution: U.S. Geological Survey Open-File Report 2019–1096, 66 p., accessed December 21, 2022, at https://doi.org/10.3133/ofr20191096.
U.S. Geological Survey, 2022, USGS water data for the nation: U.S. Geological Survey National Water Information System database, accessed October 10, 2022, at https://doi.org/10.5066/F7P55KJN.
Conversion Factors
Datums
Vertical coordinate information is referenced to the North American Vertical Datum of 1988 (NAVD 88).
Horizontal coordinate information is referenced to the North American Datum of 1983 (NAD 83).
Elevation, as used in this report, refers to distance above the vertical datum.
Supplemental Information
A water year is the 12-month period beginning October 1 and ending September 30. It is designated by the calendar year in which it ends.
Normal, as used in this report, approximates the statistical average or norm.
Director, New England Water Science Center
U.S. Geological Survey
10 Bearfoot Road
Northborough, MA 01532
dc_nweng@usgs.gov
or visit our website at
https://www.usgs.gov/centers/new-england-water
Publishing support provided by the Pembroke Publishing Service Center
Disclaimers
Any use of trade, firm, or product names is for descriptive purposes only and does not imply endorsement by the U.S. Government.
Although this information product, for the most part, is in the public domain, it also may contain copyrighted materials as noted in the text. Permission to reproduce copyrighted items must be secured from the copyright owner.
Suggested Citation
McCarthy, D.E., LeNoir, J.M., and Lombard, P.J., 2023, 2022 drought in New England: U.S. Geological Survey Scientific Investigations Report 2023–5016, 34 p., https://doi.org/10.3133/sir20235016.
ISSN: 2328-0328 (online)
Study Area
| Publication type | Report |
|---|---|
| Publication Subtype | USGS Numbered Series |
| Title | 2022 drought in New England |
| Series title | Scientific Investigations Report |
| Series number | 2023-5016 |
| DOI | 10.3133/sir20235016 |
| Publication Date | March 08, 2023 |
| Year Published | 2023 |
| Language | English |
| Publisher | U.S. Geological Survey |
| Publisher location | Reston, VA |
| Contributing office(s) | New England Water Science Center |
| Description | Report: vii, 34 p.; 6 Appendixes; 2 Tables; Dataset |
| Country | United States |
| State | Connecticut, Maine, Massachusetts, New Hampshire, Rhode Island, Vermont |
| Online Only (Y/N) | Y |
| Additional Online Files (Y/N) | Y |