

Long-Term Water-Quality Constituent Trends in the Little Arkansas River, South-Central Kansas, 1995–2021
Links
- Document: Report (5.5 MB pdf) , HTML , XML
- Tables:
- Table 2.1 (20 KB xlsx) - Summary statistics for continuously (hourly) measured turbidity data measured with different sensors at the Little Arkansas River at Highway 50 near Halstead, Kansas; Little Arkansas River near Sedgwick, Kans.; and Little Arkansas River upstream of ASR Facility near Sedgwick, Kans., 2004–19
- Table 2.1 (2.2 KB csv)
- Table 3.1 (27 KB xlsx) - Relative percentage differences for discrete replicate pairs and detection percentages for blank discrete water-quality samples for the Little Arkansas River sites near Sedgwick, Kansas, 1995–2021
- Table 3.1 (6.3 KB csv)
- Tables 7.1–7.3 (108 KB xlsx)
- Table 7.1 (12 KB csv) - Weighted Regressions on Time, Discharge, and Season estimated mean, flow-normalized, and generalized mean concentrations for primary ions at the Little Arkansas River at Highway 50 near Halstead, Kansas, and Little Arkansas River near Sedgwick, Kans., 1995–2021
- Table 7.2 (10 KB csv) - Weighted Regressions on Time, Discharge, and Season estimated mean, flow-normalized, and generalized mean concentrations for nutrients and carbon species at the Little Arkansas River at Highway 50 near Halstead, Kansas, and Little Arkansas River near Sedgwick, Kans., 1995–2021
- Table 7.3 (8 KB csv) - Weighted Regressions on Time, Discharge, and Season estimated mean, flow-normalized, and generalized mean concentrations or densities for sediment, indicator bacteria, and trace elements at the Little Arkansas River at Highway 50 near Halstead, Kansas, and Little Arkansas River near Sedgwick, Kans., 1995–2021
- Tables 8.1–8.3 (112 KB xlsx)
- Table 8.1 (12 KB csv) - Weighted Regressions on Time, Discharge, and Season estimated mean, flow-normalized, and generalized mean fluxes for primary ions at the Little Arkansas River at Highway 50 near Halstead, Kansas, and Little Arkansas River near Sedgwick, Kans., 1995–2021
- Table 8.2 (10 KB csv) - Weighted Regressions on Time, Discharge, and Season estimated mean, flow-normalized, and generalized mean fluxes for nutrients and carbon species at the Little Arkansas River at Highway 50 near Halstead, Kansas, and Little Arkansas River near Sedgwick, Kans., 1995–2021
- Table 8.3 (9 KB csv) - Weighted Regressions on Time, Discharge, and Season estimated mean, flow-normalized, and generalized mean fluxes for sediment, indicator bacteria, and trace elements at the Little Arkansas River at Highway 50 near Halstead, Kansas, and Little Arkansas River near Sedgwick, Kans., 1995–2021
- Table 11.1 (51 KB xlsx) - Weighted Regressions on Time, Discharge, and Season estimated yearly water-quality constituent loads at the Little Arkansas River at Highway 50 near Halstead, Kansas and near Sedgwick, Kans., 1998–2021
- Table 11.1 (14 KB csv)
- Figure: Figure 1.1 (2.7 MB pdf) - Relations between turbidity sensors, 2004–19. A, YSI 6026 (YSI6026) and YSI 6136 (YSI6136) at the Little Arkansas River at Highway 50 near Halstead, Kansas
- Appendixes:
- Appendix 4 (1.1 MB zip) - Surrogate Regression Model Archive Summaries for the Little Arkansas River at Highway 50 near Halstead, Kansas
- Appendix 5 (2.7 MB zip) - Surrogate Regression Model Archive Summaries for the Little Arkansas River near Sedgwick, Kansas
- Appendix 6 (2.6 MB zip) - Surrogate Regression Model Archive Summaries for the Little Arkansas River upstream of ASR Facility near Sedgwick, Kansas
- Appendix 9 (35 MB zip) - Weighted Regressions on Time, Discharge, and Season Graphical Output at station 07143672
- Appendix 10 (46 MB zip) - Weighted Regressions on Time, Discharge, and Season Graphical Output at station 07144100
- Dataset: USGS National Water Information System database —USGS water data for the Nation
- NGMDB Index Page: National Geologic Map Database Index Page (html)
- Download citation as: RIS | Dublin Core
Acknowledgments
The authors thank Shawn Maloney and Scott Macey of the city of Wichita for technical assistance and providing information about the Equus Beds aquifer storage and recovery project. The authors appreciate the assistance of Vernon Strasser and the laboratory staff at the city of Wichita Municipal Water and Wastewater Laboratory for providing a substantial proportion of the chemical analyses used for model development.
The authors thank the U.S. Geological Survey staff that assisted with data collection, analysis, and interpretation, including Trudy Bennett, John Rosendale, David Eason, and Diana Restrepo-Osorio. The authors also thank U.S. Geological Survey technical reviewers Kyle Juracek, Luis Garcia, and Brent Hall.
Abstract
The Equus Beds aquifer and Cheney Reservoir are primary sources for the city of Wichita’s current (2023) water supply. The Equus Beds aquifer storage and recovery (ASR) project was developed by the city of Wichita in the early 1990s to meet future water demands using the Little Arkansas River as an artificial aquifer recharge water source during above-base-flow conditions. Little Arkansas River water is removed from the river at an ASR Facility intake structure, treated using National Primary Drinking Water Regulations as a guideline, and is infiltrated into the Equus Beds aquifer through recharge basins or injected into the aquifer through recharge wells for later use. The U.S. Geological Survey, in cooperation with the city of Wichita, completed this study to quantify and characterize Little Arkansas River water-quality data. Data in this report can be used to evaluate changing conditions, provide science-based information for decision making, and help meet regulatory requirements.
Continuous (hourly) physicochemical properties were measured, and discrete water-quality samples were collected from three Little Arkansas River sites located along the easternmost extent of the Equus Beds aquifer during 1995 through 2021 over a range of streamflow conditions. The Little Arkansas River at Highway 50 near Halstead, Kansas, streamgage (U.S. Geological Survey station 07143672; hereafter referred to as the “Highway 50 site”) is located upstream from the other two sites, and the Little Arkansas River near Sedgwick, Kans., streamgage (U.S. Geological Survey station 07144100; hereafter referred to as the “Sedgwick site”) is located downstream from the other two sites; these two sites bracket most of the easternmost part of the Equus Beds aquifer. The Little Arkansas River upstream of ASR Facility near Sedgwick, Kans., streamgage (U.S. Geological Survey station 375350097262800; hereafter referred to as the “Upstream ASR site”) is located between the Highway 50 and Sedgwick sites, about 14.7 river miles (mi) downstream from the Highway 50 site, about 1.7 river mi upstream from the Sedgwick site, and immediately upstream from the ASR Facility intake structure. Surrogate models for water-quality constituents of interest (including bromide, dissolved organic carbon, 2-chloro-4-isopropylamino-6-amino-s-triazine [deethylatrazine], atrazine, and metolachlor) were updated or developed using continuously measured and concomitant discrete data. These surrogate models, along with previously developed regression models, were used to compute concentrations (at the Highway 50, Sedgwick, and Upstream ASR sites) and loads (at the Highway 50 and Sedgwick sites) during the study period. Federal criteria were used to evaluate water quality. Where applicable, water-quality data were compared to Federal national drinking-water regulations. Flow-normalized water-quality constituent trends were evaluated using Weighted Regressions on Time, Discharge, and Season (WRTDS) statistical models and water-quality trends were described using WRTDS bootstrap tests.
Continuously computed primary ion concentrations were generally larger at the Highway 50 site compared to the Sedgwick site. During the study period, the Federal secondary maximum contaminant level (SMCL) for dissolved solids was exceeded 57 percent of the time at the Highway 50 site and 38 percent of the time at the Sedgwick site. Computed bromide concentrations were larger at the Highway 50 site and exceeded the city of Wichita treatment threshold about 70, 21, and 19 percent of the time at the Highway 50, Sedgwick, and Upstream ASR sites, respectively. Chloride concentrations exceeded the Federal SMCL about 16 percent of the time at the Highway 50 site and did not exceed the SMCL at the Sedgwick site. Continuous arsenic concentrations exceeded the Federal Maximum Contaminant Level (MCL) 9 to 15 percent of the time at the Sedgwick and Highway 50 sites, respectively, during the study. Atrazine concentrations exceeded the Federal MCL 10 percent of the time at the Highway 50 and Sedgwick sites and 14 percent of the time at the Upstream ASR site during the study; computed glyphosate concentrations at the Sedgwick site never exceeded the MCL during the study.
Little Arkansas River flow-normalized primary ion concentrations during 1995 through 2021 generally had downward trends and decreases were generally larger at the Highway 50 site compared to the Sedgwick site. Dissolved solids and chloride concentrations decreased at the Highway 50 and Sedgwick sites. Bromide had no trend at the Highway 50 site and a downward trend at the Sedgwick site. Nitrate plus nitrite and total phosphorus concentrations had upward trends at the Highway 50 site but downward trends at the Sedgwick site, whereas total organic carbon had upward trends at both sites. Nitrate plus nitrite, total nitrogen, total phosphorus, and total organic carbon fluxes had upward trends at the Highway 50 and Sedgwick sites. Suspended-sediment concentrations had an upward trend at the Highway 50 site and had no trend at the Sedgwick site. Arsenic concentrations had downward trends at the Highway 50 and Sedgwick sites.
About one-quarter to one-half of the Little Arkansas River loads, including nutrients and sediment, were transported during 1 percent of the time during the study. Because streamflows are highly sensitive to climatic variation and an increase of extreme precipitation events in the Great Plains is expected, similar disproportionately large pollutant loading events may increase into the future. Continuous measurement of physicochemical properties in near-real time allowed characterization of Little Arkansas River surface water during conditions and time scales that would not have been possible otherwise and served as a complement to discrete water-quality sampling. Continuation of this water-quality monitoring will provide data to characterize changing conditions in the Little Arkansas River and possibly identify new and changing trends. Information in this report allows the city of Wichita to make informed municipal water-supply decisions using past and present water-quality conditions and trends in the watershed.
Introduction
Wichita, in south-central Kansas, is the largest city in the State of Kansas and has a population of about 395,700 (U.S. Census Bureau, 2021). The Equus Beds aquifer Wichita well field, constructed in the 1950s, and Cheney Reservoir (fig. 1), constructed in the 1960s, are primary sources for the city of Wichita’s current (2023) water supply. An Integrated Local Water Supply Plan was developed by the city of Wichita’s Water Utilities Department to address expected water demands through 2050, primarily by artificial recharge of the Equus Beds aquifer (City of Wichita, 1993). The Equus Beds aquifer storage and recovery (ASR) project diverts water from the Little Arkansas River during above-base-flow conditions, treats it using National Primary Drinking Water Regulations (U.S. Environmental Protection Agency, 2009) as a guideline, and either injects it or recharges it through spreading basins into the Equus Beds aquifer for later use to ensure that the city can meet water demand during an extended drought.
The U.S. Geological Survey (USGS), in cooperation with the city of Wichita, completed this study of the Little Arkansas River, which is source water for the Equus Beds ASR project, to quantify and characterize Little Arkansas River water-quality conditions. Long-term Little Arkansas River water-quality data were collected from 1995 through 2021 to complete this study objective. Numerous studies summarizing Little Arkansas River water quality have been completed, including Tappa and others (2015), Stone and others (2016), Rasmussen and others (2016), Stone and others (2019), and Stone and Klager (2022).
Location of the study area near Wichita, south-central Kansas.
Equus Beds Aquifer Storage and Recovery Project
The city of Wichita, Kansas, uses the Equus Beds aquifer as a primary municipal water-supply source. Equus Beds aquifer water levels have decreased substantially (Hansen and others, 2014; Whisnant and others, 2015; Klager, 2016) because historically, irrigator, industrial, and municipal pumpage volume exceeded the natural aquifer recharge rate. The Wichita well field is susceptible to saltwater (including chloride) contamination from the Arkansas River and intrusion from existing upgradient plumes near Burrton, Kansas, caused by oil field evaporation pits remaining from the 1930s (Whittemore, 2007; Klager and others, 2014). The Equus Beds ASR project was created by the city of Wichita to help meet future water demands.
The Equus Beds ASR project currently (2023) consists of two coexisting phases:
-
1. Phase I began in 2007 and has the capacity to capture 10 million gallons per day (Mgal/d) of Little Arkansas River water and indirect streambank-diversion well water for recharge activity with water injection in four wells and two recharge basins. Directly diverted stream water is treated using membrane filtration and advanced oxidation to reduce sediment and remove organic material before being recharged through the two recharge basins; streambank-diversion well pumped water is not treated further before recharge through the injection wells or basins (Garinger and others, 2011).
-
2. Phase II began in 2013 and includes a 30-Mgal/d surface-water treatment facility, a 60-Mgal/d river intake facility equipped to divert 30 Mgal/d and treat 15 Mgal/d, eight recharge-injection wells, and a recharge basin. The facility capacity of 30 Mgal/d requires a streamflow of about 100 cubic feet per second (ft3/s) or greater at the Little Arkansas River near Sedgwick, Kans., streamgage (USGS station 07144100; hereafter referred to as the “Sedgwick site”; fig. 1) to operate. Water is directly diverted from the Little Arkansas River at the intake structure when streamflow exceeds about 100 ft3/s at this site. The city of Wichita has a National Pollutant Discharge Elimination System (NPDES) permit (Kansas Permit number I-LA24-PO01; Federal Permit number KS0099694) to discharge waste from the ASR phase II surface-water treatment facility to the Little Arkansas River.
The ASR facilities have an operational period of April 15 through October 15 to avoid freezing conditions. The total amount of phase I and II recharge water was about 5.1 billion gallons during 2007 through 2021. More information about the city of Wichita ASR project is available at https://wichitaasr.org/.
Purpose and Scope
The purpose of this report is to document Little Arkansas River water quantity and quality; document the development and update of regression models that establish relations between continuous and discrete water-quality data; and characterize and quantify water-quality concentrations, loads, and trends during 1995 through 2021 for primary ions, nutrient and carbon species, sediment, indicator bacteria, trace elements, and pesticides. Water-quality constituents of interest were selected because of their relevance to water-supply or water-quality issues in the Equus Beds aquifer and the Little Arkansas River. Data from this report can be used to document surface-water quality, quantify potential pollutants, evaluate changing conditions, identify environmental factors affecting surface water, provide science-based information for decision making, and help meet regulatory monitoring requirements. Nationally, the methods and results presented in this report provide guidance and perspective for aquifer recharge projects conducted elsewhere.
Description of Study Area and Background Information
The study area is located in south-central Kansas northwest of Wichita (fig. 1). This study has three study sites along the Little Arkansas River. The Little Arkansas River at Highway 50 near Halstead, Kans., streamgage (USGS station 07143672; hereafter referred to as the “Highway 50 site,” fig. 1) is located upstream from the other sites. The Sedgwick site (fig. 1) is located downstream from the other sites. These two sites bracket a substantial portion of the easternmost part of the Equus Beds aquifer. The Little Arkansas River upstream of ASR Facility near Sedgwick, Kans., streamgage (USGS station 375350097262800; hereafter referred to as the “Upstream ASR site,” fig. 1) is located between the Highway 50 and Sedgwick sites, about 14.7 river miles (mi) downstream from the Highway 50 site, about 1.7 river mi upstream from the Sedgwick site, and immediately upstream from the ASR Facility intake structure (not shown). The contributing drainage areas for the Highway 50 and Sedgwick sites are about 685 square miles (mi2) and about 1,165 mi2, respectively.
The Little Arkansas River has a contributing drainage area of about 1,266 mi2 (Albert and Stramel, 1966) of primarily agricultural land that produces mainly corn, sorghum, soybeans, and wheat (Kansas Department of Agriculture, 2021). About 65 percent of the Little Arkansas River watershed is cultivated crops and hay (U.S. Geological Survey, 2019). Fertilizers (such as nitrogen and phosphorus; U.S. Department of Agriculture, 2022) and herbicides (such as atrazine, glyphosate, and metolachlor; Kansas Rural Center, 2018) are commonly applied in the drainage basin. Cattle and hogs are the primary livestock raised in the area (Kansas Department of Agriculture, 2021). Long-term mean annual precipitation (1900 through 2021) in the study area, based on data recorded near Mount Hope, Kans. (fig. 1; National Oceanic and Atmospheric Administration, 2022), was 30.3 inches (table 1). Mean annual precipitation was 33.5 inches during the study period (1995 through 2021; table 1). Rock formations in the Little Arkansas River watershed are not well exposed because of low topographic relief and high erodability; rocks appearing at the land surface include the Wellington Formation and the Ninnescah shale of Permian age. Unconsolidated deposits of clay, silt, sand, and gravel also appear at the surface (Lane and Miller, 1965). Soils in the watershed range from clay and silty clay to sandy silt in the northern part; have developed from loess and alluvial deposits in the northern and central parts that range from clay to silty sand; and have developed from alluvium of Recent age in the southern part that range from clay to fine sand (Albert and Stramel, 1966).
Table 1.
Annual total and mean annual precipitation during 1995 through 2021, and mean annual precipitation during 1900 through 2021 at the “MT HOPE” (Global Historical Climatology Network–Daily USC00145539) station.[Data are from National Oceanic and Atmospheric Administration (2022)]
The Kansas Department of Health and Environment has listed several streams in the Little Arkansas River watershed as impaired waterways under section 303(d) of the 1972 Clean Water Act (Kansas Department of Health and Environment, 2022). Section 303(d) of the 1972 Clean Water Act requires States to identify water bodies with impaired water quality and the pollutants causing the impairments. Impairments for streams in or near the study area drainage basin include arsenic, chloride, and nitrate for water supply; dissolved oxygen, selenium, total suspended solids, atrazine, total phosphorus, biology (nutrients and oxygen demand impact on aquatic life), and sediment for aquatic life; and Escherichia coli (E. coli) bacteria for recreation (Kansas Department of Health and Environment, 2022). Major pollutants of concern for the Little Arkansas River watershed include atrazine, sediment, nutrients, and E. coli bacteria (Kansas State University Research and Extension and others, 2018).
A total maximum daily load (TMDL) is the maximum amount of a pollutant allowed in a water body while still meeting water-quality standards and are developed for each impairment-causing pollutant to determine reduction targets and management plans for reducing pollutants. The Little Arkansas River has defined TMDLs for atrazine (Kansas Department of Health and Environment, 2008), nutrients and oxygen demand (biology; Kansas Department of Health and Environment, 2000b), sediment (Kansas Department of Health and Environment, 2000a), chloride (Kansas Department of Health and Environment 2006b), fecal coliform bacteria (Kansas Department of Health and Environment, 2000c), total suspended solids (Kansas Department of Health and Environment, 2014), total phosphorus and pH (Kansas Department of Health and Environment, 2019), and total phosphorus and dissolved oxygen (Kansas Department of Health and Environment, 2021).
Recent Investigations
The city of Wichita and USGS cooperative efforts began in the 1920s as the city began its water-supply development (Stone, 2017). Since 1995, the USGS has completed several studies to quantify and characterize Equus Beds aquifer and Little Arkansas River water quality. Equus Beds aquifer studies have indicated that the amount of aquifer water volume has recovered since the historic 1993 low because of less pumping, more natural recharge, and ASR (Klager, 2016). The chloride plume near Burrton, Kans., moves about 0.6 foot per day eastward toward the Wichita well field regardless of pumping (Klager and others, 2014). Recharge activity has not resulted in substantial effects on Equus Beds aquifer water quality, at least partially because the total amount of water recharged is small (Tappa and others, 2015; Stone and others, 2016, 2019). Major recent Little Arkansas River findings include the following:
-
1. Little Arkansas River water-quality data were collected before (1995 through 2006) and concurrent with (2007 through 2012) ASR phase I activity as part of an effort to quantify effects that may be related to ASR phase I recharge (Tappa and others, 2015). Water-quality constituents of concern did not increase substantially and were likely more affected by climatological and natural processes than artificial recharge. Little Arkansas River sulfate concentrations rarely exceeded the Federal secondary maximum contaminant level (SMCL; 250 milligrams per liter [mg/L]), and chloride concentrations exceeded the Federal SMCL (250 mg/L) about 20 percent of the time, primarily during minimal flow conditions. Little Arkansas River nitrate concentrations rarely exceeded the Federal maximum contaminant level (MCL; 10 mg/L), and arsenic concentrations exceeded the Federal MCL (10 micrograms per liter [µg/L]) about 19 percent of the time, primarily during low-flow conditions. Little Arkansas River dissolved iron and manganese concentrations exceeded their Federal SMCLs (300 µg/L and 50 µg/L, respectively) in about 5 and 50 percent of discretely collected samples, respectively. Atrazine exceeded the Federal MCL (3.0 µg/L) about 28 percent of the time, mostly during the late spring to early fall. Large densities of coliform bacterial indicators (total coliform, fecal coliform, and E. coli) were detected in most Little Arkansas River samples (Tappa and others, 2015).
-
2. A hydrobiological monitoring program was developed and implemented to measure the effects of ASR phase II activity on Little Arkansas River water quality using data collected pre-ASR phase II implementation (2011 through 2012) and post-ASR phase II onset (2013 through 2014; Stone and others, 2016). Little Arkansas River water-quality constituent concentrations were controlled by hydrology rather than phase II ASR activity. Post-ASR nitrate and sediment concentrations were smaller than pre-ASR likely because of larger streamflows, and post-ASR organic carbon concentrations were larger than pre-ASR likely because of larger streamflows and runoff conditions. Pre- and post-ASR habitat, macroinvertebrate community, and fish community scores or metrics were similar (Stone and others, 2016).
-
3. Little Arkansas River water-quality data were collected during 2001 through 2016 to evaluate constituents of concern for aquifer recharge activity and compare water-quality data to their respective Federal criteria and to establish baseline conditions before further implementation of ASR (Stone and others, 2019). Little Arkansas River water-quality constituent concentrations did not increase in comparison to sampling that preceded (1995 through 2012) the study. Less than 1 percent of chloride and nitrate, 7 percent of dissolved iron, 48 percent of dissolved manganese, 12 percent of dissolved arsenic, and 39 percent of atrazine detections in Little Arkansas River samples exceeded Federal primary or secondary drinking-water criteria. None of the Little Arkansas River samples exceeded the Federal sulfate criterion, and every sample had detections of total coliform bacteria during the study (Stone and others, 2019).
-
4. Previously developed surrogate regression models used to continuously compute Little Arkansas River water-quality concentrations or densities of constituents of interest in real time were updated using data collected during 1998 through 2019 (Stone and Klager, 2022). Surrogate relations allow the concentrations or densities of many potential constituents of concern, including chloride, nutrients, sediment, bacteria, and atrazine to be estimated in near real time and characterized during conditions and time scales that would not be otherwise possible. Little Arkansas River real-time computations of water-quality constituents are available at the USGS National Real-Time Water Quality website (https://nrtwq.usgs.gov). Specific conductance was an explanatory variable for dissolved solids, primary ions, and atrazine; turbidity was an explanatory variable for total suspended solids and sediment, nutrients, total organic carbon, and indicator bacteria; and streamflow and water temperature were explanatory variables for dissolved arsenic (Stone and Klager, 2022).
Methods
Data collection followed protocols (Ziegler and Combs, 1997; Stone and others, 2012) developed for the Equus Beds ASR project. In addition to Ziegler and Combs (1997) and Stone and others (2012), numerous studies detailing Little Arkansas River water-quality sampling, processing, and analysis have been completed, including Ziegler and others (2010), Tappa and others (2015), Stone and others (2016), Stone and others (2019), and Stone and Klager (2022).
Data Collection
Continuous streamflow and physicochemical data and discrete water-quality data were collected from three surface-water sites along the Little Arkansas River over a range of streamflow conditions during 1995 through 2021 to evaluate water-quality conditions. Water-quality data were collected from the Highway 50, Sedgwick, and Upstream ASR sites to quantify water-quality constituents of interest, develop or update previously published water-quality surrogate relations, compute water-quality constituent concentrations and loads, and identify water-quality constituent trends during 1995 through 2021. Data collected by the USGS are stored in the USGS National Water Information System (NWIS) database (U.S. Geological Survey, 2023).
Continuous Streamflow and Gage Height Measurements
Continuous (1-hour maximum interval) streamflow was measured at the Highway 50 and Sedgwick sites and continuous (1-hour maximum interval) gage height (stream stage) was measured at the Upstream ASR site. Streamflow has been measured at the Highway 50 and Sedgwick sites since May 1995 and November 1993, respectively. Gage height was measured at the Upstream ASR site since April 2011. Streamflow and gage height were measured using standard USGS methods (Sauer and Turnipseed, 2010; Turnipseed and Sauer, 2010; Painter and Loving, 2015).
Continuous Water-Quality Monitoring
Continuous (1-hour maximum interval) water-quality physicochemical properties were measured at the Highway 50, Sedgwick, and Upstream ASR sites. Water-quality physicochemical properties measured included water temperature, specific conductance, pH, dissolved oxygen, turbidity, and nitrate plus nitrite. Water-quality monitors were installed near the centroid of the stream cross section at the Highway 50 and Sedgwick sites and on the right streambank (facing downstream) at the Upstream ASR site. The Highway 50, Sedgwick, and Upstream ASR sites were equipped with a YSI Incorporated 6600 Extended Deployment System water-quality monitor (YSI Incorporated, 2012a) in May 1998, April 1998, and April 2011, respectively, to continuously (60-minute interval) measure water temperature, specific conductance, pH, dissolved oxygen (YSI Clark cell or optical dissolved oxygen sensors), and turbidity (YSI 6026 or 6136 turbidity sensors). Nitrate sensors (HACH Nitratax plus sc; HACH Company, 2014) were installed at the Highway 50, Sedgwick, and Upstream ASR sites in February 2017, March 2012, and March 2016, respectively.
Some equipment was upgraded throughout the duration of the project. YSI 6026 turbidity sensors were initially installed at the Highway 50 and Sedgwick sites in October 1998 and September 1998, respectively. YSI 6136 turbidity sensors were installed at the Highway 50, Sedgwick, and Upstream ASR sites in January 2007, July 2004, and April 2011, respectively. A YSI EXO2 water-quality monitor (YSI Incorporated, 2012b) equipped with water temperature, specific conductance, pH, dissolved oxygen, and YSI EXO turbidity sensors was installed in January 2017 at the Highway 50 site, in September 2014 at the Sedgwick site, and in October 2015 at the Upstream ASR site. YSI 6026 and YSI 6136 turbidity sensors were deployed concurrently at the Highway 50 and Sedgwick sites during July 2004 through August 2005 and July 2004 through January 2006, respectively. YSI 6136 and YSI EXO turbidity sensors were deployed concurrently at the Highway 50, Sedgwick, and Upstream ASR sites during January 2017 through May 2019, September 2014 through March 2015 (and again March 2017 through July 2019), and May 2017 through July 2019, respectively, to compare turbidity sensor measurements. Water-quality monitors were maintained following standard USGS procedures (Wagner and others, 2006; Pellerin and others, 2013; Bennett and others, 2014; Rasmussen and others, 2014).
Discrete Water-Quality Data Collection
Discrete surface-water-quality samples were collected at the three study sites across a range of streamflows. Samples were collected using primarily depth- and width-integrated sample collection techniques at the Highway 50 and Sedgwick sites and either single vertical or grab-dip techniques at the Upstream ASR site (U.S. Geological Survey, 2006; Rasmussen and others, 2014). Discrete water-quality constituent datasets used in this report were selected based on the following criteria:
-
1. relevance as constituents of concern for either the Equus Beds aquifer or the Little Arkansas River (for example, constituents with Federal or other criteria),
-
2. relevance as constituents of concern for water treatment processes (for example, bromide, organic carbon, and pesticides), and
-
3. a history of detections in Little Arkansas River water samples (for pesticide datasets; appendix 1.5 in Stone and others, 2019).
Discrete water-quality samples were analyzed for primary ions (hardness, dissolved solids, calcium, magnesium, potassium, sodium, bromide, chloride, fluoride, silica, and sulfate), nutrient and carbon species (ammonia plus organic nitrogen, nitrate plus nitrite, total phosphorus, and dissolved and total organic carbon), sediment (suspended solids and suspended-sediment concentration), indicator bacteria (E. coli and fecal coliforms), trace elements (iron and arsenic), pesticides (including deethylatrazine, atrazine, and metolachlor), and absorbance and color at all study sites. Total nitrogen values were computed by summing ammonia plus organic nitrogen and nitrate plus nitrite values. Discrete samples collected at the Sedgwick site included additional nutrients (ammonia, nitrate, nitrite, orthophosphate, and dissolved phosphorus), strontium, and pesticides (including aminomethylphosphonic acid [AMPA] and glyphosate). Collection and analyses for dissolved and total suspended solids, suspended-sediment concentration, primary ions, nutrients, total organic carbon, arsenic, bacteria, and pesticides followed methods described by Ziegler and Combs (1997), Ziegler and others (1999, 2010), Stone and others (2012, 2016, 2019), Tappa and others (2015), and Stone and Klager (2022). Indicator bacteria analyses were done using methods described by the U.S. Environmental Protection Agency (2000a, 2006a, 2006b) and Myers and others (2014). AMPA and glyphosate were analyzed following methods described in Meyer and others (2009).
Primary ions, nutrients, organic carbon, and trace element samples were analyzed by the Wichita Municipal Water and Wastewater Laboratory and the USGS National Water Quality Laboratory (NWQL; Denver, Colorado). Suspended-sediment concentrations were analyzed at the USGS Iowa Sediment Laboratory (Iowa City, Iowa) following methods described in Guy (1969). Indicator bacteria samples were analyzed by the USGS Kansas Water Science Center (Lawrence, Kans.). Pesticides were analyzed by the USGS NWQL, with the exception of AMPA and glyphosate, which were analyzed by the USGS Kansas Organic Geochemistry Research Laboratory.
Data Analysis
Water-chemistry data were summarized for the Little Arkansas River for the period 1995 through 2021. Surrogate models for water-quality constituents of interest were updated or developed using continuously measured and concomitant discrete data and were used to compute concentrations and loads during the study period. Federal criteria were used to evaluate water quality. Where applicable, water-quality data were compared to U.S. Environmental Protection Agency (EPA) national drinking-water regulations (U.S. Environmental Protection Agency, 2009). Water-quality trends during the study period also were evaluated.
Continuous and Discrete Water Chemistry Data Analysis
Duration curves were used to summarize continuously measured or select computed Little Arkansas River water-quality data. Duration curves are cumulative distribution functions and were constructed using hourly values to evaluate and compare frequency and magnitude characteristics at the Highway 50, Sedgwick, and Upstream ASR sites during the study period. Duration curves are indicative of the percentage of time that specified conditions were equaled or exceeded, or the frequency of exceedance (Searcy, 1959). The Weibull formula (Weibull, 1939; Helsel and others, 2020) was used for plotting position.
Some water-quality constituents had censored values. Summary statistics for constituents that had censored values were calculated using regression on order statistics (Helsel and Cohn, 1988) for datasets with sample sizes less than (<) 50 and having as much as 80 percent censored data and for datasets with sample sizes greater than or equal to 50 and having as much as 50 percent censored data (Helsel, 2005; Bolks and others, 2014). Summary statistics for constituents that had censored values were calculated using maximum likelihood estimation (Helsel and Cohn, 1988) for datasets that had sample sizes greater than or equal to 50 and having between 50 and 80 percent censored data (Helsel, 2005; Bolks and others, 2014). Summary statistics were not computed when greater than 80 percent of data were censored. Statistical summaries were computed using the censtats function in R (version 4.1.3) programming language (R Core Team, 2021).
Surrogate Regression Model Development
Surrogate models were newly developed for constituents of interest at the three study sites and included models for bromide (all sites), dissolved organic carbon (all sites), total organic carbon (Upstream ASR site), 2-chloro-4-isopropylamino-6-amino-s-triazine (deethylatrazine; all sites), acetochlor (Upstream ASR site), AMPA (Sedgwick site), atrazine (Upstream ASR site), glyphosate (Sedgwick site), and metolachlor (all sites). Surrogate models for atrazine at the Highway 50 and Sedgwick sites were updated from previously published models (Stone and Klager, 2022). Surrogate models were not developed for water-quality constituents of interest that had datasets with greater than 20 percent left-censored data. Additional streamflow-based or gage-height-based models were developed to compute estimates of concentrations or densities during periods when concomitant continuous surrogate measurements were unavailable.
Regression models were developed using ordinary least squares (OLS) estimation for constituents that had datasets without left-censored data (“<” values). Tobit regression methods were used for fitting linear models for constituents that had datasets with left-censored data using absolute maximum likelihood estimation (AMLE; Hald, 1949; Cohen, 1950; Tobin, 1958; Helsel and others, 2020). Discrete datasets containing left-censored data included bromide, deethylatrazine, acetochlor, and metolachlor.
Model datasets and modeled constituents included available concomitant real-time physicochemical properties as explanatory variables during model development. Potential explanatory variables were evaluated individually and in combination and included available concomitant continuously recorded streamflow, water temperature, specific conductance, pH, dissolved oxygen, YSI EXO turbidity, and nitrate plus nitrite measurements. Periodic functions (seasonal components as sine and cosine variables) also were evaluated as potential explanatory variables using day of the year. Explanatory variables were interpolated within the continuous record based on discrete sample time. The maximum time span between two continuous data points used for interpolation was 2 hours.
Potential linear regression models were evaluated based on diagnostic statistics (coefficient of determination [R2], or adjusted R2 for OLS-estimated models; pseudo-R2 for AMLE-estimated models; Mallow’s Cp (Mallows, 1973) for OLS-estimated models; root mean square error for OLS-estimated models; prediction error sum of squares for OLS-estimated models; and residual standard error for AMLE-estimated models), patterns in residual plots, and the range and distribution of discrete and continuous data (Helsel and others, 2020). Models with the following criteria were selected:
-
1. maximized response variable variance explained by the model (R2 or adjusted R2 for OLS-estimated models and pseudo-R2 for AMLE-estimated models),
-
2. maximized fit to the data (Mallow’s Cp for OLS-estimated models), and
-
3. minimized heteroscedasticity (irregular scatter) in residual plots and uncertainty associated with computed values (root mean square error and prediction error sum of squares for OLS-estimated models and residual standard error for AMLE-estimated models).
If either a sine or a cosine seasonality variable was included in the model, both variables were included in the model. A bias correction factor was calculated for models with logarithmically transformed response variables because transformation of estimates to original units results in a low biased estimate (Duan, 1983; Helsel and others, 2020).
Potential outliers were identified following Rasmussen and others (2009) and Helsel and others (2020). Studentized residuals, leverage, Cook’s D (Cook, 1977), and difference in fit values were used to identify influential data points for OLS-estimated models; and leverage and Cook’s D values were used to identify influential data points for AMLE-estimated models. Studentized residuals were used to identify outliers with high leverage. Cook’s D is a combination of each observation’s leverage and residual value (large values indicate influential observations). Difference in fits is the product of the studentized residual and leverage (large values indicate influential observations). Removing data points that were based only on outlier criteria may overestimate the certainty of the model. Data points that exceeded Cook’s D and difference in fits thresholds for OLS-estimated models and Cook’s D thresholds for AMLE-estimated models were removed from model datasets to avoid erroneous inflation of model-computed values at the upper range of surrogate relations.
Continuous Water-Quality Constituent Concentration and Load Computation
Daily concentrations of selected primary ions (hardness, dissolved solids, calcium, sodium, bromide, chloride, and sulfate), nutrient and carbon species (ammonia plus organic nitrogen, total phosphorus, dissolved organic carbon, and total organic carbon), indicator bacteria (E. coli and fecal coliform bacteria), arsenic, sediment (suspended solids and suspended-sediment concentration), and pesticides (deethylatrazine, acetochlor, AMPA, atrazine, glyphosate, and metolachlor) were computed using previously developed (Christensen and others, 2003; Rasmussen and others, 2016; Stone and Klager, 2022) and newly developed models during 1998 through 2021. Daily mean values were used to compute water-quality constituent concentrations because of missing instantaneous streamflow data and periods of missing water-quality data.
Daily concentrations of hardness, dissolved solids, calcium, sodium, chloride, sulfate, and arsenic were computed at the Highway 50 and Sedgwick sites using surrogate models developed by Stone and Klager (2022). Water-quality constituent models that used turbidity measurements as a surrogate were developed using different turbidity sensors (YSI 6026, YSI 6136, or YSI EXO) and included ammonia plus organic nitrogen, total phosphorus, total organic carbon, E. coli bacteria, fecal coliform bacteria, suspended solids, and suspended-sediment concentration. Christensen and others (2003) developed models using continuous YSI 6026 turbidity measurements, Rasmussen and others (2016) developed surrogate relation models using continuous YSI 6136 turbidity measurements, and Stone and Klager (2022) developed surrogate relation models using continuous YSI EXO turbidity measurements at the Highway 50 and Sedgwick sites. Computed continuous concentrations or densities of ammonia plus organic nitrogen, total phosphorus, E. coli bacteria, fecal coliform bacteria, suspended solids, and suspended-sediment concentrations at the Highway 50 and Sedgwick sites were developed using a combination of previously published models by Christensen and others (2003; YSI 6026 turbidity sensor), Rasmussen and others (2016; YSI 6136 turbidity sensor), and Stone and Klager (2022; YSI EXO turbidity sensor) that used continuous turbidity sensor measurements. Computed continuous total organic carbon concentrations at the Highway 50 and Sedgwick sites were developed using a combination of previously published models by Rasmussen and others (2016; YSI 6136 turbidity sensor) and Stone and Klager (2022; YSI EXO turbidity sensor) according to continuous turbidity sensor measurements (Christensen and others [2003] did not include a total organic carbon model). Continuous total organic carbon at the Upstream ASR site was computed using the newly developed surrogate model and continuous YSI EXO turbidity sensor data. Continuous bromide, deethylatrazine, atrazine, and metolachlor concentrations were computed at the Highway 50, Sedgwick, and Upstream ASR sites using newly developed models. Continuous acetochlor concentrations were computed for the Upstream ASR site, and continuous AMPA and glyphosate concentrations were computed for the Sedgwick site. Previously published (Stone and Klager, 2022) and newly developed streamflow-based or gage-height-based surrogate models were used to compute continuous water-quality constituent concentrations when continuous water-quality data were unavailable. The streamflow-based or gage-height-based computed constituent concentrations were shifted to the primary water-quality values computed using a surrogate regression model directly preceding and following the streamflow-based or gage-height-based computed concentrations following Porterfield (1972) to align computed concentration differences among model types.
Loads were computed at the Highway 50 and Sedgwick sites for selected water-quality constituents, including those that have TMDLs. Chloride, nitrate plus nitrite, ammonia plus organic nitrogen, total phosphorus, dissolved organic carbon, total organic carbon, suspended solids, suspended-sediment concentration, E. coli bacteria, fecal coliform bacteria, and atrazine loads were computed during 1999 (the first full year of water-quality monitor measurements) through 2021. Water-quality constituent loads, with the exception of indicator bacteria, were calculated in tons per day. E. coli and fecal coliform bacteria were calculated in trillions of colony-forming units per day. Loads were computed by multiplying regression model-computed daily concentrations or densities (in milligrams per liter, micrograms per liter, or colony forming units per 100 milliliters) by daily streamflow (cubic feet per second) and a unit conversion factor of 0.0027 (for constituents measured in concentrations of milligrams per liter), 2.7x10⁻⁶ (for constituents measured in concentrations of micrograms per liter), or 2.45x10⁻⁵ (for constituents measured in densities of colony forming units per 100 milliliters). Annual loads were computed by summing the daily loads. Annual yields (in pounds or trillions of colony-forming units per square mile) were calculated by dividing the annual loads by the contributing drainage area at the Highway 50 (685 mi2) and Sedgwick (1,165 mi2) sites.
Water-Quality Constituent Trends
Water-quality constituent trends were analyzed at the Highway 50 and Sedgwick sites for discrete datasets that did not have more than 50 percent censored data (Hirsch and De Cicco, 2015) and were not associated with strong seasonality (for example, pesticides [Gilliom, 2007; Ryberg and York, 2020]) and included primary ions (hardness, dissolved solids, calcium, magnesium, potassium, sodium, bromide, chloride, fluoride, silica, and sulfate), nutrient and carbon species (ammonia [Sedgwick site only], nitrate plus nitrite, total nitrogen, nitrate [Sedgwick site only], nitrite [Sedgwick site only], orthophosphate [Sedgwick site only], dissolved phosphorus [Sedgwick site only], total phosphorus, dissolved organic carbon, and total organic carbon), sediment (suspended solids and suspended-sediment concentration), indicator bacteria (E. coli and fecal coliform bacteria), and trace elements. Water-quality constituent trends were analyzed using the R package Exploration and Graphics for RivEr Trends (EGRET; Hirsch and De Cicco, 2015). The Weighted Regressions on Time, Discharge, and Season model (WRTDS; Hirsch and others, 2010; Hirsch and De Cicco, 2015) was run using the EGRET package for long-term flow-normalized water-quality concentration and flux computations and trends. Annual water-quality concentrations and fluxes were estimated using WRTDS with Kalman filtering (WRTDS–K; described in Zhang and Hirsch, 2019). WRTDS–K generally produces more accurate concentration and flux results than the standard WRTDS method (Zhang and Hirsch, 2019). Lee and others (2019) tested 13 methods for computing annual water-quality constituent loads and determined WRTDS–K was the most accurate.
The Exploration and Graphics for RivEr Trends Confidence Intervals (EGRETci) package was used to quantify WRTDS model uncertainty using a WRTDS bootstrap test (WBT; Hirsch and others, 2015). Hirsch and others (2015) developed WBT trend likelihood descriptive statement definitions (table 2) to provide a method to classify water-quality trends into categories ranging from highly unlikely to highly likely. Water-quality concentrations, flow-normalized concentrations, fluxes, and flow-normalized fluxes were computed annually. Changes in annual flow-normalized concentrations and fluxes were computed at the Highway 50 and Sedgwick sites for three periods:
-
1. the entire 26- or 27-year study period during 1995 (Sedgwick site) or 1996 (Highway 50 site) through 2021,
-
2. the 11- or 12-year period before ASR (phase I) operation during 1995 (Sedgwick site) or 1996 (Highway 50 site) through 2006, and
-
3. the 15-year period after ASR (phase I) operation onset during 2007 through 2021 (Highway 50 and Sedgwick sites).
Table 2.
Weighted Regressions on Time, Discharge, and Season bootstrap test trend likelihood descriptive statement definitions (Hirsch and others, 2015).[≥, greater than or equal to; ≤, less than or equal to; ˂, less than; ˃, greater than]
Quality Assurance and Quality Control
OLS regression was analyzed on concurrent YSI 6026/YSI 6136 (Highway 50 and Sedgwick sites) and YSI 6136/YSI EXO (Highway 50, Sedgwick, and Upstream ASR sites) turbidity sensor measurements for comparisons. The OLS regressions show the relation between the YSI 6026 and YSI 6136 turbidity sensors explained 96 to 97 percent of the variance in turbidity measurements and the relation between the YSI 6136 and YSI EXO turbidity sensors explained 98 to 99 percent of the variance in turbidity measurements (appendix 1). YSI 6136 turbidity sensor measurements were, on average, 46 to 53 percent smaller than YSI 6026 turbidity sensor measurements and 14 to 22 percent larger than YSI EXO turbidity sensor measurements (appendix 2).
Quality-assurance and quality-control (QA/QC) samples were collected to identify, quantify, and document bias and variability in data that may have resulted from collecting, processing, handling, and analyzing samples (U.S. Geological Survey, 2006). QA/QC samples collected for this study included replicate, blank, and standard reference samples for discretely collected water-quality samples. Replicate sample relative percentage difference (RPD) was computed by dividing the difference between replicate pairs by the mean and multiplying that value by 100 for a value that represents the percentage difference between replicate pairs (Zar, 1999). RPDs were not computed for replicate pairs that had consistent nondetections (both values in the replicate pair were censored) or inconsistent detections (one value in the replicate pair was a detected value and the other value was censored; Mueller and others, 2015).
Comparison of field cross-sectional measurements collected during discrete sampling throughout the range of streamflow conditions at the Highway 50 and Sedgwick sites verified minimal bias in continuous data owing to sensor location within the stream cross section. Median RPDs between continuous in situ and average cross-sectional field water-quality monitor measurements from Highway 50 and Sedgwick sites were <4 percent, except for turbidity, which had a median RPDs of 8 percent. Cross-sectional field measurements were not collected at the Upstream ASR site owing to physical site characteristics and safety concerns; instead, the concomitant field measurement was made near the in situ water-quality monitor. Median RPDs between Upstream ASR site continuous in situ and field water-quality monitor measurements were <3 percent, except for turbidity measurements, which had a median RPD of 8 percent.
Continuous data collected during the study period generally required corrections (such as computations to account for instrument fouling or calibration drift) of <10 percent from the original value. Continuous data were missing or deleted because of equipment malfunction, excessive sensor fouling, and extreme low-flow conditions. During the study period, 2 to 4 percent of the streamflow record and 1 percent of the gage height record, 3 to 10 percent of the water temperature record, 5 to 12 percent of the specific conductance record, 3 to 11 percent of the pH record, 6 to 10 percent of the dissolved oxygen and nitrate plus nitrite records, and 6 to 15 percent of the turbidity record were missing or deleted from study sites (table 3).
Table 3.
Summary statistics for continuously (hourly) measured physicochemical properties for the Little Arkansas River at Highway 50 near Halstead, Kansas (Highway 50; U.S. Geological Survey [USGS] station 07143672, 1995–2021); Little Arkansas River near Sedgwick, Kans. (Sedgwick; USGS station 07144100, 1995–2021); and Little Arkansas River upstream of ASR Facility near Sedgwick, Kans. (Upstream ASR; USGS station 375350097262800, 2011–21).[Continuous real-time water-quality data are available on the U.S. Geological Survey National Real-Time Water-Quality website (https://nrtwq.usgs.gov/ks); n, number of measurements; USGS, U.S. Geological Survey; pcode, parameter code; <, less than; --, not applicable]
Data collected using a YSI 6026 turbidity sensor during October 1998 through December 2006, a YSI 6136 turbidity sensor during January 2007 through January 2017, and an EXO turbidity sensor during February 2017 through December 2021.
Data collected using a YSI 6026 turbidity sensor during September 1998 through June 2004, a YSI 6136 turbidity sensor during July 2004 through August 2014, and an EXO turbidity sensor during September 2014 through December 2021.
About 10 percent of discrete water-quality samples were QA/QC samples. Sequential, split, and concurrent replicate water-quality samples were collected during the study period over a range of streamflows and gage heights among the sampling sites. Replicate comparisons included 772 primary ion pairs, 520 nutrient and carbon species pairs, 102 sediment pairs, 109 indicator bacteria pairs, 110 trace element pairs, 474 pesticide pairs, and 79 absorbance and color pairs (appendix 3). Median replicate pair RPDs were <5 percent for primary ions and nutrient and carbon species, <10 percent for sediment and absorbance and color, <15 percent for pesticides, and less than or equal to 20 percent for indicator bacteria and trace elements (appendix 3). The RPD values generally were largest when the values were at or near the laboratory reporting level.
Blank samples were collected to measure the magnitude of contaminant concentration introduced into samples during sampling, processing, and analytical procedures (U.S. Geological Survey, 2006). Blank samples consisted of deionized water, inorganic blank water, or pesticide-grade blank water depending on analysis type. During 1995 through 2021, 142 blank samples were collected for this study. Primary ion blank detections were in 5 percent of primary ion blank results and all individual primary ions detections were <10 percent (appendix 3); detections were generally at or near the detection limit. Nutrients and carbon were detected in 9 percent of blank samples and were generally at or near the detection limit. Individual nutrient and carbon detections were <10 percent, except for ammonia (16 percent), nitrate plus nitrite (17 percent), dissolved organic carbon (47 percent), and total organic carbon (30 percent; appendix 3). Generally, dissolved and total organic carbon detections were at or near the detection limit; some organic carbon detections were traced to potentially contaminated blank water used for the samples. Indicator bacteria were not detected, and one trace element (iron) was detected in 1 percent of blank samples (appendix 3). Pesticides were detected in 1 percent of blank samples and detections were at or near the detection limit (appendix 3). Absorbance and color samples had four (6 percent) detections that were at or near the detection limit (appendix 3).
Little Arkansas River Long-Term Water Quality
Continuous measurement of physicochemical properties in near-real time allowed characterization of Little Arkansas River water during conditions and time scales that would not have been possible otherwise and served as a complement to discrete water-quality sampling. Continued data collection during different flow and seasonal conditions can be used to characterize water-quality conditions and potentially identify new and changing trends. Surface-water physicochemical properties and water-quality constituents that frequently exceeded EPA Federal drinking water-quality criteria and those that are of potential interest or concern for artificial recharge operations are discussed in this report to characterize the quality of potential recharge water.
Little Arkansas River Continuous Streamflow
Stream ecosystem structure and function are largely affected by streamflow (Allan and others, 2021). Annual differences in streamflow are primarily attributed to differences in precipitation. The Equus Beds ASR project operations are limited to above-base-flow conditions. Streamflow at the Highway 50 and Sedgwick sites ranged from <1 to 13,900 ft3/s and <1 to 19,000 ft3/s, respectively, during 1995 through 2021 (table 3). Mean streamflows during the study period were 217 and 361 ft3/s at the Highway 50 and Sedgwick sites, respectively (table 3). The ASR phase II water treatment facility requires a minimum streamflow of about 100 ft3/s at the Sedgwick site to operate. During the study period, 100 ft3/s was exceeded about 31 percent of the time (fig. 2A). Little Arkansas River streamflow values during 1995 through 2021 at the Sedgwick site did not exceed previously reported ranges (Tappa and others, 2015; Stone and Klager, 2022; table 3). Streamflow and gage height maxima were during May 2019 at the Highway 50, Sedgwick, and Upstream ASR sites.

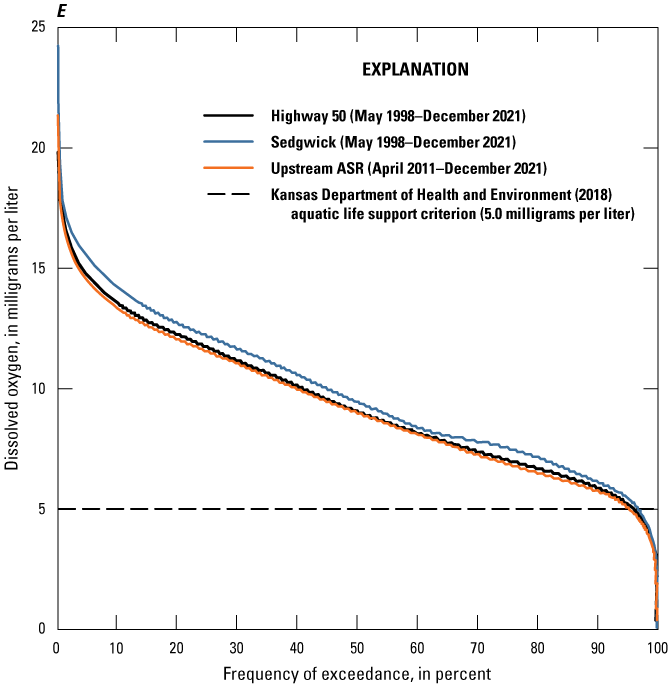
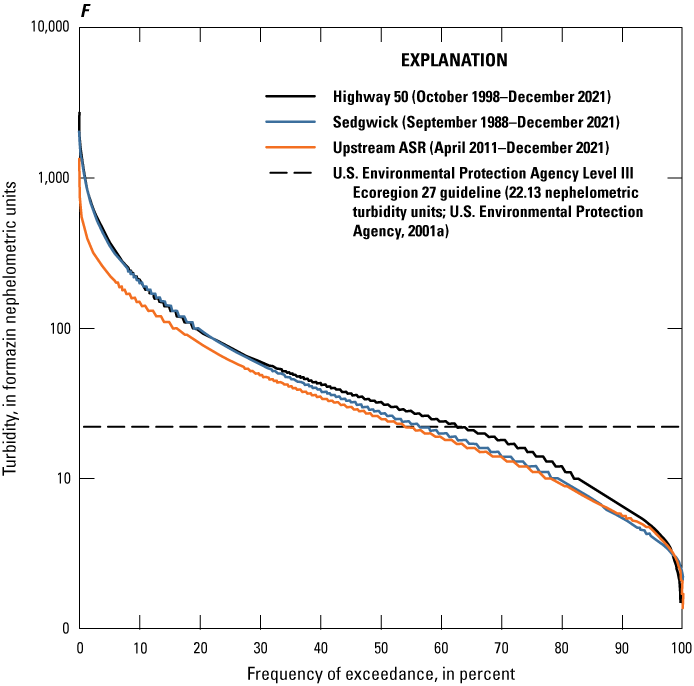
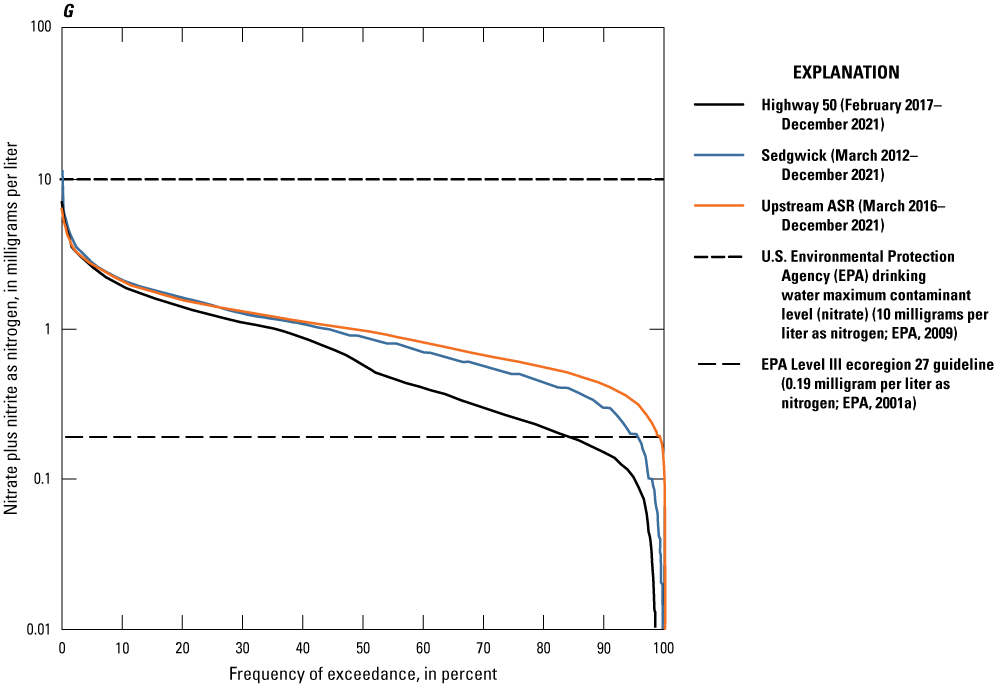
Duration curves for continuously (hourly) measured physicochemical properties for the Little Arkansas River at Highway 50 near Halstead, Kansas (Highway 50; U.S. Geological Survey [USGS] station 07143672, 1995–2021); Little Arkansas River near Sedgwick, Kans. (Sedgwick; USGS station 07144100, 1995–2021); and Little Arkansas River upstream of ASR Facility near Sedgwick, Kans. (Upstream ASR; USGS station 375350097262800, 2011–21). A, Streamflow or gage height. B, Water temperature. C, Specific conductance. D, pH. E, Dissolved oxygen. F, Turbidity. G, Nitrate plus nitrite.
Little Arkansas River Continuous Water Quality
Water temperature affects physical, chemical, and biological processes. Kansas water-quality criteria require that discharges to streams not change water temperature more than 3 degrees Celsius (°C) above or below natural conditions or raise the water temperature above 32 °C (Kansas Department of Health and Environment, 2018). Mean study period water temperatures at the Highway 50, Sedgwick, and Upstream ASR sites were 14.9 °C, 15.2 °C, and 15.8 °C, respectively (table 3). Water temperatures at the Highway 50, Sedgwick, and Upstream ASR sites exceeded 32 °C <1 percent of the time (fig. 2B).
Specific conductance is an indirect measure of dissolved solids in water (Hem, 1992). Specific conductance measurements are commonly used as surrogates for primary ions at the Highway 50 and Sedgwick sites (Christensen and others, 2003; Rasmussen and others, 2016; Stone and Klager, 2022). Mean Little Arkansas River specific conductance was 916, 743, and 719 microsiemens per centimeter at 25 °C (µS/cm at 25 °C) during the study period at the Highway 50, Sedgwick, and Upstream ASR sites, respectively (table 3). Minimum continuous specific conductance at the Upstream ASR site was in May 2016 and was about 20 µS/cm at 25 °C less than previously reported by Stone and others (2016; table 3). Specific conductance was between about 500 and 1,000 µS/cm at 25 °C during most of the study period at all three study sites and varied more at the Highway 50 site (fig. 2C).
pH is a measure of the effective hydrogen ion concentration and is useful to evaluate chemical and biological reactions in water (Hem, 1992; U.S. Geological Survey, 2021). Kansas aquatic life-support criteria require that pH in streams measure between 6.5 and 8.5 standard units (Kansas Department of Health and Environment, 2018). The 2010 through 2014, 2015 through 2019, and current (2020 through 2025) NPDES permits (Kansas permit number: I-LA24-PO01; Federal permit number: KS0099694) for the ASR phase II treatment facility state that the effluent limits for pH are 6.0 to 9.0 standard units. Little Arkansas River median pH during the study period was 8.0 for all three study sites (table 3). pH was below the Kansas aquatic life-support criterion of 6.5 <1 percent of the time at the Highway 50 and Sedgwick sites and was above the 8.5 criterion 3 percent of the time at all three study sites during the study period (fig. 2D).
Dissolved oxygen is important for the survival and growth of aquatic organisms and is used as an indicator of stream health; concentrations of dissolved oxygen in surface water primarily are related to photosynthesis, respiration, atmospheric reaeration, and water temperature (U.S. Geological Survey, 2020). Kansas aquatic life-support criteria require that dissolved oxygen concentrations are not <5.0 mg/L (Kansas Department of Health and Environment, 2018). Little Arkansas River mean dissolved oxygen concentrations during the study period were 9.5, 9.9, and 9.3 mg/L at the Highway 50, Sedgwick, and Upstream ASR sites, respectively (table 3). Dissolved oxygen concentrations were below the Kansas aquatic life-support criterion of 5.0 mg/L about 3 to 4 percent of the time at the study sites during 1995 through 2021 (fig. 2E). Minimum dissolved oxygen measurements at the Upstream ASR site were 1 mg/L less than previously reported (Stone and others, 2016) and were during June and July 2016.
Turbidity is caused by suspended and dissolved matter such as clay, silt, dissolved organic material, plankton and other microscopic organisms, organic acids, and dyes. Turbidity measurements are commonly used as surrogates for unfiltered nutrient and carbon species, sediment, and bacteria at the Highway 50 and Sedgwick sites (Christensen and others, 2003; Rasmussen and others, 2016; Stone and Klager, 2022). EPA guidelines for turbidity (based on reference conditions that are determined as the 25th percentiles of all compiled nutrient data for that ecoregion) list 22.13 nephelometric turbidity units (a reporting unit equivalent to formazin nephelometric units [Anderson, 2005]) as the criterion for level III ecoregion 27 (central Great Plains) streams, which includes the Little Arkansas River (U.S. Environmental Protection Agency, 2001a). Mean Little Arkansas River turbidity measurements during the study period at the Highway 50, Sedgwick, and Upstream ASR sites were 89, 84, and 57 formazin nephelometric units (FNUs), respectively (table 3). The EPA level III ecoregion 27 guideline of 22.13 nephelometric turbidity units (presented here as a benchmark for comparison because of relative differences in turbidity sensor measurements) was exceeded about 63, 56, and 54 percent of the time at the Highway 50, Sedgwick, and Upstream ASR sites, respectively, during the study period (fig. 2F).
Large concentrations of inorganic nitrogen compounds, such as nitrate plus nitrite, may be toxic to aquatic organisms. Large nitrate concentrations in drinking water can impair the oxygen-carrying capacity of hemoglobin in humans (Camargo and Alonso, 2006). The EPA guidelines for nitrate plus nitrite as nitrogen list 0.19 mg/L as the criterion for level III ecoregion 27 streams (U.S. Environmental Protection Agency, 2001a). The EPA Federal MCL for nitrate in drinking water is 10 mg/L as nitrogen, which is the concentration above which methemoglobinemia, or blue baby syndrome, may happen in infants (U.S. Environmental Protection Agency, 2009). Mean Little Arkansas River nitrate plus nitrite measurements at the Highway 50, Sedgwick, and Upstream ASR sites were 0.9, 1.1, and 1.1 mg/L, respectively (table 3). The EPA level III ecoregion 27 guideline of 0.19 mg/L was exceeded at the Highway 50, Sedgwick, and Upstream ASR sites 84, 96, and 99 percent of the time, respectively, during the study period (fig. 2G). The EPA nitrate MCL of 10 mg/L was not exceeded at the Highway 50 and Upstream ASR sites and was exceeded <1 percent of the time at the Sedgwick site (table 3, fig. 2G). Continuous nitrate plus nitrite measurements at the Highway 50 site exceeded the range previously reported (Stone and Klager, 2022) by 2.6 mg/L (table 3) and were during February 2021. Continuous nitrate plus nitrite concentrations at the Upstream ASR site have not been previously reported. Maximum nitrate plus nitrite concentrations were during February 2021 and minimum nitrate plus nitrite concentrations were during August 2016 at all three study sites.
All Little Arkansas River continuously measured water-quality constituents at the Sedgwick site fell within historic extremes. Little Arkansas River water temperature and pH values at the Highway 50, Sedgwick, and Upstream ASR sites during this study did not exceed ranges previously reported (Tappa and others, 2015; Stone and others, 2016; Stone and Klager, 2022; table 3). Little Arkansas River specific conductance, dissolved oxygen, and turbidity values did not exceed ranges previously reported at the Highway 50 and Sedgwick sites (Tappa and others, 2015; Stone and others, 2016; Stone and Klager, 2022; table 3). Minimum continuous specific conductance and dissolved oxygen values at the Upstream ASR site were less than previously reported by Stone and others (2016; table 3) and maximum nitrate plus nitrate values at the Highway 50 site exceeded the range previously reported (Stone and Klager, 2022).
Little Arkansas River Discrete Water Quality
Discrete stream-water samples were used to describe Little Arkansas River water-quality conditions during 1995 through 2021. Water-quality constituents that frequently exceeded EPA drinking water-quality criteria and those that are of potential interest or concern for ASR operations are discussed in this section of the report to characterize source water for Equus Beds ASR efforts. Select Little Arkansas River discrete water-quality datasets at the Highway 50, Sedgwick, and Upstream ASR sites were used with concomitant continuously measured physicochemical parameters to develop new surrogate relations. In addition, select Little Arkansas River discrete water-quality datasets for the Highway 50 and Sedgwick sites were used to evaluate water-quality trends during 1995 through 2021.
Ions
Primary dissolved ions come from decomposing rocks and soils and generally include calcium, magnesium, sodium, potassium, bicarbonate, carbonate, chloride, and sulfate ions (Hem, 1992). Primary ions are a constituent of concern in drinking water because large concentrations of ions may cause physiological effects, unpalatable mineral tastes, and greater costs owing to corrosion or additional treatment needs (U.S. Environmental Protection Agency, 2009). The EPA established National Secondary Drinking Water Regulations that set nonmandatory water-quality standards. The EPA does not enforce SMCLs because they were established as guidelines to assist public water-supply systems in managing their drinking water for aesthetic considerations such as taste, color, and odor (U.S. Environmental Protection Agency, 2009). Several primary ions have EPA SMCLs and include dissolved solids, chloride, fluoride, and sulfate (U.S. Environmental Protection Agency, 2009).
The EPA dissolved solids SMCL is 500 mg/L (U.S. Environmental Protection Agency, 2009), and discrete samples exceeded the SMCL at all three study sites (table 4). Dissolved solids concentrations exceeded the SMCL in 45, 29, and 23 percent of samples at the Highway 50, Sedgwick, and Upstream ASR sites, respectively. Mean dissolved solids concentrations during the study period ranged from 344 mg/L at the Upstream ASR site to 463 mg/L at the Highway 50 site (table 4). Dissolved solids ranges at the Highway 50 and Sedgwick sites did not exceed the ranges previously reported (Tappa and others, 2015; Stone and Klager, 2022; table 4). The dissolved solids minimum at the Upstream ASR site was 26 percent less than the minimum previously reported (Stone and others, 2016) and were in May 2019 (table 4).
Table 4.
Discrete sample water-quality constituent summary statistics for the Little Arkansas River at Highway 50 near Halstead, Kansas (Highway 50; USGS station 07143672, 1995–2021); near Sedgwick, Kans. (Sedgwick; USGS station 07144100, 1995–2021); and upstream of ASR Facility near Sedgwick, Kans. (Upstream ASR; USGS station 375350097262800, 2011–21).[Summary statistics were not computed when more than 80 percent of data were censored; USGS; U.S. Geological Survey; n, number of measurements; µg/L QSE, microgram per liter as quinine sulfate equivalents; CaCO3, calcium carbonate; <, less than; --, not applicable; SiO2, silicon dioxide; E. coli, Escherichia coli; UV, ultraviolet; nm, nanometer; absorbance units/cm, absorbance units per centimeter]
Bromide is a constituent of concern for the Little Arkansas River. Bromide is not a risk to human health; however, during drinking-water decontamination, bromide reacts with natural organic matter present in source water and chemical disinfectants to create brominated disinfection byproducts, including bromate. The EPA has classified bromate (Federal MCL of 0.01 mg/L) as a probable human carcinogen (U.S. Environmental Protection Agency, 2009). Bromate is formed when ozone used to disinfect drinking water reacts with naturally occurring bromide in source water (U.S. Environmental Protection Agency, 2001b). The city of Wichita uses a threshold of 0.3 mg/L for bromide as a treatment standard. Bromide concentrations exceeded the treatment threshold of 0.3 mg/L at all three study sites (table 4). Bromide concentrations exceeded the treatment threshold in 38, 19, and 17 percent of samples at the Highway 50, Sedgwick, and Upstream ASR sites, respectively. Mean bromide concentrations at the Highway 50, Sedgwick, and Upstream ASR sites during the study period were 0.32, 0.18, and 0.17 mg/L, respectively (table 4). Bromide ranges at the Highway 50 and Sedgwick sites did not exceed the ranges previously reported (Tappa and others, 2015; Stone and others, 2019; table 4).
The EPA SMCL for chloride and sulfate is 250 mg/L (U.S. Environmental Protection Agency, 2009). Mean chloride concentrations during the study period at the Highway 50, Sedgwick, and Upstream ASR sites were 129, 67, and 61 mg/L, respectively (table 4). Little Arkansas River chloride concentrations exceeded the Federal SMCL at the Highway 50 and Sedgwick sites, but the SMCL was not exceeded at the Upstream ASR site during the study (table 4). Chloride concentrations exceeded the SMCL in 14 and <1 percent of samples at the Highway 50 and Sedgwick sites, respectively. Sulfate concentrations exceeded the Federal SMCL at the Highway 50 site in <1 percent of samples but not the Sedgwick or Upstream ASR sites during the study (table 4). Chloride concentration ranges during this study at the Highway 50 and Sedgwick sites did not exceed previously reported ranges (Tappa and others, 2015; Stone and Klager, 2022). The chloride minimum at the Upstream ASR site was less than the range previously reported (Stone and others, 2016) and were in May 2019 (table 4). Sulfate concentration ranges at the Highway 50 and Sedgwick sites did not exceed the previously reported range (Tappa and others, 2015). The sulfate minimum at the Upstream ASR site was less than the range previously reported (Stone and others, 2016) and were in May 2019 (table 4).
Nutrients and Carbon Species
Nutrients, such as nitrogen and phosphorus species, in water are closely related to agricultural activities because of their presence in fertilizers and animal waste. Nutrients are a pollutant of concern in the Little Arkansas River (Kansas State University Research and Extension and others, 2018). Nitrogen is present as ammonia, nitrate, nitrite, and as part of organic compounds. The EPA level III ecoregion 27 guideline for ammonia plus organic nitrogen (organic nitrogen; as nitrogen) is 0.52 mg/L (U.S. Environmental Protection Agency, 2001a) and was exceeded at all study sites (table 4). Ammonia plus organic nitrogen concentrations exceeded the guideline in 92, 90, and 98 percent of samples at the Highway 50, Sedgwick, and Upstream ASR sites, respectively. During the study period, mean ammonia plus organic nitrogen (as nitrogen) concentrations ranged from 1.4 mg/L (Sedgwick site) to 1.8 mg/L (Highway 50 site; table 4). Ammonia plus organic nitrogen values at the Highway 50 site did not exceed previously reported ranges (Tappa and others, 2015; Stone and Klager, 2022). Ammonia plus organic nitrogen values at the Sedgwick and Upstream ASR sites exceeded previously reported ranges (Stone and others, 2016; Stone and Klager, 2022; table 4) by 3 and 18 percent, respectively, and maximum values at both sites were in February 2020. Mean nitrate plus nitrite (as nitrogen) concentrations ranged from 0.87 mg/L (Highway 50 site) to 1.2 mg/L (Sedgwick site; table 4). Nitrate plus nitrite values during the study period at the Highway 50 and Sedgwick sites did not exceed previously reported ranges (Tappa and others, 2015; Stone and Klager, 2022), but the Upstream ASR site minimum did (Stone and others, 2016; table 4) in May 2019.
The EPA level III ecoregion 27 guideline for total phosphorus of 0.09 mg/L (U.S. Environmental Protection Agency, 2001a) was exceeded in all samples at all three study sites with the exception of one sample at the Sedgwick site (table 4). Discrete sample total phosphorus (as phosphorus) means were 0.70 at the Highway 50 and Sedgwick sites and 0.80 mg/L at the Upstream ASR site for the study period (table 4). Total phosphorus values did not exceed previously reported ranges (Tappa and others, 2015; Stone and Klager, 2022) at the Highway 50 and Sedgwick sites, but did exceed previously reported minimum and maximum values (Stone and others, 2016) by 0.20 and 0.04 mg/L, respectively, at the Upstream ASR site (table 4). The minimum total phosphorus value (0.29 mg/L) at the Upstream ASR site was in December 2019 and the maximum (1.5 mg/L) was in May 2021.
An important artificial recharge concern is the introduction of potentially reactive organic material into an aquifer (Aiken, 2002). Mean dissolved organic carbon concentrations were 7.9, 6.6, and 7.7 mg/L at the Highway 50, Sedgwick, and Upstream ASR study sites, respectively, during the study period (table 4). Dissolved organic carbon values did not exceed previously reported ranges (Tappa and others, 2015; Stone and others, 2019) at the Highway 50 and Sedgwick sites, but did exceed previously reported minimum and maximum values (Stone and others, 2016) by 0.80 and 0.70 mg/L, respectively, at the Upstream ASR site (table 4). The minimum dissolved organic carbon value (2.9 mg/L) was in January 2018 and the maximum (14 mg/L) was in June 2016 at the Upstream ASR site. Mean total organic carbon concentrations were 13 mg/L at the Highway 50 site and 12 mg/L at the Sedgwick and Upstream ASR sites (table 4). Total organic carbon concentrations during the study period at the Highway 50 site did not exceed previously reported ranges (Tappa and others, 2015; Stone and Klager, 2022). The maximum total organic carbon value (36 mg/L) at the Sedgwick site exceeded the range of previously reported values (Tappa and others, 2015; Stone and Klager, 2022) by 4.0 mg/L and were in February 2020. The minimum and maximum total organic carbon values at the Upstream ASR site exceeded the range of previously reported values (Stone and others, 2016) by 1.6 and 5.4 mg/L, respectively, and were in August 2019 and January 2018, respectively (table 4).
Sediment
Sediment is a naturally occurring constituent that is also a pollutant of concern in the Little Arkansas River (Kansas State University Research and Extension and others, 2018). Suspended solids and suspended-sediment concentration are two analytes typically used to describe concentrations of suspended solid-phase material in surface water. Suspended-sediment concentration is a better measure for natural water than suspended solids (Gray and others, 2000), but suspended solids are required for TMDLs. Suspended solids represent suspended solids material and may consist of organic or inorganic material. Suspended solids originate from sources that include algae, decaying vegetation, runoff, discharges (for example, industrial or wastewater), and physical degradation of geologic formations. The amount of suspended solids in a sample is equal to the dry weight of organic and inorganic solids filtered from a subsample of the original sample. Suspended-sediment concentration is the measure of the dry weight of the organic and inorganic sediment in a full sample volume of a water-sediment mixture (Guy, 1969). Suspended sediment may consist of clay, silt, sand, or organic material. Mean Little Arkansas River suspended-solids concentrations were 264, 219, and 184 mg/L at the Highway 50, Sedgwick, and Upstream ASR sites, respectively, during the study period (table 4). Suspended-solids concentrations during the study period did not exceed previously reported ranges (Tappa and others, 2015; Stone and Klager, 2022) at the Highway 50 and Sedgwick sites. The maximum suspended-solids value at the Upstream ASR site exceeded the previously reported value (Stone and others, 2016) by 357 mg/L and was in May 2021 (table 4). Mean suspended-sediment concentrations at the Highway 50, Sedgwick, and Upstream ASR sites were 400, 232, and 246 mg/L, respectively (table 4). Suspended-sediment concentration during the study period at the Highway 50 and Sedgwick sites did not exceed previously reported ranges (Tappa and others, 2015; Stone and Klager, 2022). The maximum suspended-sediment concentration at the Upstream ASR site exceeded the previously reported value (Stone and others, 2016) by 706 mg/L and was in May 2021 (table 4).
Indicator Bacteria
E. coli and fecal coliform bacteria are types of coliform bacteria that are generally specific to fecal material from humans and other homeotherms and are commonly used as pathogen indicators (Myers and others, 2014). E. coli and fecal coliform bacteria presence indicates potentially contaminated water by human or animal wastes and presence of other harmful bacteria or viruses (Dufour and others, 1981; Dufour, 1984). The State of Kansas E. coli criteria for publicly accessible (Class B) Kansas streams with flows of at least 1 ft3/s require that the geometric mean of at least five samples collected during separate 24-hour periods within a 30-day period not exceed 262 colony forming units per 100 milliliters (cfu/100 mL) for primary contact during April 1 through October 31 of each year and 2,358 cfu/100 mL during November 1 through March 31 (Kansas Department of Health and Environment, 2011, 2017, 2018). Little Arkansas River E. coli and fecal coliform medians ranged from 540 to 640 cfu/100 mL and 590 to 910 cfu/100 mL, respectively, at the three study sites during the study period (table 4). E. coli densities exceeded the primary contact Class B criteria of 262 cfu/100 mL at all sites (table 4). E. coli densities exceeded the primary contact Class B criteria of 262 cfu/100 mL in 67, 60, and 62 percent of samples at the Highway 50, Sedgwick, and Upstream ASR sites, respectively. E. coli densities at the Highway 50 site were within ranges previously reported (Tappa and others, 2015; Stone and Klager, 2022); the maximum E. coli densities at the Sedgwick and Upstream ASR sites exceeded previously reported ranges (Stone and others, 2016; Stone and Klager, 2022) by 1,300 and 11,000 cfu/100 mL, respectively, and were in October 2021 (table 4). Fecal coliform densities at the Highway 50 and Sedgwick sites during the study were within previously reported ranges (Tappa and others, 2015; Stone and Klager, 2022) during the study (table 4). The maximum fecal coliform density at the Upstream ASR site exceeded the maximum previously reported value (Stone and others, 2016; table 4) by 16,000 cfu/100 mL and were in June 2016.
Trace Elements
Dissolved concentrations of particular interest in the Little Arkansas River include iron and arsenic. Iron in water is derived from rocks and soils (Hem, 1992). Excessive concentrations of iron in water cause unpalatability because of odor, a metallic taste, and rusty color. The EPA Federal SMCL for iron is 300 µg/L (U.S. Environmental Protection Agency, 2009) and was exceeded in 5, 7, and 9 percent of samples at the Highway 50, Sedgwick, and Upstream ASR sites, respectively, during the study period (table 4). Mean study site iron concentrations ranged from 63 to 137 µg/L (table 4). Iron concentrations at the Highway 50 and Sedgwick sites did not exceed the ranges previously reported (Tappa and others, 2015; Stone and others, 2019). The maximum iron concentrations at the Upstream ASR site exceeded the previously reported range (Stone and others, 2016) by 807 µg/L and were during August 2019 (table 4).
Arsenic is present naturally in clay layers associated with iron sulfide minerals (Hem, 1992) and is a health concern in drinking water because it causes skin damage, affects the circulatory system, and increases the risk of cancer (U.S. Environmental Protection Agency, 2009). The EPA Federal MCL for arsenic is 10 µg/L (U.S. Environmental Protection Agency, 2009) and was exceeded in 10 percent of samples at the Highway 50 and Sedgwick site and 25 percent of samples at the Upstream ASR site (table 4). Mean arsenic concentrations were 5.4, 5.8, and 7.7 µg/L at the Highway 50, Sedgwick, and Upstream ASR sites during the study period (table 4). Arsenic concentrations were within the ranges previously reported (Tappa and others, 2015; Stone and others, 2019) at the Highway 50 and Sedgwick sites (table 4). The minimum arsenic concentration was 1.6 µg/L less than the range previously reported (Stone and others, 2016; table 4) at the Upstream ASR site and was in May 2019.
Pesticides
Pesticides enter streams from field application and through irrigation return flow and surface runoff in agricultural landscapes. Pesticides that were detected in greater than one-half of the collected samples at any of the three study sites included 2-chloro-4-isopropylamino-6-amino-s-triazine (deethylatrazine, a degradation product of the atrazine molecule), acetochlor (applied herbicide), AMPA (a chemical that results from the breakdown of glyphosate), atrazine (applied herbicide), desulfinylfipronil (a degradation product of the fipronil [applied insecticide] molecule), glyphosate (applied herbicide), metolachlor (applied herbicide), and prometon (applied herbicide; table 4). Mean deethylatrazine concentrations during the study period were 0.350, 0.394, and 0.297 µg/L at the Highway 50, Sedgwick, and Upstream ASR sites, respectively, and maxima did not exceed previously reported ranges (Stone and others, 2019; table 4). Mean acetochlor concentrations at the Highway 50, Sedgwick, and Upstream ASR sites were 0.321, 0.380, and 0.982 µg/L, respectively (table 4). Acetochlor maxima exceeded the ranges previously reported (Stone and others, 2016, 2019) by 3.01, 12.2, and 6.14 µg/L at the Highway 50, Sedgwick, and Upstream ASR sites, respectively. AMPA and glyphosate were analyzed for the Sedgwick site only, were detected in all of the samples collected during the study, and mean concentrations were 1.44 and 0.970 µg/L, respectively (table 4). The AMPA maxima exceeded the range previously reported (Stone and others, 2019) by 1.6 µg/L, but glyphosate concentrations were within previously reported ranges (Stone and others, 2019; table 4). Mean study period metolachlor concentrations were 2.08 µg/L at the Highway 50 site and 1.77 µg/L at the Sedgwick and Upstream ASR sites (table 4). Metolachlor maxima at the Highway 50, Sedgwick, and Upstream ASR sites exceeded the ranges previously reported (Stone and others, 2016, 2019; table 4) by 24.4, 0.9, and 5.28 µg/L, respectively.
Atrazine is an herbicide commonly used on corn and sorghum, which are crops grown in the study area. Atrazine can cause cardiovascular system or reproductive problems in humans (U.S. Environmental Protection Agency, 2009). Previous (2010 through 2014 and 2015 through 2019) NPDES permits (Kansas permit number: I-LA24-PO01; Federal permit number: KS0099694) for the ASR phase II treatment facility required that atrazine be monitored monthly while the facility was operating. The EPA MCL for atrazine is 3.0 µg/L (U.S. Environmental Protection Agency, 2009) and was exceeded in 34, 36, and 37 percent of discrete samples at the Highway 50, Sedgwick, and Upstream ASR sites, respectively (table 4). Mean atrazine concentrations were 3.89, 3.55, and 3.47 µg/L during the study period at Highway 50, Sedgwick, and Upstream ASR sites, respectively. Atrazine concentrations during the study were within previously reported ranges (Tappa and others, 2015; Stone and others, 2016; Stone and Klager, 2022) at all study sites (table 4).
Regression Models for Selected Constituents
New Little Arkansas River regression models were developed for bromide, dissolved organic carbon, deethylatrazine, and metolachlor at all three study sites; new total organic carbon, acetochlor, and atrazine models were developed for the Upstream ASR site; and new AMPA and glyphosate models were developed for the Sedgwick site. Additional streamflow-based or gage-height-based models were developed to compute concentration and load estimates for constituents of interest when concomitant continuous data were unavailable. These models are not intended to stand alone, are not intended to be used under any other circumstance, and are not discussed further in this report. These additional models are the second model listed in table 5 for newly developed models. Atrazine models at the Highway 50 and Sedgwick sites were updated from previously published models (Stone and Klager, 2022). Regression model archive summaries are presented in appendixes 4 (Highway 50), 5 (Sedgwick), and 6 (Upstream ASR). Continuously measured physicochemical properties that were included as surrogates in final models for this study were specific conductance and YSI EXO turbidity (table 5). Selected regression models used to compute real-time water-quality concentrations are available at the USGS National Real-Time Water-Quality website (https://nrtwq.usgs.gov).
Table 5.
Regression models and summary statistics for continuous water quality constituent computations for the Little Arkansas River at Highway 50 near Halstead, Kansas (Highway 50; USGS station 07143672, 1995–2021); near Sedgwick, Kans. (Sedgwick; USGS station 07144100, 1995–2021); and upstream of ASR Facility near Sedgwick, Kans. (Upstream ASR; USGS station 375350097262800, 2011–21).[R2, coefficient of determination; MSE, mean square error; RMSE, root mean square error; RSE, residual standard error; MSPE, model standard percentage error; n, number of discrete samples; mg/L, milligram per liter; USGS, U.S. Geological Survey; log, base 10 logarithm; SC, specific conductance in microsiemens per centimeter at 25 degrees Celsius; --, not applicable; <, less than; Q, streamflow in cubic feet per second; sin, sine; π, pi; D, day of year; cos, cosine; ASR, aquifer storage and recovery; GH, gage height in feet; TBY, YSI EXO Smart Sensor turbidity in formazin nephelometric units; µg/L, microgram per liter]
| Regression model | Model archival summary appendix | R2 | Adjusted R2 | Pseudo R2 | MSE | RMSE | RSE | Average MSPE | Bias correction factor (Duan, 1983) | Discrete data | |||||
|---|---|---|---|---|---|---|---|---|---|---|---|---|---|---|---|
| Model dataset date range | n | Percent left- censored data | Range of values in variable measurements | Mean | Median | ||||||||||
| log(Br) = 1.273log(SC) − 4.183 | 4.1 | -- | -- | 0.78 | -- | -- | 0.2240 | -- | 1.10 | May 1998–October2021 | 188 | 4 | Br: <0.02–1.72 | 0.32 | 0.19 |
| SC: 76–2,062 | 697 | 597 | |||||||||||||
| log(Br) = −0.2945log(Q) + 0.2079sin(2πD/365) + 0.0407cos(2πD/365) − 0.1205 | 4.2 | -- | -- | 0.42 | -- | -- | 0.3645 | -- | 1.35 | May 1995–October 2021 | 200 | 4 | Br: <0.02–1.72 | 0.31 | 0.18 |
| Q: 1–11,000 | 836 | 90 | |||||||||||||
| log(Br) = 1.168log(SC) − 4.045 | 5.1 | -- | -- | 0.72 | -- | -- | 0.2111 | -- | 1.11 | November 1998–August 2021 | 203 | 7 | Br: <0.02–0.98 | 0.17 | 0.13 |
| SC: 96–1,295 | 577 | 619 | |||||||||||||
| log(Br) = −0.2216log(Q) + 0.1903sin(2πD/365) + 0.1316cos(2πD/365) − 0.4010 | 5.2 | -- | -- | 0.42 | -- | -- | 0.3070 | -- | 1.26 | March 1995–August 2021 | 214 | 7 | Br: <0.02–0.98 | 0.17 | 0.13 |
| Q: 1.4–15,000 | 1,280 | 111 | |||||||||||||
| log(Br) = 1.269log(SC) − 4.304 | 6.1 | -- | -- | 0.89 | -- | -- | 0.1370 | -- | 1.04 | April 2011–October 2021 | 59 | 5 | Br: <0.04–0.58 | 0.17 | 0.14 |
| SC: 88–1,270 | 557 | 575 | |||||||||||||
| log(Br) = −1.3321log(GH) + 0.24578sin(2πD/365) + 0.0134cos(2πD/365) + 0.1627 | 6.2 | -- | -- | 0.68 | -- | -- | 0.2428 | -- | 1.15 | April 2011–October 2021 | 62 | 5 | Br: <0.04–0.58 | 0.16 | 0.15 |
| GH: 3.63–29.4 | 8.24 | 6.00 | |||||||||||||
| log(TOC) = 0.434log(TBY) + 0.212 | 6.5 | 0.82 | 0.82 | -- | 0.0128 | 0.1130 | 0.1157 | 26 | 1.03 | April 2016–October 2021 | 44 | 0 | TOC: 3.53–28.3 | 13 | 13 |
| TBY: 4.1–467 | 142 | 106 | |||||||||||||
| log(TOC) = 0.824log(GH) + 0.31 | 6.6 | 0.56 | 0.56 | -- | 0.0259 | 0.1610 | 0.1631 | 38 | 1.07 | April 2011–October 2021 | 81 | 0 | TOC: 3.53–28.3 | 12 | 11 |
| GH: 3.63–25.7 | 7.93 | 5.73 | |||||||||||||
| log(2CTRI) = 0.606log(TBY) + 0.1207sin(2πD/365) − 0.4175cos(2πD/365) − 2.35 | 4.5 | -- | -- | 0.64 | -- | -- | 0.4013 | -- | 1.39 | March 2017–August 2021 | 37 | 8 | 2CTRI: <0.014–1.31 | 0.18 | 0.09 |
| TBY: 4.0–1,039 | 181 | 39 | |||||||||||||
| log(2CTRI) = 0.1567log(Q) + 0.1608sin(2πD/365) − 0.5222cos(2πD/365) − 1.383 | 4.6 | -- | -- | 0.42 | -- | -- | 0.4920 | -- | 1.81 | May 1995–August 2021 | 224 | 11 | 2CTRI: <0.006–2.69 | 0.33 | 0.17 |
| Q: <1–11,000 | 820 | 93 | |||||||||||||
| log(2CTRI) = 0.5937log(TBY) + 0.2523sin(2πD/365) − 0.3438cos(2πD/365) − 2.21 | 5.5 | -- | -- | 0.72 | -- | -- | 0.3521 | -- | 1.32 | December 2014–August 2021 | 46 | 9 | 2CTRI: <0.014–1.4 | 0.24 | 0.12 |
| TBY: 3.6–702 | 155 | 80 | |||||||||||||
| log(2CTRI) = 0.2130log(Q) + 0.1815sin(2πD/365) − 0.5958cos(2πD/365) − 1.528 | 5.6 | -- | -- | 0.55 | -- | -- | 0.4232 | -- | 1.51 | March 1995–August 2021 | 250 | 5 | 2CTRI: <0.0145–2.4 | 0.33 | 0.17 |
| Q: 1.4–15,000 | 1,412 | 141 | |||||||||||||
| log(2CTRI) = 0.522log(TBY) + 0.309sin(2πD/365) − 0.276cos(2πD/365) − 1.91 | 6.7 | 0.81 | 0.77 | -- | 0.0534 | 0.2310 | 0.2442 | 56 | 1.12 | May 2016–August 2021 | 20 | 0 | 2CTRI: 0.020–1.24 | 0.33 | 0.24 |
| TBY: 13.6–467 | 166 | 141 | |||||||||||||
| log(2CTRI) = 0.533log(GH) + 0.345sin(2πD/365) − 0.458cos(2πD/365) − 1.54 | 6.8 | 0.48 | 0.45 | -- | 0.1459 | 0.3820 | 0.3897 | 100 | 1.39 | April 2011–August 2021 | 52 | 0 | 2CTRI: 0.014–1.52 | 0.30 | 0.18 |
| GH: 3.63–29.7 | 8.62 | 5.52 | |||||||||||||
| log(ACE) = 0.7185log(TBY) + 0.2005sin(2πD/365) − 0.77546cos(2πD/365) − 2.16 | 6.9 | -- | -- | 0.75 | -- | -- | 0.4209 | -- | 1.48 | May 2016–August 2021 | 21 | 5 | ACE: <0.072–6.74 | 1.24 | 0.70 |
| TBY: 9.9–467 | 159 | 138 | |||||||||||||
| log(ACE) = 1.684log(GH) + 0.1443sin(2πD/365) − 0.7289cos(2πD/365) − 2.62 | 6.10 | -- | -- | 0.45 | -- | -- | 0.7138 | -- | 3.25 | April 2011–August 2021 | 52 | 8 | ACE: <0.01–10.5 | 0.86 | 0.20 |
| GH: 3.63–29.7 | 8.62 | 5.52 | |||||||||||||
| log(AMPA) = 0.165log(TBY) − 0.0931sin(2πD/365) − 0.209cos(2πD/365) − 0.222 | 5.7 | 0.76 | 0.76 | -- | 0.0149 | 0.1220 | 0.1231 | 28 | 1.04 | October 2014–July 2021 | 117 | 0 | AMPA: 0.29–4.30 | 1.42 | 1.30 |
| TBY: 2.7–603 | 66 | 27 | |||||||||||||
| log(AMPA) = 0.056log(Q) − 0.0932sin(2πD/365) − 0.271cos(2πD/365) − 0.11 | 5.8 | 0.70 | 0.69 | -- | 0.0185 | 0.1360 | 0.1370 | 32 | 1.05 | June 2002–July 2021 | 138 | 0 | AMPA: 0.29–4.30 | 1.44 | 1.40 |
| Q: 12–16,100 | 796 | 74 | |||||||||||||
| log(ATR) = 0.721log(TBY) + 0.405sin(2πD/365) − 0.38cos(2πD/365) − 1.7 | 4.7 | 0.62 | 0.58 | -- | 0.2809 | 0.5300 | 0.5454 | 154 | 1.90 | March 2017–August 2021 | 37 | 0 | ATR: 0.018–15.4 | 2.44 | 0.64 |
| TBY: 4.0–1,040 | 181 | 39 | |||||||||||||
| log(ATR) = 0.779log(TBY) + 0.385sin(2πD/365) − 0.278cos(2πD/365) − 1.62 | 5.9 | 0.71 | 0.69 | -- | 0.1910 | 0.4370 | 0.4475 | 119 | 1.50 | December 2014–August 2021 | 44 | 0 | ATR: 0.031–30.1 | 2.93 | 0.96 |
| TBY: 3.6–702 | 139 | 61 | |||||||||||||
| log(ATR) = 0.646log(TBY) + 0.556sin(2πD/365) − 0.243cos(2πD/365) − 1.22 | 6.11 | 0.81 | 0.78 | -- | 0.0992 | 0.3150 | 0.3341 | 79 | 1.23 | May 2016–August 2021 | 19 | 0 | ATR: 0.061–14.2 | 2.67 | 3.66 |
| TBY: 13.6–467 | 157 | 138 | |||||||||||||
| log(ATR) = 0.759log(GH) + 0.58sin(2πD/365) − 0.51cos(2πD/365) − 0.94 | 6.12 | 0.47 | 0.44 | -- | 0.3025 | 0.5500 | 0.5611 | 164 | 1.96 | April 2011– August 2021 | 52 | 0 | ATR: 0.044–19.1 | 3.50 | 1.50 |
| GH: 3.63–29.7 | 8.62 | 5.52 | |||||||||||||
| log(GLY) = 0.402log(TBY) − 0.0594sin(2πD/365) − 0.229cos(2πD/365) − 0.97 | 5.10 | 0.60 | 0.59 | -- | 0.0767 | 0.2770 | 0.2794 | 68 | 1.23 | October 2014–July 2021 | 118 | 0 | GLY: 0.05–7.6 | 0.84 | 0.50 |
| TBY: 2.7–603 | 66 | 27 | |||||||||||||
| log(GLY) = 0.215log(Q) − 0.0698sin(2πD/365) − 0.388cos(2πD/365) − 0.83 | 5.11 | 0.67 | 0.64 | -- | 0.0906 | 0.3010 | 0.3032 | 156 | 1.67 | June 2022–July 2021 | 139 | 0 | GLY: 0.05–7.8 | 0.97 | 0.55 |
| Q: 12–16,100 | 791 | 76 | |||||||||||||
| log(MET) = 0.812log(TBY) + 0.17sin(2πD/365) − 0.647cos(2πD/365) − 2.13 | 4.8 | 0.67 | 0.64 | -- | 0.2841 | 0.5330 | 0.5485 | 156 | 1.67 | March 2017–August 2021 | 37 | 0 | MET: 0.009–13.2 | 1.72 | 0.26 |
| TBY: 4.0–1,040 | 181 | 39 | |||||||||||||
| log(MET) = 0.3974log(Q) + 0.1198sin(2πD/365) − 0.9058cos(2πD/365) − 1.6131 | 4.9 | -- | -- | 0.60 | -- | -- | 0.6265 | -- | 2.31 | May 1995–August 2021 | 230 | 12 | MET: <0.02–39.4 | 1.8 | 0.5 |
| Q: <1–11,000 | 805 | 88 | |||||||||||||
| log(MET) = 0.729log(TBY) + 0.108sin(2πD/365) − 0.649cos(2πD/365) − 1.93 | 5.12 | 0.74 | 0.72 | -- | 0.2016 | 0.4490 | 0.4596 | 123 | 1.54 | December 2014–August 2021 | 45 | 0 | MET: 0.009–14.7 | 1.81 | 0.43 |
| TBY: 3.6–702 | 155 | 75 | |||||||||||||
| log(MET) = 0.3534log(Q) + 0.0721sin(2πD/365) − 0.9242cos(2πD/365) − 1.61 | 5.13 | -- | -- | 0.61 | -- | -- | 0.5675 | -- | 2.15 | March 1995–August 2021 | 255 | 7 | MET: <0.02–15.88 | 1.7 | 0.5 |
| Q: 1.4–15,000 | 1,388 | 144 | |||||||||||||
| log(MET) = 0.768log(TBY) + 0.279sin(2πD/365) − 0.888cos(2πD/365) − 1.97 | 6.13 | 0.89 | 0.87 | -- | 0.0692 | 0.2630 | 0.2790 | 65 | 1.15 | May 2016- August 2021 | 19 | 0 | MET: 0.069–12.1 | 3.09 | 1.88 |
| TBY: 13.6–467 | 174 | 144 | |||||||||||||
| log(MET) = 1.54log(GH) + 0.2sin(2πD/365) − 0.708cos(2πD/365) − 2.04 | 6.14 | 0.53 | 0.50 | -- | 0.3283 | 0.5730 | 0.5846 | 174 | 1.94 | April 2011–August 2021 | 52 | 0 | MET: 0.021–12.1 | 1.80 | 0.46 |
| GH: 3.63–29.7 | 8.62 | 5.52 | |||||||||||||
Specific conductance was the sole explanatory variable for bromide at all three study sites (table 5). Specific conductance was positively related to bromide because specific conductance measures the capacity of water to conduct an electrical current and is related to the concentration of ionized substances in water (Hem, 1992). The amount of variance explained by bromide models ranged from 72 percent at the Sedgwick site to 89 percent at the Upstream ASR site (table 5).
YSI EXO turbidity was the sole explanatory variable for total organic carbon at the Upstream ASR site and, in combination with seasonal variables, was an explanatory variable for all modeled pesticides (table 5). Turbidity was positively related to total organic carbon because total organic carbon contains organic material, which is a substantial component of total suspended solids (Hem, 1992). Turbidity was also the sole explanatory variable for total organic carbon at the Highway 50 and Sedgwick sites in previously developed models (Stone and Klager, 2022). The amount of variance explained by the Upstream ASR total organic carbon model was 82 percent (table 5). YSI EXO turbidity was positively related to deethylatrazine, atrazine, and metolachlor at all three study sites; acetochlor at the Upstream ASR site; and AMPA and glyphosate at the Sedgwick site (table 5), likely because pesticides, similar to sediment, are typically transported during runoff conditions. The amount of variance in deethylatrazine concentrations explained by regression models ranged from 64 percent at the Highway 50 site to 77 percent at the Upstream ASR site (table 5). The acetochlor model at the Upstream ASR site explained 75 percent of the variance in acetochlor concentrations (table 5). The amount of variance explained by the Sedgwick site AMPA and glyphosate models was 76 and 59 percent, respectively (table 5). Previously published atrazine models at the Highway 50 and Sedgwick sites (Christensen and others, 2003; Rasmussen and others, 2016; Stone and Klager, 2022) included specific conductance and seasonal components as explanatory variables; the most recently published atrazine models (Stone and Klager, 2022) explained 41 percent of the variance at the Highway 50 site and 54 percent of the variance at the Sedgwick site. The updated atrazine models at the Highway 50 and Sedgwick sites using YSI EXO turbidity as a surrogate explained 58 percent (a 17-percent increase from the most recently published model) and 69 percent (a 15-percent increase from the most recently published model) of the variance, respectively, and the newly developed Upstream ASR atrazine model explained 78 percent of the variance (table 5). The amount of variance explained by the newly developed metolachlor models ranged from 64 percent at the Highway 50 site to 87 percent at the Upstream ASR site (table 5).
Computed Select Water-Quality Constituents
Continuous water-quality concentrations were computed for select constituents using regression models and continuously measured physicochemical parameters. Continuous water-quality concentrations were computed for hardness, dissolved solids, calcium, sodium, bromide, chloride, sulfate, ammonia plus organic nitrogen, total phosphorus, total organic carbon, E. coli bacteria, fecal coliform bacteria, suspended solids, suspended-sediment concentration, arsenic, deethylatrazine, acetochlor, atrazine, glyphosate, and metolachlor. Concentration data were useful for evaluating the water-quality conditions of the Little Arkansas River as well as calculating selected water-quality constituent loads.
Primary Ions
The primary components of dissolved solids come from decomposing rocks and soils. Concentrations of dissolved solids in streams may increase because of atmospheric deposition, sewage inputs, industrial effluent, and agricultural and urban runoff (Hem, 1992). Dissolved solids often are used as a general indicator of salinity or water quality, and large concentrations are undesirable in drinking water because of possible physiological effects, strong mineral tastes, increased treatment costs, and corrosion of plumbing (U.S. Environmental Protection Agency, 2009). Dissolved solids commonly exceeded the EPA SMCL in the Equus Beds aquifer (Ziegler and others, 2010; Tappa and others, 2015; Stone and others, 2019). Computed primary components of dissolved solids (hardness, calcium, sodium, bromide, and chloride), with the exception of sulfate, were larger at the Highway 50 site compared to the Sedgwick site (table 6; fig. 3A–D). Computed dissolved solids concentrations during the study period ranged from 60 to 1,592 mg/L at the Highway 50 site and 53 to 929 mg/L at the Sedgwick site; mean computed dissolved solids concentrations were 546 and 447 mg/L at the Highway 50 and Sedgwick site, respectively (table 6). During the study period, the EPA SMCL for dissolved solids of 500 mg/L was exceeded 57 percent of the time at the Highway 50 site and 38 percent of the time at the Sedgwick site (fig. 3A).
Table 6.
Summary statistics for continuously (daily) computed regression-model water-quality constituents for the Little Arkansas River at Highway 50 near Halstead, Kansas (Highway 50; U.S. Geological Survey [USGS] station 07143672, 1998–2021); near Sedgwick, Kans. (Sedgwick; USGS station 07144100, 1998–2021); and upstream of ASR Facility near Sedgwick, Kans. (Upstream ASR; USGS station 375350097262800, 2011–21).[Continuous real-time water-quality data are available on the U.S. Geological Survey National Real-Time Water-Quality website (https://nrtwq.usgs.gov/ks); n, number of measurements; CaCO3, calcium carbonate; USGS, U.S. Geological Survey; pcode, parameter code; <, less than]
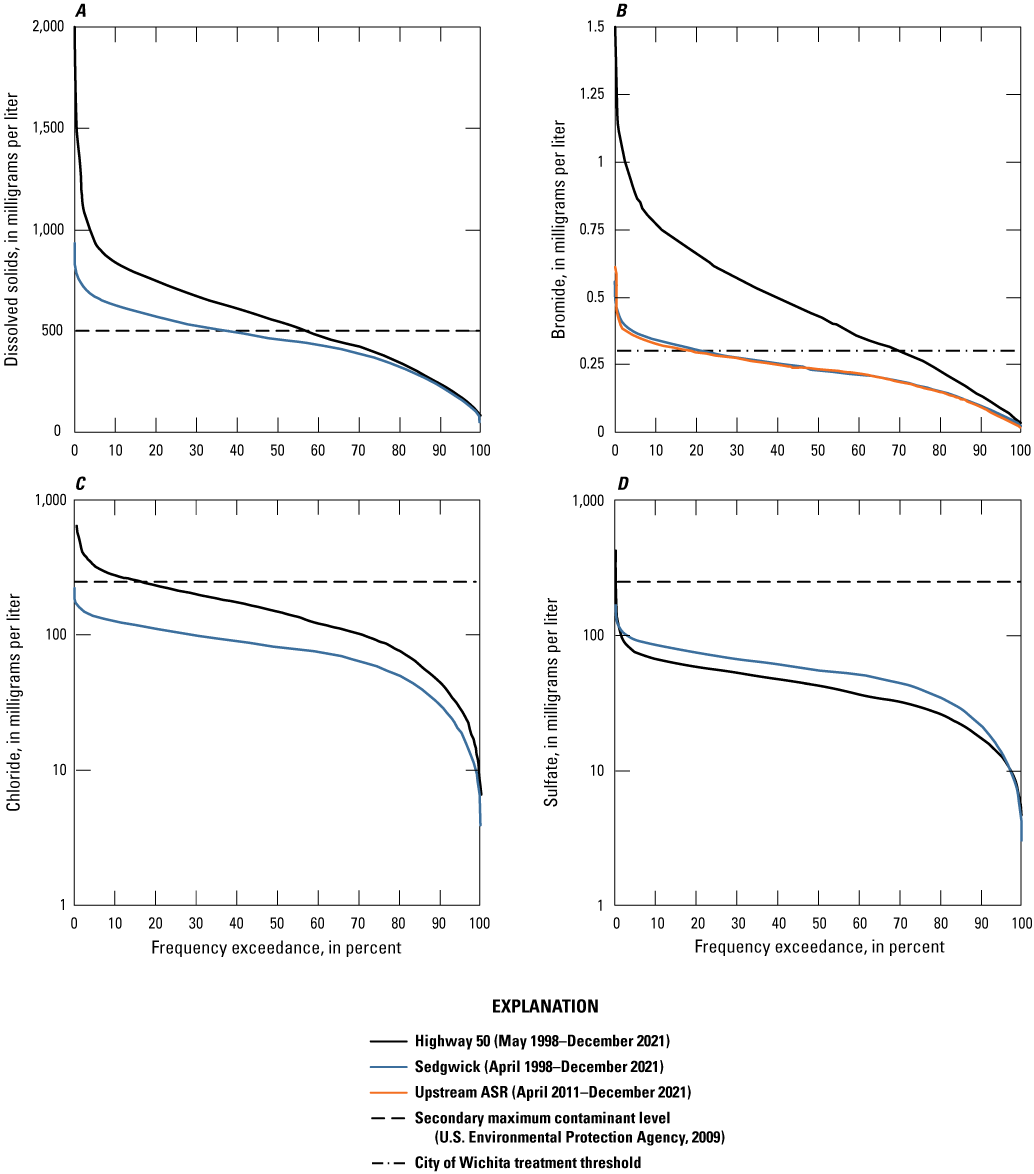
Duration curves for continuously (hourly) computed water-quality constituents for the Little Arkansas River at Highway 50 near Halstead, Kansas (Highway 50; U.S. Geological Survey [USGS] station 07143672, 1998–2021); near Sedgwick, Kans. (Sedgwick; USGS station 07144100, 1998–2021); and upstream of ASR Facility near Sedgwick, Kans. (Upstream ASR; USGS station 375350097262800, 2011–2021). A, Dissolved solids. B, Bromide. C, Chloride. D, Sulfate.
Bromide is a constituent of interest because of its potential for conversion to brominated organics of concern through drinking-water treatment processes. Bromate, a known carcinogen, can form during the disinfection of bromide-containing water that involves an oxidation process to kill pathogens (Xie, 2003; U.S. Environmental Protection Agency, 2009). Mean continuously computed bromide concentration during the study period was 0.44, 0.23, and 0.22 mg/L at the Highway 50, Sedgwick, and Upstream ASR sites, respectively (table 6). Computed bromide concentrations were larger at the Highway 50 site and exceeded the city of Wichita treatment threshold of 0.3 mg/L about 70, 21, and 19 percent of the time at the Highway 50, Sedgwick, and Upstream ASR sites, respectively (fig. 3B).
Chloride is of particular concern in the Equus Beds aquifer because of the chloride plume upgradient from the city of Wichita’s well field, which was estimated to be moving toward the well field at a rate of as much as 400 feet per year from 1990 through 2008. The plume is expected to continue moving toward the well field regardless of pumping in the area (Klager and others, 2014). Chloride concentrations significantly increased in two shallow monitoring wells near the phase II recharge basin after the onset of artificial recharge, and the increases likely were caused by treated and artificially recharged surface water (Stone and others, 2016). Large chloride concentrations (100 to 500 mg/L) are common in the western part of the study area and along the Arkansas River (fig. 1; Ziegler and others, 2010; Klager and others, 2014; Tappa and others, 2015; Stone and others, 2019). Mean Arkansas River chloride concentration was about 600 mg/L during 1988 through 1991 (Myers and others, 1996) and about 500 mg/L during 1997 through 2006 between Hutchinson and Maize, Kans. (Kansas Department of Health and Environment, 2006a). Little Arkansas River chloride sources include contamination from past oil and gas activity near McPherson, Kans., and industrial and municipal waste-water discharges (Leonard and Kleinschmidt, 1976; Kansas Department of Health and Environment, 2006a; Schmidt and others, 2007; Whittemore, 2007). Continuously computed chloride concentrations during the study period were larger at the Highway 50 site (mean: 156 mg/L) compared to the Sedgwick site (mean: 81 mg/L; table 6; fig. 3C). Chloride concentrations exceeded the EPA SMCL of 250 mg/L about 16 percent of the time at the Highway 50 site and did not exceed the SMCL at the Sedgwick site (table 6; fig. 3C).
Natural sources of sulfate in surface water and groundwater are rock weathering, oxidation of sulfide minerals, and biological processes (Hem, 1992). Anthropogenic sources of sulfate in water include atmospheric deposition from coal and petroleum combustion products (Hem, 1992) and irrigation return flows. Mean sulfate concentrations during the study period were 42 and 55 mg/L at the Highway 50 and Sedgwick sites, respectively (table 6). Computed sulfate concentrations never exceeded the EPA SMCL of 250 mg/L (table 6; fig. 3D).
Nutrients and Carbon
Nutrients, particularly nitrogen and phosphorus, have been identified as a primary cause of water-quality and biological degradation in the Midwest and the Nation (U.S. Environmental Protection Agency, 2000b, 2006c; Kansas Department of Health and Environment, 2004; Dubrovsky and others, 2010; Munn and others, 2018). Dissolved and particulate organic carbon are primary food sources for aquatic food webs. Organic carbon is of interest for ASR operation because of its role in THM formation during the water treatment process. THMs are disinfection byproducts that are formed when naturally existing inorganic and organic materials in water react with the disinfectants chlorine and chloramine (U.S. Environmental Protection Agency, 2005). THMs can cause liver, kidney, and central nervous system problems and are carcinogens (Pyne and others, 1996; U.S. Environmental Protection Agency, 2005). Excessive organic carbon in recharge water may lead to arsenic mobilization in groundwater owing to decreased oxygen from microbial respiration of organic carbon (U.S. Environmental Protection Agency, 2023).
Computed ammonia plus organic nitrogen concentrations were similar at the Highway 50 and Sedgwick sites during the study (table 6; fig. 4A). Mean computed ammonia plus organic nitrogen concentrations were 1.10 mg/L at the Highway 50 site and 1.14 mg/L at the Sedgwick site during the study period (table 6). Ammonia plus organic nitrogen concentrations exceeded the EPA level III ecoregion 27 guideline of 0.52 mg/L about 85 percent of the time at the Highway 50 site and 93 percent of the time at the Sedgwick site (fig. 4A). Total phosphorus concentrations were generally larger at the Sedgwick site (table 6; fig. 4B). Mean continuously computed total phosphorus concentrations were 0.47 mg/L at the Highway 50 site and 0.61 mg/L at the Sedgwick site (table 6). Total phosphorus concentrations during the study period exceeded the EPA level III ecoregion 27 guideline of 0.09 mg/L nearly 100 percent of the time at the Highway 50 site and 100 percent of the time at the Sedgwick site (fig. 4B). Continuous total organic carbon concentrations were generally larger at the Highway 50 site (table 6, fig. 4C). Mean total organic carbon concentrations were 9.2 mg/L at the Highway 50 site, 8.3 mg/L at the Sedgwick site, and 8.1 mg/L at the Upstream ASR site (table 6).
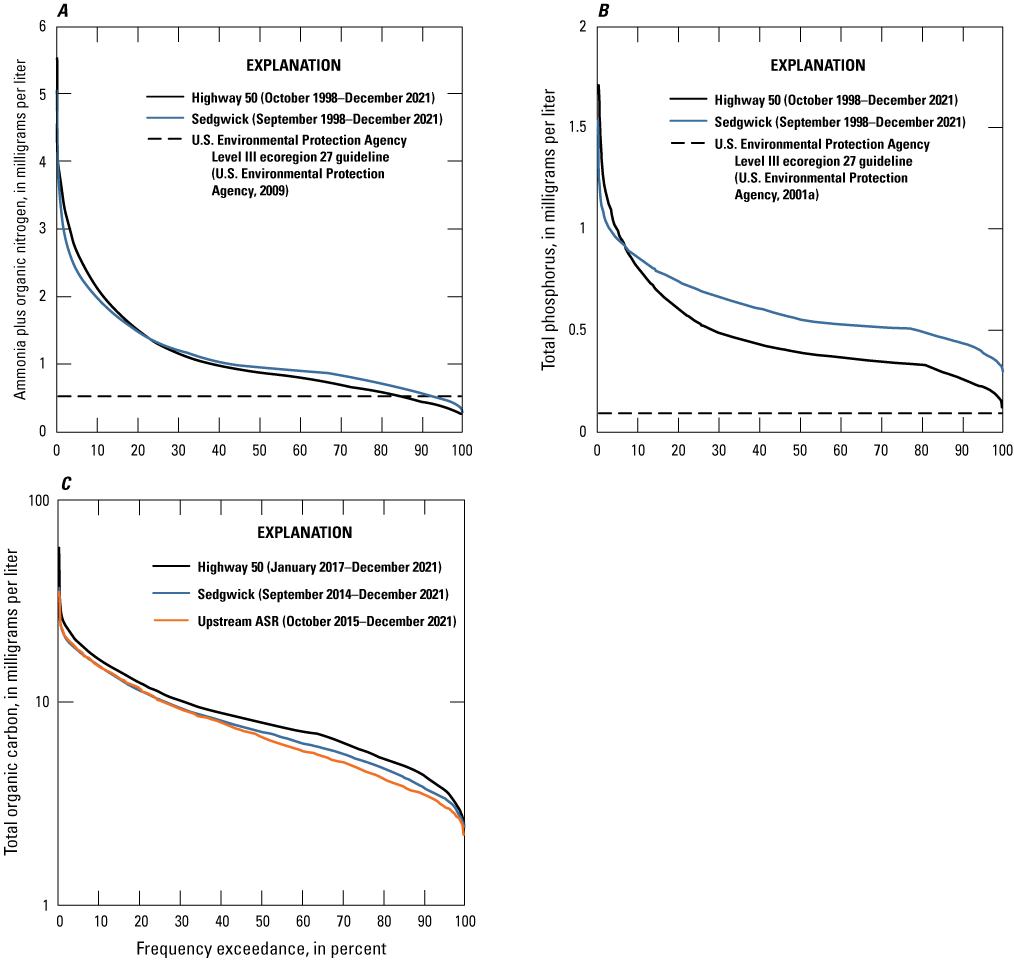
Duration curves for continuously (hourly) computed water-quality constituents for the Little Arkansas River at Highway 50 near Halstead, Kansas (Highway 50; U.S. Geological Survey [USGS] station 07143672, 1998–2021); near Sedgwick, Kans. (Sedgwick; USGS station 07144100, 1998–2021); and upstream of ASR Facility near Sedgwick, Kans. (Upstream ASR; USGS station 375350097262800, 2015–21). A, Ammonia plus organic nitrogen. B, Total phosphorus. C, Total organic carbon.
Sediment
Continuously computed suspended solids and suspended-sediment concentration ranges and means were similar between the Highway 50 and Sedgwick sites during the study (table 6; fig. 5). Mean suspended solids concentrations were 101 mg/L at the Highway 50 site and 94 mg/L at the Sedgwick site (table 6). Mean suspended-sediment concentrations were 134 and 129 mg/L at the Highway 50 and Sedgwick sites, respectively (table 6).
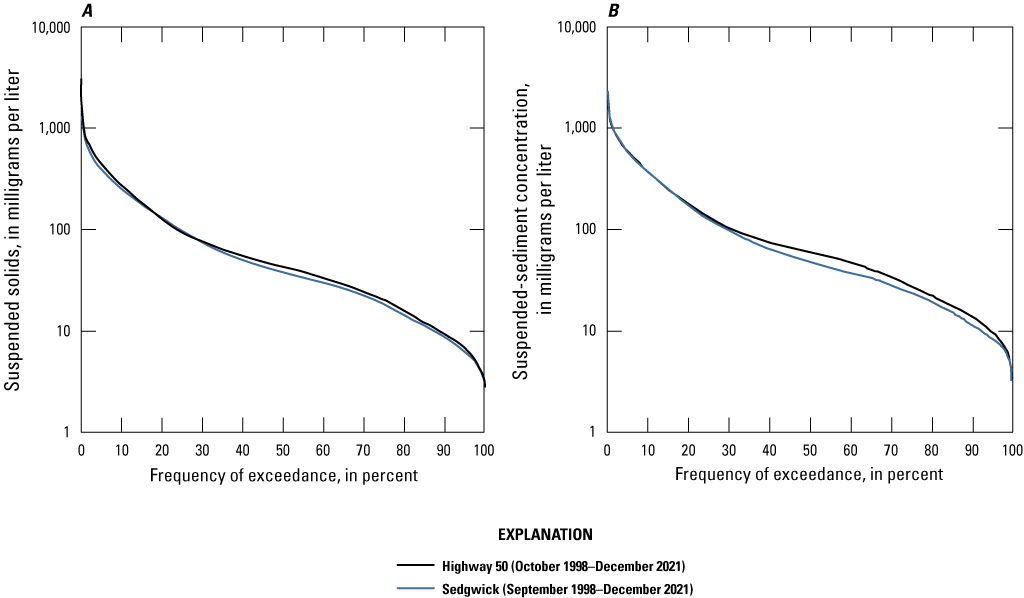
Duration curves for continuously (hourly) computed water-quality constituents for the Little Arkansas River at Highway 50 near Halstead, Kansas (Highway 50; U.S. Geological Survey [USGS] station 07143672), and Little Arkansas River near Sedgwick, Kans. (Sedgwick; USGS station 07144100), 1998–2021. A, Suspended solids, B, Suspended-sediment concentration.
Indicator Bacteria
Continuously computed E. coli and fecal coliform bacteria density means were larger at the Sedgwick site during the study period (table 6, fig. 6A). Median study period E. coli densities were 330 cfu/100 mL at the Highway 50 site and 230 cfu/100 mL at the Sedgwick site (table 6). E. coli densities exceeded the Kansas Department of Health and Environment primary contact criterion for Class B recreation of 262 cfu/100 mL during April 1 through October 31 (Kansas Department of Health and Environment, 2017) 84 percent of the time at the Highway 50 site and 62 percent of the time at the Sedgwick site during the months of April through October (fig. 6B). E. coli densities exceeded the Kansas Department of Health and Environment primary contact criterion for Class B recreation during November 1 through March 31 and secondary contact criterion for Class A recreation of 2,358 cfu/100 mL 5 percent of the time at the Highway 50 site and 6 percent of the time at the Sedgwick site during the months of November through March (fig. 6C). Median fecal coliform bacteria densities were 420 and 310 cfu/100 mL at the Highway 50 and Sedgwick sites, respectively (table 6).
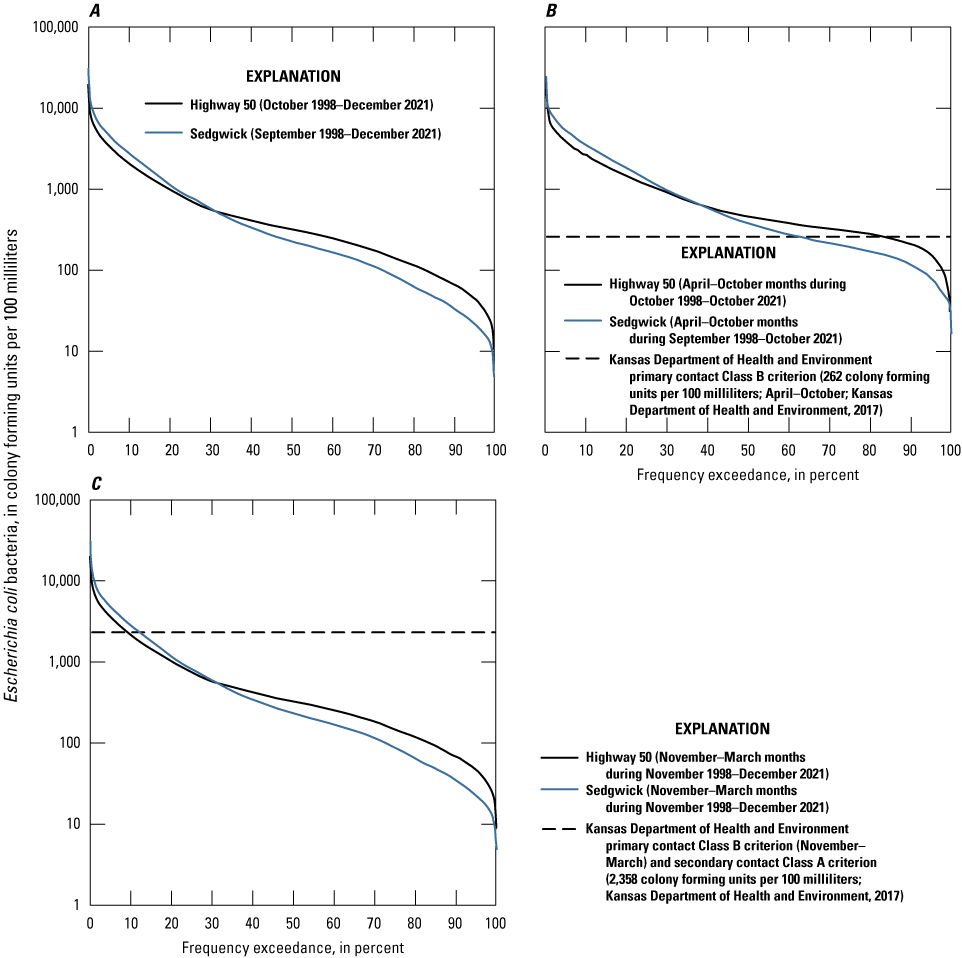
Duration curves for continuously (hourly) computed Escherichia coli bacteria densities for the Little Arkansas River at Highway 50 near Halstead, Kansas (Highway 50; U.S. Geological Survey [USGS] station 07143672), and Little Arkansas River near Sedgwick, Kans. (Sedgwick; USGS station 07144100), 1998–2021. A, Escherichia coli bacteria densities for the entire study period. B, Escherichia coli bacteria densities, April–October. C, Escherichia coli bacteria densities, November–March.
Arsenic mobility is generally controlled by adsorption and desorption reactions and solid-phase precipitation and dissolution reactions (Hem, 1992; Hinkle and Polette, 1999; Smedley and Kinniburgh, 2002; McMahon and Chapelle, 2008); these processes are affected by pH, oxidation/reduction reactions, and competing anion presence, all of which could be altered because of artificial recharge activities. The EPA Federal MCL for arsenic is 10 µg/L (U.S. Environmental Protection Agency, 2009). Arsenic is a constituent of concern in the Equus Beds aquifer and commonly is present in concentrations that exceed the MCL (Ziegler and others, 2010; Tappa and others, 2015; Stone and others, 2019). Dissolved arsenic concentrations in two shallow monitoring wells near the ASR phase II recharge basin increased significantly after the onset of phase II ASR activity (Stone and others, 2016). Continuously computed arsenic concentrations were generally similar between the Highway 50 and Sedgwick sites during the study period (table 6; fig. 7A). Mean arsenic concentrations were 6.8 µg/L at the Highway 50 site and 6.4 µg/L at the Sedgwick site (table 6). Continuous arsenic concentrations exceeded the Federal MCL 15 percent of the time at the Highway 50 site and 9 percent of the time at the Sedgwick site (fig. 7A).
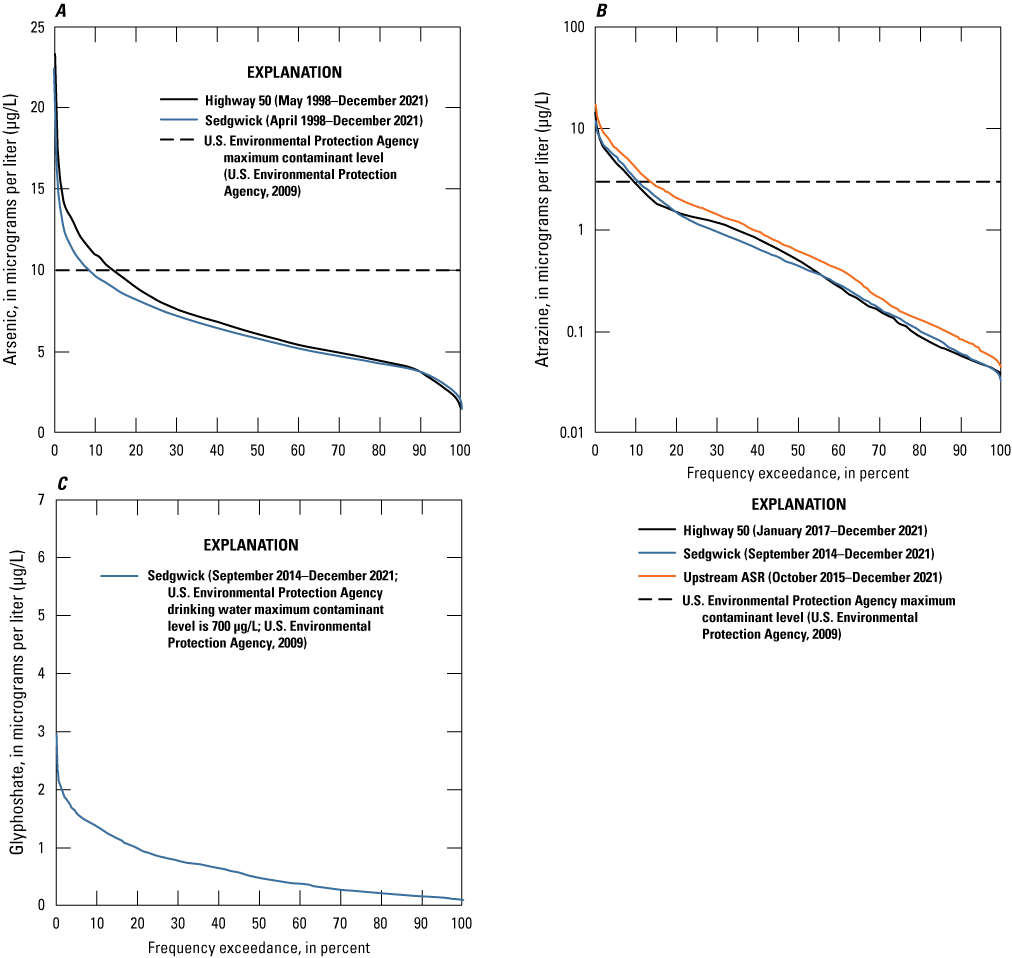
Duration curves for continuously (hourly) computed water-quality constituents for the Little Arkansas River at Highway 50 near Halstead, Kansas (Highway 50; U.S. Geological Survey [USGS] station 07143672, 1998–2021); Little Arkansas River near Sedgwick, Kans. (Sedgwick; USGS station 07144100, 1998–2021); and Little Arkansas River upstream of ASR Facility near Sedgwick, Kans. (Upstream ASR; USGS station 375350097262800, 2015–21). A, Arsenic. B, Atrazine. C, Glyphosate.
Atrazine and glyphosate are pesticides that are commonly detected at the Little Arkansas sites (Ziegler and others, 2010; Tappa and others, 2015; Stone and others, 2016, 2019; Stone and Klager, 2022). The EPA MCL is 3.0 µg/L for atrazine and 700 µg/L for glyphosate, and both compounds can cause reproductive difficulties in humans (U.S. Environmental Protection Agency, 2009). Continuously computed atrazine concentrations were largest at the Upstream ASR site (table 6; fig. 7B). Mean computed atrazine concentrations at the Highway 50, Sedgwick, and Upstream ASR sites were 1.10 µg/L, 1.12 µg/L, and 1.49 µg/L, respectively (table 6). Atrazine concentrations exceeded the MCL 10 percent of the time at the Highway 50 and Sedgwick sites and 14 percent of the time at the Upstream ASR site during the study (fig. 7B). Computed glyphosate at the Sedgwick site ranged from 0.108 to 5.81 µg/L during the study period and never exceeded the MCL (table 6; fig. 7C).
Computed Water-Quality Constituent Loads and Yields
Annual streamflow volume was smallest in 2006 and largest in 2019 (table 7, fig. 8A). The smallest annual streamflow volume was 9,330 acre-feet (acre-ft) at the Highway 50 site and 22,700 acre-ft at the Sedgwick site (table 7). The largest streamflow volume was 419,000 acre-ft at the Highway 50 site and 725,000 acre-ft at the Sedgwick site (table 7). Kansas experienced several record-breaking hydrologic conditions during 2019, including the most precipitation within a month on record (Davis, 2020).
Table 7.
Computed annual streamflow volumes and water-quality constituent loads and yields for the Little Arkansas River at Highway 50 near Halstead, Kansas (Highway 50; U.S. Geological Survey [USGS] station 07143672), and Little Arkansas River near Sedgwick, Kans. (Sedgwick; USGS station 07144100), 1995–2021.[--, not applicable. All loads and yields are estimated. Water-quality constituent loads are expressed in tons and yields are expressed in pounds per square mile. Streamflow volumes are expressed in acre-feet and yields are expressed in acre-feet per acre]
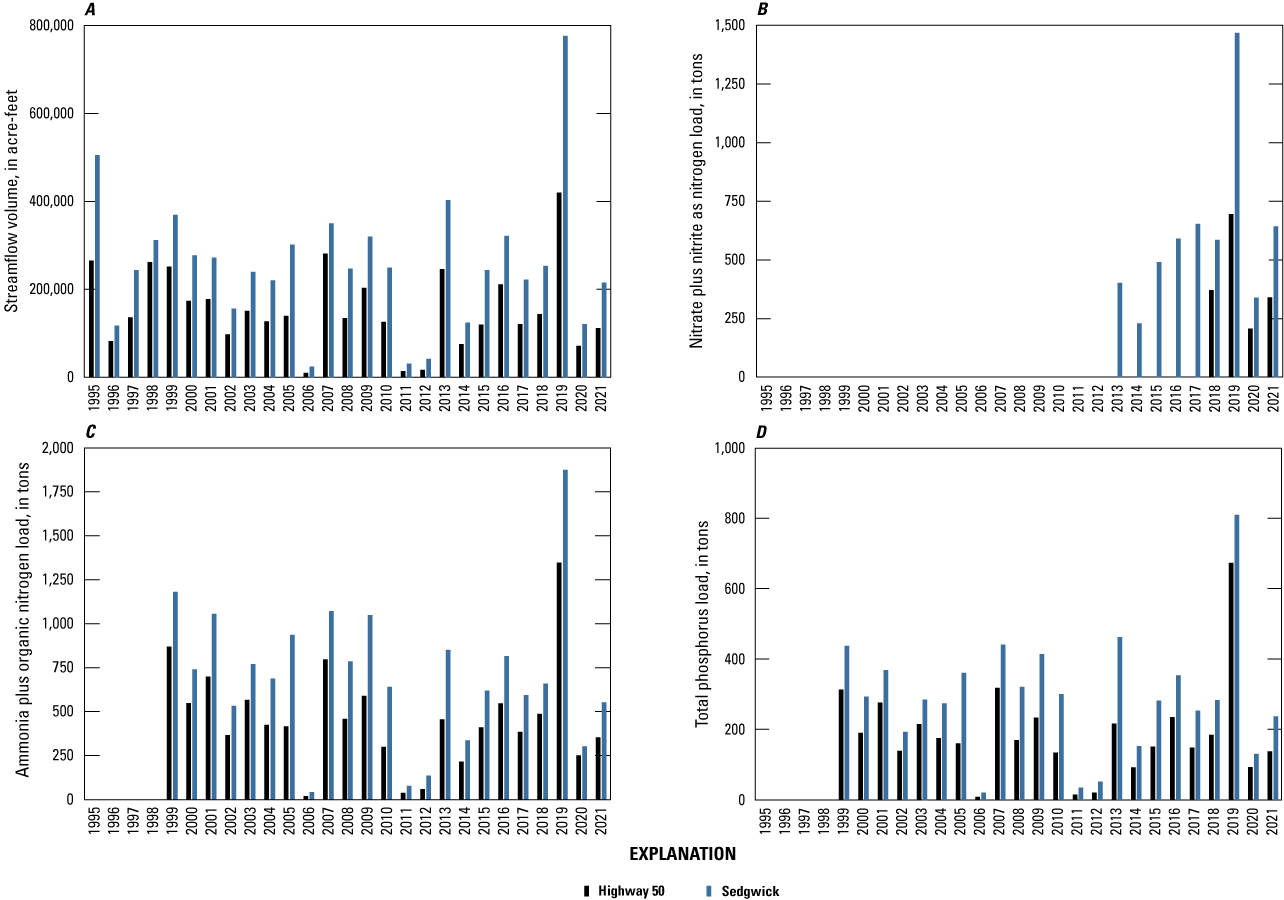
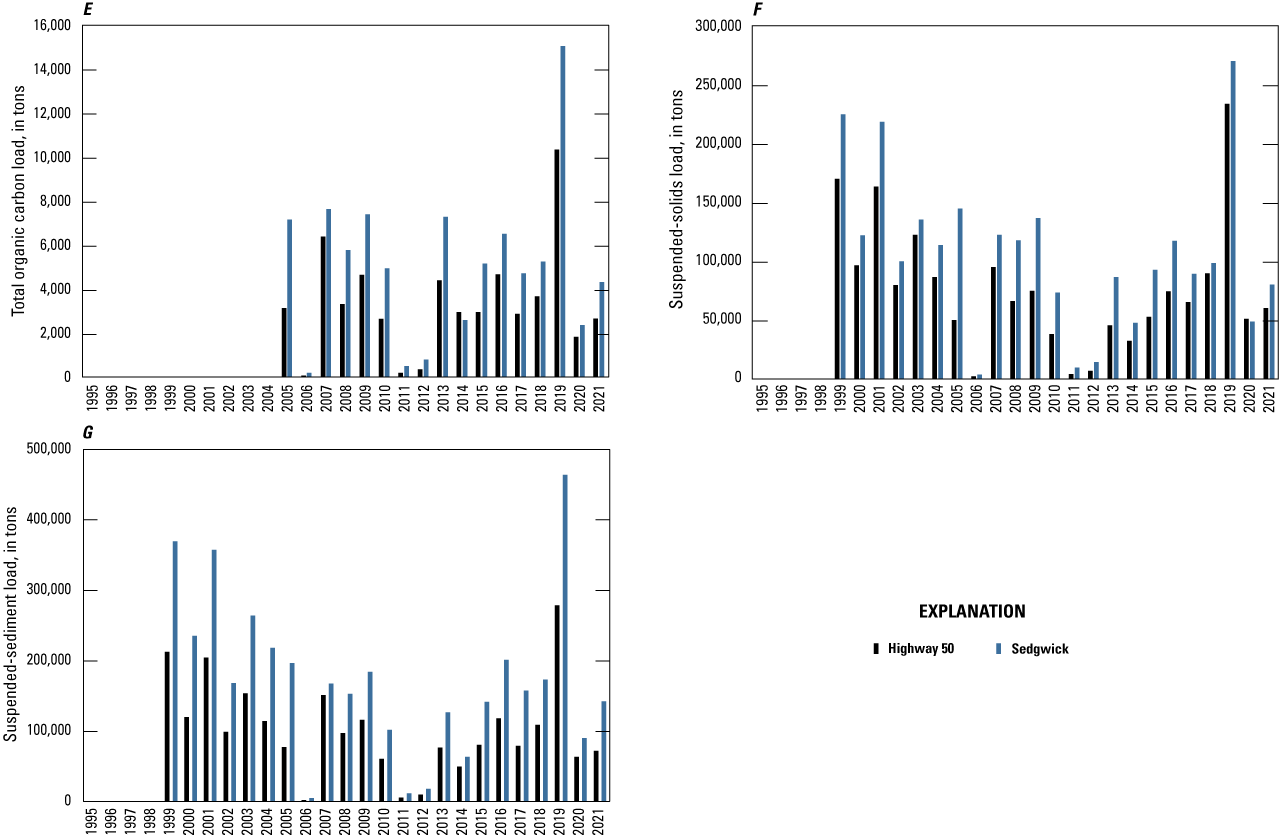
Yearly water-quality constituent loads for the Little Arkansas River at Highway 50 near Halstead, Kansas (Highway 50; U.S. Geological Survey [USGS] station 07143672), and Little Arkansas River near Sedgwick, Kans. (Sedgwick; USGS station 07144100), 1995–2021. A, Streamflow. B, Nitrate plus nitrite as nitrogen. C, Ammonia plus organic nitrogen. D, Total phosphorus. E, Total organic carbon. F, Suspended solids. G, Suspended sediment.
Agricultural practices in the watershed, including fertilizer application, likely contributed a substantial amount of the Little Arkansas River nitrate plus nitrite load during the study period. Nitrate plus nitrite loads were computed during 2018 through 2021 at the Highway 50 site and 2013 through 2021 at the Sedgwick site. Mean annual nitrate plus nitrite loads at the Highway 50 and Sedgwick sites were 403 and 599 tons, respectively (table 7). The total nitrate plus nitrite loads were 1,610 tons at the Highway 50 site and 5,390 tons at the Sedgwick site (table 7). The nitrate plus nitrite load was largest in 2019 at the Highway 50 (694 tons) and Sedgwick (1,470 tons) sites (fig. 8B, table 7). Nitrate plus nitrite yield was 2,030 pounds per square mile (lbs/mi2) at the Highway 50 site and 2,520 lbs/mi2 at the Sedgwick site in 2019 (table 7). Mean annual ammonia plus organic nitrogen loads at the Highway 50 and Sedgwick sites were 457 and 704 tons, respectively (table 7). Ammonia plus organic nitrogen loads for 1999 through 2021 were 10,500 tons at the Highway 50 site and 16,200 tons at the Sedgwick site (table 7). Ammonia plus organic nitrogen loads at both Little Arkansas River study sites were smallest in 2006 and largest in 2019 (fig. 8C, table 7). The ammonia plus organic nitrogen load in 2019 was 1,340 tons (13 percent of total load) at the Highway 50 site and 1,870 tons (12 percent of total load) at the Sedgwick site (fig. 8C, table 7).
Agricultural practices in the watershed also likely contributed a substantial amount of the Little Arkansas River total phosphorus load during the study period. In Kansas, about 75 to 90 percent of phosphorus movement into surface water is particulate phosphorus associated with soil erosion and transport (Devlin and others, 2000). Total phosphorus is listed as an impairment for aquatic life in the study area (Kansas Department of Health and Environment, 2022). Mean annual total phosphorus loads at the Highway 50 and Sedgwick sites were 178 and 292 tons, respectively (table 7). The total phosphorus load during 1999 through 2021 was 4,090 tons at the Highway 50 site and 6,710 tons at the Sedgwick site (table 7). Annual total phosphorus loads at the Highway 50 and Sedgwick sites were smallest in 2006 and largest in 2019 (fig. 8D, table 7). Total phosphorus load in 2019 was 519 tons (13 percent of total load) at the Highway 50 site and 808 tons (12 percent of total load) at the Sedgwick site (fig. 8D, table 7). Total phosphorus yield was 1,520 lbs/mi2 at the Highway 50 site and 1,390 lbs/mi2 at the Sedgwick site in 2019 (table 7). Total phosphorus yields for this study during 1999 through 2019 were 12,000 lbs/mi2 at the Highway 50 site and 11,500 lbs/mi2 at the Sedgwick site (table 7).
Mean annual total organic carbon loads at the Highway 50 and Sedgwick sites were 3,340 and 5,210 tons, respectively (table 7). The total organic carbon load during 2005 through 2021 was 56,800 tons at the Highway 50 site and 88,500 at the Sedgwick site (fig. 8E, table 7). Annual total organic carbon loads at both Little Arkansas River sites were smallest in 2006 and largest in 2019 (fig. 8E, table 7). Annual total organic carbon loads at the Highway 50 and Sedgwick sites were 119 and 266 tons in 2006, respectively, and 10,400 tons and 15,100 tons in 2019, respectively (fig. 8E, table 7). Mean annual total organic carbon yields at the Highway 50 and Sedgwick sites were 9,760 and 8,940 lbs/mi2, respectively (table 7). Little Arkansas River total organic carbon yield was 30,300 lbs/mi2 at the Highway 50 site and 25,900 lbs/mi2 at the Sedgwick site in 2019 (table 7).
Kansas reservoirs are continually losing storage capacity because of sedimentation (Kansas Water Office, 2022). Suspended solids are listed as an impairment for aquatic life in the study area (Kansas Department of Health and Environment, 2022). Mean suspended-solids loads at the Highway 50 and Sedgwick sites were 77,000 and 108,000 tons, respectively (table 8). Little Arkansas River suspended-solids load during 1999 through 2021 was 1,770,000 tons at the Highway 50 site and 2,480,000 tons at the Sedgwick site (fig. 8F, table 8). Annual suspended-solids loads at both Little Arkansas River sites were smallest in 2006 and largest in 2019 (fig. 8F, table 8). Annual suspended-solids loads at the Highway 50 and Sedgwick sites were 2,550 and 3,770 tons in 2006, respectively, and 234,000 and 271,000 tons in 2019, respectively (fig. 8F, table 8). Mean annual suspended-solids yields at the Highway 50 and Sedgwick sites were 224,000 and 185,000 lbs/mi2, respectively (table 8). Little Arkansas River suspended-solids yields were 683,000 lbs/mi2 at the Highway 50 site and 466,000 lbs/mi2 at the Sedgwick site in 2019 (table 8).
Table 8.
Computed annual water-quality constituent loads and yields for the Little Arkansas River at Highway 50 near Halstead, Kansas (Highway 50; U.S. Geological Survey [USGS] station 07143672), and Little Arkansas River near Sedgwick, Kans. (Sedgwick; USGS station 07144100), 1995–2021.[--, not applicable. All loads and yields are estimated. Water-quality constituent loads are expressed in tons and yields are expressed in pounds per square mile, except for bacteria. Bacteria loads are expressed in trillions of colony forming units and yields are expressed in trillions of colony forming units per square mile]
Mean annual suspended-sediment loads at the Highway 50 and Sedgwick sites were 102,000 and 177,000 tons, respectively (table 8). The total Little Arkansas River suspended-sediment load during 1999 through 2021 was 2,340,000 tons at the Highway 50 site and 4,060,000 tons at the Sedgwick site (fig. 8G, table 8). Annual suspended-sediment loads at both Little Arkansas River sites were smallest in 2006 and largest in 2019 (fig. 8G, table 8). Annual suspended-sediment loads at the Highway 50 and Sedgwick sites were 2,010 and 4,610 tons in 2006, respectively, and 279,000 and 464,000 tons in 2019, respectively (fig. 8G, table 8). Mean annual suspended-sediment yields at the Highway 50 and Sedgwick sites were 297,000 and 303,000 lbs/mi2, respectively (table 8). Little Arkansas River suspended-sediment yield was 814,000 lbs/mi2 at the Highway 50 site and 797,000 lbs/mi2 at the Sedgwick site in 2019 (table 8).
About one-quarter to one-half of the study period loads, including nutrients and sediment, were transported during 1 percent of the time during the study (with the exception of chloride loads, which were about one-tenth). About 38 to 40 percent of the total Little Arkansas River suspended-sediment load at the Highway 50 and Sedgwick sites during 1999 through 2021 was transported in the top 1 percent of loading days during high-flow events. Similar studies of the nearby North Fork Ninnescah River have also demonstrated that high-flow events are the main carriers for sediment (Stone and others, 2015; Kramer and others, 2021). Because streamflows are highly sensitive to climatic variation and change (Carlisle and others, 2019) and an increase of extreme precipitation events in the Great Plains is expected (Shafer and others, 2014; Conant and others, 2018; Kloesel and others, 2018), similar disproportionately large pollutant loading events may increase in the future.
Weighted Regressions on Time, Discharge, and Season Models
Little Arkansas River water-quality data collected during 1995 (Sedgwick site) or 1996 (Highway 50 site) through 2021 were analyzed for temporal trends and included primary ions, nutrient and carbon species, sediment, indicator bacteria, and trace elements. Changes in annual flow-normalized water-quality concentrations and fluxes were computed for the entire study period (1995 or 1996 through 2021), the period before ASR (phase I) operation onset (1995 or 1996 through 2006; hereafter referred to as “before ASR”), and the period after ASR (phase I) onset (2007 through 2021; hereafter referred to as “after ASR”). The delineation of trend periods does not indicate that ASR activities were the causes of water-quality trends and were selected solely as a convenient way of organizing trend reporting. WRTDS annual mean water-quality constituent concentrations and fluxes are presented in appendixes 7 and 8. WRTDS model evaluation and WBT output for each water-quality constituent are provided in appendixes 9 (Highway 50 site) and 10 (Sedgwick site). Estimated mean annual concentrations with flow-normalized trendlines and 90-percent confidence intervals are presented in figures 9 through 13; larger confidence intervals at the beginning and end of the study period are because of larger streamflow and time uncertainty (Hirsch and others, 2015). Flow-normalized values indicate the overall water-quality constituent trend for the time period irrespective of annual streamflow variability and water-quality trend results incorporate the trend direction uncertainty among years; large flow-normalized water-quality constituent concentration and flux percentage changes may not be reflected in the trend results. WRTDS-estimated yearly water-quality constituent loads are provided in appendix 11.
Primary Ion Trends
Little Arkansas River flow-normalized primary ion concentrations during 1995 through 2021 (fig. 9A–K) generally had downward trends based on categories defined by Hirsch and others (2015; table 2); percent decreases in flow-normalized concentrations were generally larger at the Highway 50 site (table 8). Dissolved solids, potassium, sodium, chloride, and fluoride flow-normalized concentrations (fig. 9B, E, F, H, I) were very likely or highly likely to have downward trends at both sites (table 9). Dissolved solids mean annual concentrations decreased by 30 percent (Highway 50 site) and 15 percent (Sedgwick site); sodium concentrations decreased by 49 percent (Highway 50 site) and 32 percent (Sedgwick site); and chloride concentrations decreased by 54 percent (Highway 50 site) and 43 percent (Sedgwick site) during the study period (table 9). Hardness, calcium, and magnesium flow-normalized concentrations (fig. 9A, C, D) had downward trends at the Highway 50 site and no trend at the Sedgwick site for the entire study period (table 9). Bromide and silica flow-normalized concentrations (fig. 9G, J) exhibited no trend at the Highway 50 site and downward trends at the Sedgwick site from 1995 through 2021 (table 9). Bromide concentrations decreased by 68 percent at the Highway 50 site and 45 percent at the Sedgwick site during the study period (table 9). Flow-normalized sulfate concentrations (fig. 9K) during the entire study period exhibited a downward trend (and a decrease of 10 percent) at the Highway 50 site and an upward trend (and an increase of 7 percent) at the Sedgwick site (table 9).
Table 9.
Weighted Regressions on Time, Discharge, and Season bootstrap test and trend change summary results for the Little Arkansas River at Highway 50 near Halstead, Kansas (Highway 50; U.S. Geological Survey [USGS] station 07143672), and Little Arkansas River near Sedgwick, Kans. (Sedgwick; USGS station 07144100), 1995–2021.[CaCO3, calcium carbonate; USGS, U.S. Geological Survey; mg/L, milligram per liter; --, not applicable; tons/yr, tons per year]
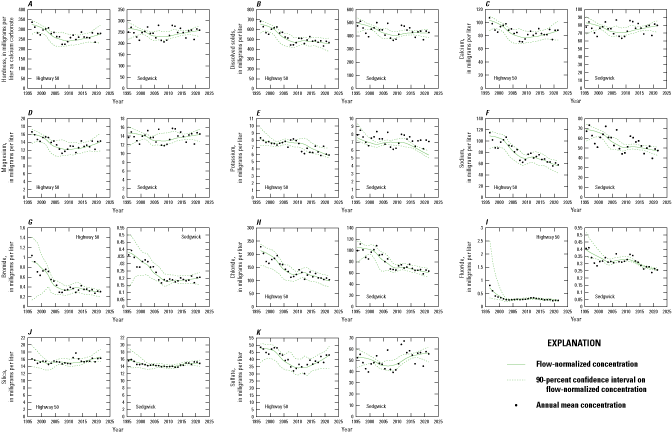
Weighted Regressions on Time, Discharge, and Season annual mean concentrations with flow-normalized concentration trend and 90-percent confidence interval for constituents at the Little Arkansas River at Highway 50 near Halstead, Kansas (Highway 50; U.S. Geological Survey [USGS] station 07143672), and Little Arkansas River near Sedgwick, Kans. (Sedgwick; USGS station 07144100), 1995–2021. A, Hardness. B, Dissolved solids. C, Calcium. D, Magnesium. E, Potassium. F, Sodium. G, Bromide. H, Chloride. I, Fluoride. J, Silica. K, Sulfate.
Hardness, calcium, magnesium, silica, and sulfate flow-normalized concentrations had before-ASR downward trends and after-ASR upward trends at both study sites, whereas potassium, sodium, chloride, and fluoride flow-normalized concentrations had downward trends at each site for both periods (table 9). Dissolved solids flow-normalized concentrations had a before-ASR downward trend and no trend after ASR at the Highway 50 site. At the Sedgwick site, dissolved solids flow-normalized concentrations had a before-ASR downward trend and an after-ASR upward trend (table 9). Bromide flow-normalized concentrations had no trend before ASR at the Highway 50 site and after ASR at the Sedgwick site and a downward trend after ASR at the Highway 50 site and before ASR at the Sedgwick site (table 9).
Little Arkansas River flow-normalized primary ion fluxes during 1995 through 2021 generally had downward trends (table 9). Dissolved solids, potassium, sodium, bromide, chloride, and fluoride flow-normalized study period fluxes had downward trends at both study sites (table 9). Hardness, calcium, and sulfate flow-normalized fluxes had no trend at the Highway 50 site and an upward trend at the Sedgwick site for the study period (table 9). Magnesium flow-normalized flux had a study period downward trend at the Highway 50 site and an upward trend for the Sedgwick site and silica flow-normalized flux for the study period had no trend at either site (table 9).
Nutrient and Carbon Species Trends
Little Arkansas River flow-normalized nutrient and carbon species concentrations during 1995 through 2021 (fig. 10A–K) generally had downward trends, and concentration percent decreases were generally larger at the Sedgwick site (table 10). Flow-normalized ammonia plus organic nitrogen concentrations during 2000 through 2021 (fig. 10B) had downward trends that were highly likely at both sites; ammonia plus organic nitrogen concentrations decreased by 18 percent at the Highway 50 site and 23 percent at the Sedgwick site (table 10). Nitrate plus nitrite flow-normalized concentrations during the study period (fig. 10C) had an upward trend at the Highway 50 site and a downward trend at the Sedgwick site; both trends were highly likely (table 10). Flow-normalized total nitrogen concentrations during 2000 through 2021 (fig. 10D) had no trend at the Highway 50 site and a downward trend at the Sedgwick site; total nitrogen concentrations decreased by 1 percent at the Highway 50 site and 38 percent at the Sedgwick site (table 10). Ammonia, nitrate, and nitrite flow-normalized concentrations during the study period (fig. 10A, E, F) had downward trends at the Sedgwick site; of these, ammonia had a downward trend that was highly likely (table 10). Ammonia plus organic nitrogen flow-normalized concentrations had a before-ASR upward trend and an after-ASR downward trend at both sites (table 10). Nitrate plus nitrite flow-normalized concentrations had before- and after-ASR upward trends at the Highway 50 site, no before-ASR trend at the Sedgwick site, and an after-ASR downward trend at the Sedgwick site (table 10). Total nitrogen flow-normalized concentrations had before-ASR trends that were upward for the Highway 50 site and downward for the Sedgwick site and after-ASR trends that were downward at both sites (table 10). Ammonia and nitrate flow-normalized concentrations at the Sedgwick site had no trend before ASR and a downward trend after ASR (table 10). Nitrite concentrations at the Sedgwick site had a downward trend before and after ASR (table 10).
Table 10.
Weighted Regressions on Time, Discharge, and Season bootstrap test and trend change summary results for the Little Arkansas River at Highway 50 near Halstead, Kansas (Highway 50; U.S. Geological Survey [USGS] station 07143672), and Little Arkansas River near Sedgwick, Kans. (Sedgwick; USGS station 07144100), 1995–2021.[USGS, US Geological Survey; mg/L, milligram per liter; yr, year; --, not applicable; cfu/100 mL, colony forming units per 100 milliliters]
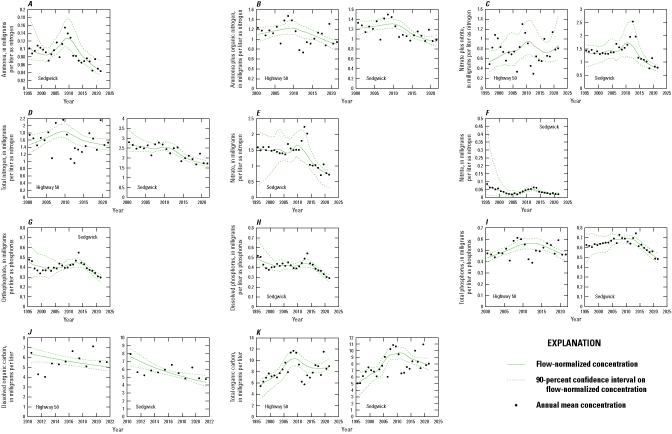
Weighted Regressions on Time, Discharge, and Season annual mean concentrations with flow-normalized concentration trend and 90-percent confidence interval for constituents at the Little Arkansas River at Highway 50 near Halstead, Kansas (Highway 50; U.S. Geological Survey [USGS] station 07143672), and Little Arkansas River near Sedgwick, Kans. (Sedgwick; USGS station 07144100), 1995–2021. A, Ammonia. B, Ammonia plus organic nitrogen. C, Nitrate plus nitrite. D, Total nitrogen. E, Nitrate. F, Nitrite. G, Orthophosphate. H, Dissolved phosphorus. I, Total phosphorus. J, Dissolved organic carbon. K, Total organic carbon.
Flow-normalized orthophosphate concentrations had no trend before ASR and a downward trend after ASR at the Sedgwick site (table 10). Flow-normalized dissolved phosphorus concentrations had a downward trend before ASR and after ASR at the Sedgwick site (table 10). Flow-normalized total phosphorus concentrations for the study period (2000 through 2021 for the Highway 50 site and 1995 through 2021 for the Sedgwick site; fig. 10I) had a likely upward trend at the Highway 50 site and a likely downward trend at the Sedgwick site (table 10). Orthophosphate and dissolved phosphorus flow-normalized concentrations for the study period (fig. 10G, H) had downward trends that were either very or highly likely (table 10). Flow-normalized total phosphorus concentrations had a before-ASR upward trend and an after-ASR downward trend at both sites (table 10).
Dissolved organic carbon flow-normalized concentrations at the Highway 50 and Sedgwick sites during 2010 through 2021 (fig. 10J) had downward trends that were very likely or highly likely (table 10). Dissolved organic carbon concentrations decreased by 20 percent at the Highway 50 site and 43 percent at the Sedgwick site during 2010 through 2021 (table 10). Total organic carbon flow-normalized concentrations during the study period (fig. 10K) had upward trends that were highly likely at both study sites. Total organic carbon concentrations increased 53 percent at the Highway 50 site and 52 percent at the Sedgwick site during the study period (table 10). Total organic carbon flow-normalized concentrations had a before-ASR upward trend and an after-ASR downward trend at both sites (table 10).
Little Arkansas River flow-normalized nutrient and carbon species fluxes during 1995 through 2021 generally had upward trends (table 10). Ammonia plus organic nitrogen flow-normalized fluxes during the study period had an upward trend at the Highway 50 site and no trend at the Sedgwick site (table 10). Nitrate plus nitrite fluxes during the study period had upward trends at both sites and increased 77 percent at the Highway 50 site and 53 percent at the Sedgwick site (table 10). Study period flow-normalized total nitrogen fluxes had no trend at the Highway 50 site and an upward trend at the Sedgwick site (table 10). Study period ammonia and nitrate fluxes had upward trends and the nitrite flux had a downward trend at the Sedgwick site (table 10). Before- and after-ASR ammonia plus organic nitrogen fluxes had no trends at the Highway 50 site and had upward and downward trends, respectively, at the Sedgwick site (table 10). Before-ASR nitrate plus nitrite fluxes had upward trends at both sites and after-ASR nitrate plus nitrite fluxes had no trend at the Highway 50 site and an upward trend at the Sedgwick site (table 10). Before- and after-ASR total nitrogen flow-normalized fluxes had upward trends and no trends, respectively, at both sites (table 10). Sedgwick site ammonia flow-normalized fluxes had an upward trend before ASR and a downward trend after ASR. Nitrate fluxes at the Sedgwick site had no before-ASR trend and an after-ASR upward trend. Nitrite fluxes at the Sedgwick site had downward trends for both time periods (table 10).
Study period flow-normalized total phosphorus fluxes had upward trends at both study sites (table 10). Sedgwick site orthophosphate and dissolved phosphorus fluxes during the study period had an upward trend and no trend, respectively (table 10). Orthophosphate fluxes increased by 57 percent during the study period at the Sedgwick site (table 10). Total phosphorus flow-normalized fluxes had upward trends at both sites before ASR; after-ASR total phosphorus fluxes had no trend at the Highway 50 site and a downward trend at the Sedgwick site (table 10). Sedgwick site flow-normalized orthophosphate fluxes before and after ASR had upward trends (table 10). Dissolved phosphorus fluxes at the Sedgwick site had no before-ASR trend and an upward trend after ASR (table 10).
Flow-normalized dissolved organic carbon fluxes during the study period had downward trends at the Highway 50 and Sedgwick sites with respective decreases of 31 and 24 percent (table 10). Total organic carbon fluxes during the study period had upward trends that were highly likely at both sites. Total organic carbon fluxes increased by 125 percent at the Highway 50 site and 162 percent at the Sedgwick site during the study period (table 10). Both sites had total organic carbon fluxes with upward trends for the before- and after-ASR time periods (table 10).
Sediment Trends
Little Arkansas River sediment concentration and flux trends were generally inconsistent among study sites and time periods (fig. 11; table 10). Little Arkansas River flow-normalized suspended-solids concentrations during the study period (fig. 11A) had a downward trend at the Highway 50 site and no trend at the Sedgwick site; suspended-solids concentrations decreased 12 percent at the Highway 50 site and increased 5 percent at the Sedgwick site (table 10). Study period flow-normalized suspended-sediment concentrations (fig. 11B) had an upward trend at the Highway 50 site and no trend at the Sedgwick site; suspended-sediment concentrations increased 8 percent at the Highway 50 site and decreased 7 percent at the Sedgwick site (table 10). Suspended-solids concentrations had a downward trend at the Highway 50 site and no trend at the Sedgwick site during the before-ASR period (table 10). Suspended-solids concentrations had no trends at either site during the after-ASR period (table 10). Suspended-sediment concentrations had upward trends during the before-ASR period and downward trends during the after-ASR period at both sites (table 10). Suspended-solids fluxes increased 13 and 29 percent and suspended-sediment fluxes increased 29 and <1 percent at the Highway 50 and Sedgwick sites, respectively, during the study period (table 10). Both sites had suspended-solids and suspended-sediment flow-normalized fluxes that had no trend before ASR and upward trends after ASR, except for Highway 50 after ASR, which had no trend (table 10).
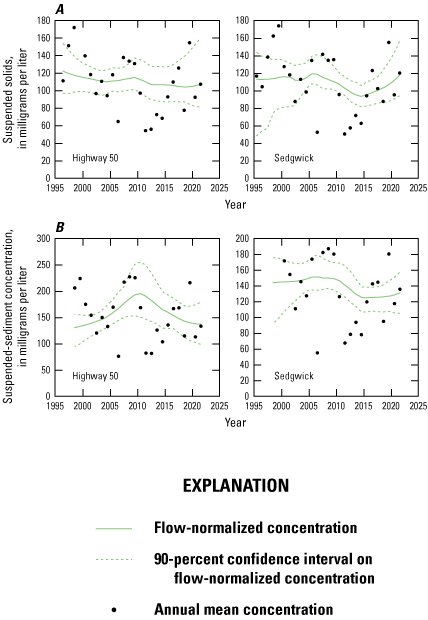
Weighted Regressions on Time, Discharge, and Season annual mean concentrations with flow-normalized concentration trend and 90-percent confidence interval for constituents at the Little Arkansas River at Highway 50 near Halstead, Kansas (Highway 50; U.S. Geological Survey [USGS] station 07143672), and Little Arkansas River near Sedgwick, Kans. (Sedgwick; USGS station 07144100), 1995–2021. A, Suspended solids. B, Suspended-sediment concentration.
Indicator Bacteria Trends
Little Arkansas River flow-normalized indicator bacteria densities during 1995 through 2021 (fig. 12) generally had downward trends, whereas flow-normalized indicator bacteria flux trends were not evident (table 10). Flow-normalized E. coli bacteria densities during the study period (fig. 12A) had downward trends that decreased by about 40 percent at both sites (table 10). Study period fecal coliform densities (fig. 12B) had a downward trend at the Highway 50 site and no trend at the Sedgwick site (table 10). Before-ASR flow-normalized E. coli densities had no trend at the Highway 50 site and had a downward trend at the Sedgwick site; after-ASR E. coli densities had downward trends at both sites (table 10). Flow-normalized fecal coliform densities before ASR had no trend at the Highway 50 site and had an upward trend at the Sedgwick site (table 10). After-ASR fecal coliform densities had a downward trend at both sites (table 10). There were no trends in flow-normalized indicator bacteria fluxes during the study period at either study site (table 10). Before-ASR E. coli bacteria density fluxes had a downward trend at the Highway 50 site and no trend at the Sedgwick site; after-ASR E. coli bacteria density fluxes had no trend at the Highway 50 site and an upward trend at the Sedgwick site (table 10). Before-ASR fecal coliform bacteria density fluxes had no trend at the Highway 50 site and an upward trend at the Sedgwick site; after-ASR fecal coliform bacteria density fluxes had downward trends at both sites (table 10).
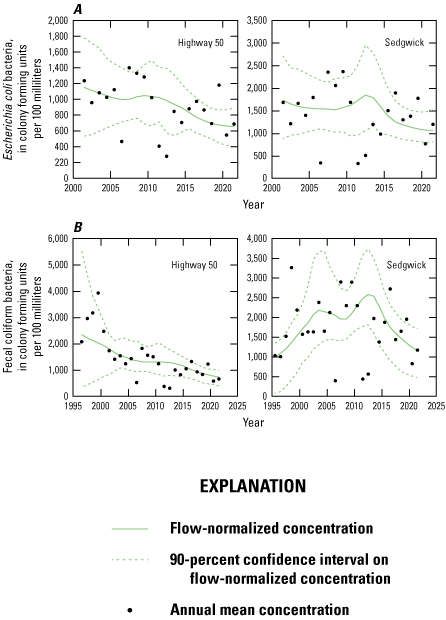
Weighted Regressions on Time, Discharge, and Season annual mean concentrations with flow-normalized concentration trend and 90-percent confidence interval for constituents at the Little Arkansas River at Highway 50 near Halstead, Kansas (Highway 50; U.S. Geological Survey [USGS] station 07143672), and Little Arkansas River near Sedgwick, Kans. (Sedgwick; USGS station 07144100), 1995–2021. A, Escherichia coli bacteria. B, Fecal coliform bacteria.
Trace Element Trends
Flow-normalized dissolved iron concentrations during the study period (fig. 13A) had upward trends at both study sites; iron concentrations increased 318 percent at the Highway 50 site and 69 percent at the Sedgwick site (table 10). Dissolved iron concentrations during the before ASR time period had an upward trend at the Highway 50 site and no trend at the Sedgwick site; dissolved iron concentrations at both sites had upward trends during the after-ASR period (table 10). Sedgwick site flow-normalized dissolved strontium concentrations (fig. 13B) had a downward trend during the entire study and before-ASR time periods, and an upward trend during the after-ASR time period (table 10). Flow-normalized dissolved arsenic concentrations during the entire study (fig. 13C) and before-ASR periods had downward trends at both sites and dissolved arsenic concentrations had no trend at either site during the after-ASR time period (table 10). Dissolved arsenic concentrations decreased 11 percent at the Highway 50 site and 14 percent at the Sedgwick site during the study period (table 10).
Flow-normalized dissolved iron fluxes during the study period had an upward trend at the Highway 50 site and no trend at the Sedgwick site; before-ASR dissolved iron fluxes had downward trends at both sites; after-ASR dissolved iron fluxes had an upward trend at the Highway 50 site and downward trend at the Sedgwick site (table 10). Flow-normalized dissolved strontium fluxes at the Sedgwick site during the study period and before ASR had a downward trend and after ASR had an upward trend (table 10). Flow-normalized dissolved arsenic fluxes had no trend during the study period at both sites; arsenic fluxes had downward trends for the before-ASR time period at both sites; arsenic fluxes during the after-ASR time period had an upward trend at the Highway 50 site and no trend at the Sedgwick site (table 10).
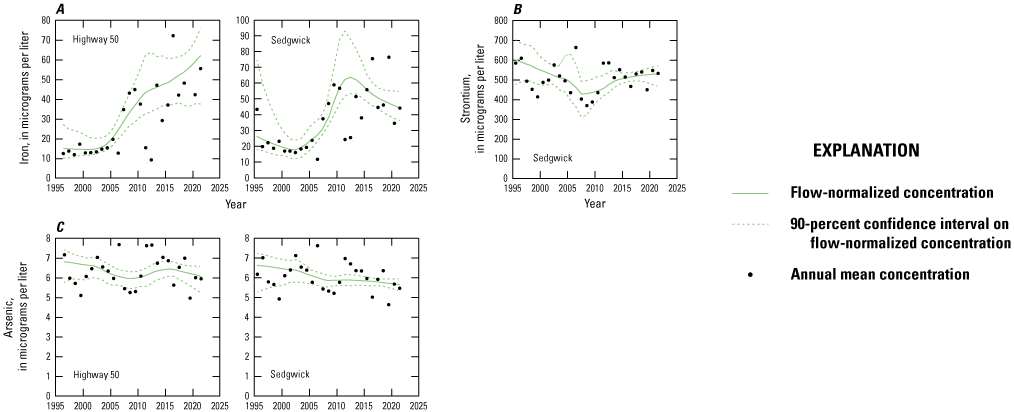
Weighted Regressions on Time, Discharge, and Season annual mean concentrations with flow-normalized concentration trend and 90-percent confidence interval for constituents at the Little Arkansas River at Highway 50 near Halstead, Kansas (Highway 50; U.S. Geological Survey [USGS] station 07143672), and Little Arkansas River near Sedgwick, Kans. (Sedgwick; USGS station 07144100), 1995–2021. A, Iron. B, Strontium. C, Arsenic.
Several studies have used statistical approaches based on weighted regressions to characterize flow-normalized annual water-quality constituent concentrations and fluxes in U.S. streams (Hirsch and others, 2010; Medalie and others, 2012; Moyer and others, 2012; Murphy and others, 2013; Hickman and Hirsch, 2017; Oelsner and others, 2017; Murphy and Sprague, 2019; Murphy, 2020; Ryberg and others, 2020; Barr and Kalkhoff, 2021; Domagalski and others, 2021; Kramer and others, 2021; Flickinger and Shephard, 2022). Within Kansas, the Little Arkansas River and Arkansas River had downward trends for dissolved solids and chloride concentrations during several time periods during 1972 through 2012 (Oelsner and others, 2017). Arkansas River nitrate concentrations had upward trends for the time periods 1982 through 2012 and 1992 through 2012 (Oelsner and others, 2017). Arkansas River total nitrogen concentrations had a downward trend for the period 1992 through 2012 (Oelsner and others, 2017). Little Arkansas River orthophosphate concentrations had an upward trend for the period 2002 through 2012 (Oelsner and others, 2017). Arkansas River sites had downward total phosphorus concentration trends for earlier time periods (1972 through 2012, 1982 through 2012, and 1992 through 2012) and upward total phosphorus concentrations for the time periods 2002 through 2012 (Oelsner and others, 2017). Several sites in Kansas, including sites along the Verdigris River and Kansas River, had dissolved solids, chloride, and nitrate concentrations with downward trends, and total phosphorus concentrations with upward trends during time periods between 1972 through 2012 (Oelsner and others, 2017). The nearby North Fork Ninnescah River (inflow to Cheney Reservoir, fig. 1) had downward nitrate plus nitrite and upward orthophosphate, total phosphorus, total organic carbon, suspended solids, and suspended-sediment concentration trend probabilities during 1999 through 2019 (Kramer and others, 2021). Future Equus Beds aquifer and Little Arkansas River research efforts would benefit from trend analysis during targeted flow conditions to assess drivers of long-term water-quality concentration changes.
Summary
The Equus Beds aquifer and Cheney Reservoir are primary sources for the city of Wichita’s current (2023) water supply. The Equus Beds aquifer storage and recovery (ASR) project was developed by the city of Wichita to help meet future water demands using Little Arkansas River as an artificial aquifer recharge water source during above-base-flow conditions. Little Arkansas River water is removed from the river at an ASR Facility intake structure, treated using National Primary Drinking Water Regulations as a guideline, and is infiltrated into the Equus Beds aquifer through recharge basins or injected into the aquifer through recharge wells for later use. The U.S. Geological Survey, in cooperation with the city of Wichita, completed this study to document Little Arkansas River water quantity and quality; document the development and update of regression models that establish relations between continuous and discrete water-quality data; and to characterize and quantify water-quality concentrations, loads, and trends during 1995 through 2021 for primary ions, nutrient and carbon species, sediment, indicator bacteria, trace elements, and pesticides. Water-quality constituents of interest were selected because of their relevance to water-supply or water-quality issues in the Equus Beds aquifer and the Little Arkansas River. Data from this report are important because they can be used to document surface-water quality, quantify potential pollutants, evaluate changing conditions, identify environmental factors affecting surface water, provide science-based information for decision making, and help meet regulatory monitoring requirements.
The Little Arkansas River has a contributing drainage area of primarily agricultural land (producing mainly corn, sorghum, soybeans, and wheat); fertilizers and herbicides are commonly applied in the drainage basin. Several streams in the Little Arkansas River watershed are listed as impaired waterways; impairments include arsenic, chloride, nutrients, sediment, and bacteria. The Little Arkansas River has defined total maximum daily loads for atrazine, nutrients, suspended solids and sediment, fecal coliform bacteria, and total phosphorus.
Data were collected from three sites along the Little Arkansas River. The upstream Little Arkansas River at Highway 50 near Halstead, Kansas, streamgage (U.S. Geological Survey station 07143672; hereafter referred to as the “Highway 50 site”) and downstream Little Arkansas River near Sedgwick, Kans., streamgage (U.S. Geological Survey station 07144100; hereafter referred to as the “Sedgwick site”) bracket a substantial portion of the easternmost part of the Equus Beds aquifer. The Little Arkansas River upstream from the ASR Facility near Sedgwick, Kans., streamgage (U.S. Geological Survey station 375350097262800; hereafter referred to as the “Upstream ASR site”) is located between the Highway 50 and Sedgwick sites, about 14.7 river miles (mi) downstream from the Highway 50 site, about 1.71 river mi upstream from the Sedgwick site, and immediately upstream from the ASR Facility intake structure. The contributing drainage areas for the Highway 50 and Sedgwick sites are about 685 square miles (mi2) and 1,165 mi2, respectively.
Continuous (hourly) streamflow and physicochemical parameters (water temperature, specific conductance, pH, dissolved oxygen, turbidity, and nitrate plus nitrite) and discrete water-quality data (primary ions [hardness, dissolved solids, calcium, magnesium, potassium, sodium, bromide, chloride, fluoride, silica, and sulfate], nutrient and carbon species [ammonia plus organic nitrogen, nitrate plus nitrite, total phosphorus, and dissolved and total organic carbon], sediment [suspended solids and suspended-sediment concentration], indicator bacteria [Escherichia coli and fecal coliform bacteria], trace elements [iron and arsenic], and pesticides [deethylatrazine, atrazine, and metolachlor]) were collected over a range of streamflows during 1995 through 2021. Surrogate models for water-quality constituents of interest (including bromide, dissolved organic carbon, deethylatrazine, atrazine, and metolachlor) were updated or developed using continuously measured and concomitant discrete data and were used, along with previously developed regression models, to compute concentrations (at the Highway 50, Sedgwick, and Upstream ASR sites) and loads (at the Highway 50 and Sedgwick sites) during the study period. Federal criteria were used to evaluate water quality. Where applicable, water-quality data were compared to Federal national drinking-water regulations. Flow-normalized water-quality constituent trends were evaluated using Weighted Regressions on Time, Discharge, and Season; statistical models and water-quality trends were described using Weighted Regressions on Time, Discharge, and Season bootstrap tests.
The ASR phase II water treatment facility requires a minimum streamflow of about 100 cubic feet per second at the Sedgwick site to operate, and this operational guideline was exceeded about 31 percent of the time during the study; streamflow maxima were during May 2019. Water temperature exceeded the Kansas criterion less than 1 percent of the time. pH was below the Kansas aquatic life-support criterion less than 1 percent of the time and exceeded the upper criterion 3 percent of the time. Dissolved oxygen concentrations were below the Kansas aquatic life-support criterion about 3 to 4 percent of the time; dissolved oxygen minima were during June and July 2016. Continuous nitrate plus nitrite concentrations exceeded the EPA level III ecoregion 27 guideline 84 to 99 percent of the time and the nitrate maximum contaminant level (MCL) was exceeded less than 1 percent of the time.
Continuously measured physicochemical properties that were included as surrogates in final regression models for this study were specific conductance, and YSI EXO turbidity. Specific conductance was the sole explanatory variable for bromide; turbidity was the sole explanatory variable for total organic carbon, and turbidity and seasonal components were explanatory variables for pesticides, including deethylatrazine, atrazine, and metolachlor.
Computed primary constituents of dissolved solids (hardness, calcium, sodium, bromide, and chloride), with the exception of sulfate, were larger at the Highway 50 site compared to the Sedgwick site. During the study period, the EPA secondary maximum contaminant level (SMCL) for dissolved solids (500 milligrams per liter [mg/L]) was exceeded 57 percent of the time at the Highway 50 site and 38 percent of the time at the Sedgwick site. Computed bromide concentrations were larger at the Highway 50 site and exceeded the city of Wichita treatment threshold (0.3 mg/L) about 70, 21, and 19 percent of the time at the Highway 50, Sedgwick, and Upstream ASR sites, respectively. Chloride concentrations exceeded the EPA SMCL (250 mg/L) about 16 percent of the time at the Highway 50 site and did not exceed the SMCL at the Sedgwick site. Computed sulfate concentrations never exceeded the EPA SMCL (250 mg/L) at any site during the study.
Ammonia plus organic nitrogen concentrations exceeded the EPA level III ecoregion 27 guideline (0.52 mg/L) about 85 percent of the time at the Highway 50 site and 93 percent of the time at the Sedgwick site. Total phosphorus concentrations were generally larger at the Sedgwick site and exceeded the EPA level III ecoregion 27 guideline (0.09 mg/L) nearly 100 percent of the time at the Highway 50 and Sedgwick sites. Continuously computed suspended solids and suspended-sediment concentration ranges and means were similar between the Highway 50 and Sedgwick sites during the study.
Escherichia coli bacteria densities exceeded the Kansas Department of Health and Environment primary contact guideline (262 colony forming units per 100 milliliters [cfu/100 mL] during April 1 through October 31) 84 to 62 percent of the time and exceeded the Kansas Department of Health and Environment secondary contact guideline (2,358 cfu/100 mL during November 1 through March 31) 5 to 6 percent of the time during the study for the associated periods of time. Continuous arsenic concentrations exceeded the Federal MCL (10 micrograms per liter [µg/L]) 9 to 15 percent of the time during the study. Atrazine concentrations exceeded the MCL (3 µg/L) 10 percent of the time at the Highway 50 and Sedgwick sites and 14 percent of the time at the Upstream ASR site during the study; computed glyphosate concentrations at the Sedgwick site never exceeded the MCL (700 µg/L) during the study.
Annual streamflow volume was smallest in 2006 and largest in 2019 at all sites; as such, nearly all computed water-quality constituent loads were largest in 2019 and smallest in 2006. Agricultural practices in the watershed, including fertilizer application, likely contributed a substantial amount of the Little Arkansas River nitrate plus nitrite and phosphorus loads during the study period. Nitrate plus nitrite loads were computed during 2018 through 2021 at the Highway 50 site and 2013 through 2021 at the Sedgwick site; the total nitrate plus nitrite loads were 1,610 tons at the Highway 50 site and 5,390 tons at the Sedgwick site. Ammonia plus organic nitrogen loads for 1999 through 2021 were 10,500 tons at the Highway 50 site and 16,200 tons at the Sedgwick site. The total phosphorus load during 1999 through 2021 was 4,090 tons at the Highway 50 site and 6,710 tons at the Sedgwick site. The ammonia plus organic nitrogen load during 2005 through 2021 was 56,800 tons at the Highway 50 site and 88,500 tons at the Sedgwick site. Little Arkansas River suspended-solids load during 1999 through 2021 was 1,770,000 tons at the Highway 50 site and 2,480,000 tons at the Sedgwick site. The Little Arkansas River total suspended-sediment load during 1999 through 2021 was 2,340,000 tons at the Highway 50 site and 4,060,000 tons at the Sedgwick site. About 40 percent of the total Little Arkansas River suspended-sediment load at both the Highway 50 and Sedgwick sites during 1999 through 2021 was transported in the top 1 percent (about 80) of loading days.
Little Arkansas River flow-normalized primary ion concentrations during 1995 through 2021 generally had downward trends and percent decreases in concentrations were generally larger at the Highway 50 site. Dissolved solids, potassium, sodium, chloride, and fluoride flow-normalized concentrations had downward trends that were very likely or highly likely at both sites during the study period. Dissolved solids concentrations decreased by 30 percent (Highway 50 site) and 15 percent (Sedgwick site); sodium concentrations decreased by 49 percent (Highway 50 site) and 32 percent (Sedgwick site); and chloride concentrations decreased by 54 percent (Highway 50 site) and 43 percent (Sedgwick site) during the study period. Bromide and silica flow-normalized concentrations had no trend at the Highway 50 site and a downward trend at the Sedgwick site during the study period. Flow-normalized sulfate concentrations during the study period had a downward trend (and a decrease of 10 percent) at the Highway 50 site and an upward trend (and an increase of 7 percent) at the Sedgwick site. Little Arkansas River flow-normalized primary ion fluxes generally had downward trends. Dissolved solids, potassium, sodium, bromide, chloride, and fluoride flow-normalized study period fluxes had downward trends at both study sites.
Little Arkansas River flow-normalized nutrient and carbon species concentrations during 1995 through 2021 generally had downward trends, and concentration percent decreases were generally larger at the Sedgwick site. Flow-normalized ammonia plus organic nitrogen concentrations during the study had downward trends at both sites that were highly likely; ammonia plus organic nitrogen concentrations decreased by 18 percent at the Highway 50 site and 23 percent at the Sedgwick site. Nitrate plus nitrite concentrations had an upward trend at the Highway 50 site and downward trend at the Sedgwick site; both trends were highly likely. Flow-normalized total phosphorus concentrations for the study period (2000 through 2021 for the Highway 50 site and 1995 through 2021 for the Sedgwick site) had an upward trend at the Highway 50 site and a downward trend at the Sedgwick site. Orthophosphate and dissolved phosphorus concentrations had downward trend probabilities that were either very or highly likely at the Sedgwick site. Dissolved organic carbon concentrations at the Highway 50 and Sedgwick sites during 2010 through 2021 had downward trends that were very or highly likely. Dissolved organic carbon concentrations decreased by 20 percent at the Highway 50 site and 43 percent at the Sedgwick site. Total organic carbon concentrations had upward trends that were highly likely at both study sites; total organic carbon concentrations increased about 50 percent at both sites. Little Arkansas River flow-normalized nutrient and carbon species fluxes during the study period generally had upward trends. Nitrate plus nitrite fluxes had upward trends at both sites and increased 77 percent at the Highway 50 site and 53 percent at the Sedgwick site. Total phosphorus fluxes had upward trends at both study sites. Dissolved organic carbon fluxes had downward trends at the Highway 50 and Sedgwick sites and decreases of 31 percent at the Highway 50 site and 24 percent at the Sedgwick site. Total organic carbon fluxes had upward trends that were highly likely at both sites; total organic carbon fluxes increased by 125 percent at the Highway 50 site and 162 percent at the Sedgwick site.
Little Arkansas River sediment concentration and flux trends were generally inconsistent among study sites and time periods. Suspended-solids concentrations during the study period had a downward trend at the Highway 50 site and no trend at the Sedgwick site; suspended-solids concentrations decreased 12 percent at the Highway 50 site and increased 5 percent at the Sedgwick site. Study period flow-normalized suspended-sediment concentrations had an upward trend at the Highway 50 site and no trend at the Sedgwick site; suspended-sediment concentrations increased 8 percent at the Highway 50 site and decreased 7 percent at the Sedgwick site. Indicator bacteria densities generally had downward trend probabilities during the study period, whereas flow-normalized indicator bacteria flux trends were not evident. Dissolved iron concentrations during the study period had upward trends at both study sites; iron concentrations increased 318 percent at the Highway 50 site and 69 percent at the Sedgwick site. Dissolved arsenic concentrations during the entire study had downward trends at both sites and arsenic concentrations decreased 11 percent at the Highway 50 site and 14 percent at the Sedgwick site.
About one-quarter to one-half of the study period loads, including nutrients and sediment, were transported during 1 percent of the time during the study. About 38 to 40 percent of the total Little Arkansas River suspended-sediment load at the Highway 50 and Sedgwick sites during 1999 through 2021 was transported in the top 1 percent of loading days. Because streamflows are highly sensitive to climatic variation and an increase of extreme precipitation events in the Great Plains is expected, similar disproportionately large pollutant loading events may increase into the future. Continuous measurement of physicochemical properties in near-real time allowed characterization of Little Arkansas River surface water during conditions and time scales that would not have been possible otherwise and served as a complement to discrete water-quality sampling. Continuation of this water-quality monitoring will provide data to characterize changing conditions in the Little Arkansas River and possibly identify new and changing trends. Information in this report allows the city of Wichita to make informed municipal water-supply decisions on past and present water-quality conditions and trends in the watershed.
References Cited
Aiken, G.R., 2002, Organic matter in ground water [abs.], in Aiken, G.R., and Kuniansky, E.L., eds., U.S. Geological Survey artificial recharge workshop proceedings, April 2–4, 2002, Sacramento, California: U.S. Geological Survey Open-File Report 02–89, p. 21–23. [Also available at https://water.usgs.gov/ogw/pubs/ofr0289/ga_organic.htm.]
Albert, C.D., and Stramel, G.J., 1966, Fluvial sediment in the Little Arkansas River Basin, Kansas: U.S. Geological Survey Water-Supply Paper 1798–B, 30 p. [Also available at https://doi.org/10.3133/wsp1798B.]
Allan, J.D., Castillo, M.M., and Capps, K.A., 2021, Stream ecology—Structure and function of running waters (3d ed.): Cham, Switzerland, Springer Nature Switzerland AG, 502 p. [Also available at https://doi.org/10.1007/978-3-030-61286-3.]
Anderson, C.W., 2005, Turbidity (ver. 2.1, September 2005): U.S. Geological Survey Techniques of Water-Resources Investigations, book 9, chap. A6.7, 55 p. [Also available at https://doi.org/10.3133/twri09A6.7.]
Barr, M.N., and Kalkhoff, S.J., 2021, Water-quality trends of urban streams in Independence, Missouri, 2005–18: U.S. Geological Survey Scientific Investigations Report 2020–5130, 57 p. [Also available at https://doi.org/10.3133/sir20205130.]
Bennett, T.J., Graham, J.L., Foster, G.M., Stone, M.L., Juracek, K.E., Rasmussen, T.J., and Putnam, J.E., 2014, U.S. Geological Survey quality-assurance plan for continuous water-quality monitoring in Kansas, 2014: U.S. Geological Survey Open-File Report 2014–1151, 34 p. plus appendixes. [Also available at https://doi.org/10.3133/ofr20141151.]
Bolks, A., DeWire, A., and Harcum, J.B., 2014, Baseline assessment of left-censored environmental data using R: Fairfax, Va., Developed for U.S. Environmental Protection Agency by Tetra Tech, Inc., National Nonpoint Source Monitoring Program Tech Notes 10, 28 p. [Also available at https://www.epa.gov/sites/production/files/2016-05/documents/tech_notes_10_jun2014_r.pdf.]
Camargo, J.A., and Alonso, Á., 2006, Ecological and toxicological effects of inorganic nitrogen pollution in aquatic ecosystems—A global assessment: Environment International, v. 32, no. 6, p. 831–849. [Also available at https://doi.org/10.1016/j.envint.2006.05.002.]
Carlisle, D.M., Wolock, D.M., Konrad, C.P., McCabe, G.J., Eng, K., Grantham, T.E., and Mahler, B., 2019, Flow modification in the Nation’s streams and rivers: U.S. Geological Survey Circular 1461, 75 p. [Also available at https://doi.org/10.3133/cir1461.]
Christensen, V.G., Ziegler, A.C., Rasmussen, P.P., and Jian, X., 2003, Continuous real-time water-quality monitoring of Kansas streams, in Proceedings of the American Water Resources Association 2003 Spring Specialty Conference on Agricultural Hydrology and Water Quality, Kansas City, Mo., May 12–14, 2003: Middleburg, Va., American Water Resources Association Technical Publication Series No. TPS–03–1, 5 p., CD–ROM. [Also available at https://nrtwq.usgs.gov/ks/methods/christensen2003.]
Cohen, A.C., Jr., 1950, Estimating the mean and variance of normal populations from singly truncated and doubly truncated samples: Annals of Mathematical Statistics, v. 21, no. 4, p. 557–569. [Also available at https://doi.org/10.1214/aoms/1177729751.]
Conant, R.T., Kluck, D., Anderson, M., Badger, A., Boustead, B.M., Derner, J., Farris, L., Hayes, M., Livneh, B., McNeeley, S., Peck, D., Shulski, M., and Small, V., 2018, Northern Great Plains, chap. 22 of Reidmiller, D.R., Avery, C.W., Easterling, D.R., Kunkel, K.E., Lewis, K.L.M., Maycock, T.K., and Stewart, B.C., eds., Impacts, risks, and adaptation in the United States—Fourth National Climate Assessment, Volume II: Washington, D.C., U.S. Global Change Research Program, p. 941–986. [Also available at https://doi.org/10.7930/NCA4.2018.CH22.]
Cook, R.D., 1977, Detection of influential observation in linear regression: Technometrics, v. 19, no. 1, p. 15–18. [Also available at https://doi.org/10.2307/1268249.]
Davis, C., 2020, Hydrologic conditions in Kansas, water year 2019: U.S. Geological Survey Fact Sheet 2020–3029, 6 p. [Also available at https://doi.org/10.3133/fs20203029.]
Devlin, D.L., Whitney, D.A., and McVay, K.A., 2000, Phosphorus and water quality in Kansas: Kansas State University Agricultural Experiment Station and Cooperative Extension Service, Total Maximum Daily Load (TMDL) Fact Sheet No. 3, 2 p. [Also available at https://bookstore.ksre.ksu.edu/pubs/MF2463.pdf.]
Dewitz, J., and U.S. Geological Survey, 2021, National Land Cover Database (NLCD) 2019 products (ver 2.0, June 2021): U.S. Geological Survey data release, accessed January 2022 at https://doi.org/10.5066/P9KZCM54.]
Domagalski, J.L., Morway, E., Alvarez, N.L., Hutchins, J., Rosen, M.R., and Coats, R., 2021, Trends in nitrogen, phosphorus, and sediment concentrations and loads in streams draining to Lake Tahoe, California, Nevada, USA: Science of the Total Environment, v. 752, no. 4, art. 141815, 17 p. [Also available at https://doi.org/10.1016/j.scitotenv.2020.141815.]
Duan, N., 1983, Smearing estimate—A nonparametric retransformation method: Journal of the American Statistical Association, v. 78, no. 383, p. 605–610. [Also available at https://doi.org/10.1080/01621459.1983.10478017.]
Dubrovsky, N.M., Burrow, K.R., Clark, G.M., Gronberg, J.M., Hamilton, P.A., Hitt, K.J., Mueller, D.K., Munn, M.D., Nolan, B.T., Puckett, L.J., Rupert, M.G., Short, T.M., Spahr, N.E., Sprague, L.A., and Wilber, W.G., 2010, The quality of our Nation’s waters—Nutrients in the Nation’s streams and groundwater, 1992–2004: U.S. Geological Survey Circular 1350, 174 p. [Also available at https://doi.org/10.3133/cir1350.]
Dufour, A.P., 1984, Bacterial indicators of recreational water quality: Canadian Journal of Public Health, v. 75, no. 1, p. 49–56. [Also available at https://www.jstor.org/stable/41990233.]
Dufour, A.P., Strickland, E.R., and Cabelli, V.J., 1981, Membrane filter method for enumerating Escherichia coli: Applied and Environmental Microbiology, v. 41, no. 5, p. 1152–1158. [Also available at https://doi.org/10.1128/aem.41.5.1152-1158.1981.]
Flickinger, A.K., and Shephard, Z.M., 2022, Water-quality trends in surface waters of the Jemez River and Middle Rio Grande Basin from Cochiti to Albuquerque, New Mexico, 2004–19: U.S. Geological Survey Scientific Investigations Report 2022–5062, 33 p. [Also available at https://doi.org/10.3133/sir20225062.]
Garinger, L.P., King, A.S., and Ziegler, A.C., 2011, Effects of experimental passive artificial recharge of treated surface water on water quality in the Equus Beds aquifer, 2009–2010: U.S. Geological Survey Scientific Investigations Report 2011–5070, 106 p. [Also available at https://doi.org/10.3133/sir20115070.]
Gilliom, R.J., 2007, Pesticides in U.S. streams and groundwater: Environmental Science & Technology, v. 41, no. 10, p. 3408–3414. [Also available at https://doi.org/10.1021/es072531u.]
Gray, J.R., Glysson, G.D., Turcios, L.M., and Schwarz, G.E., 2000, Comparability of suspended-sediment concentration and total suspended solids data: U.S. Geological Survey Water-Resources Investigations Report 2000–4191, 14 p. [Also available at https://doi.org/10.3133/wri004191.]
Guy, H.P., 1969, Laboratory theory and methods for sediment analysis: U.S. Geological Survey Techniques of Water-Resources Investigations, book 5, chap. C1, 58 p. [Also available at https://doi.org/10.3133/twri05C1.]
HACH Company, 2014, Nitratax sc user manual (6th ed.): Hach Company, 40 p. [Also available at https://www.hach.com/asset-get.download-en.jsa?id=7639982966.]
Hald, A., 1949, Maximum likelihood estimation of the parameters of a normal distribution which is truncated at a known point: Scandinavian Actuarial Journal, v. 1949, no. 1, p. 119–134. [Also available at https://doi.org/10.1080/03461238.1949.10419767.]
Hansen, C.V., Whisnant, J.A., and Lanning-Rush, J.L., 2014, Status of groundwater levels and storage volume in the Equus Beds aquifer near Wichita, Kansas, 2012 to 2014: U.S. Geological Survey Scientific Investigations Report 2014–5185, 39 p. [Also available at https://doi.org/10.3133/sir20145185.]
Helsel, D.R., and Cohn, T.A., 1988, Estimation of descriptive statistics for multiply censored water quality data: Water Resources Research, v. 24, no. 12, p. 1997–2004. [Also available at https://doi.org/10.1029/WR024i012p01997.]
Helsel, D.R., Hirsch, R.M., Ryberg, K.R., Archfield, S.A., and Gilroy, E.J., 2020, Statistical methods in water resources: U.S. Geological Survey Techniques and Methods, book 4, chap. A3, 458 p. [Also available at https://doi.org/10.3133/tm4a3.]
Hem, J.D., 1992, Study and interpretation of the chemical characteristics of natural water (3d ed.): U.S. Geological Survey Water-Supply Paper 2254, 263 p. [Also available at https://doi.org/10.3133/wsp2254.]
Hickman, R.E., and Hirsch, R.M., 2017, Trends in the quality of water in New Jersey streams, water years 1971–2011: U.S. Geological Survey Scientific Investigations Report 2016–5176, 58 p. [Also available at https://doi.org/10.3133/sir20165176.]
Hinkle, S.R., and Polette, D.J., 1999, Arsenic in ground water of the Willamette Basin, Oregon: U.S. Geological Survey Water-Resources Investigations Report 98–4205, 28 p. [Also available at https://doi.org/10.3133/wri984205.]
Hirsch, R.M., Archfield, S.A., and De Cicco, L.A., 2015, A bootstrap method for estimating uncertainty of water quality trends: Environmental Modelling & Software, v. 73, p. 148–166. [Also available at https://doi.org/10.1016/j.envsoft.2015.07.017.]
Hirsch, R.M., and De Cicco, L.A., 2015, User guide to Exploration and Graphics for RivEr Trends (EGRET) and dataRetrieval—R packages for hydrologic data (ver. 2.0, February 2015): U.S. Geological Survey Techniques and Methods, book 4, chap. A10, 93 p. [Also available at https://doi.org/10.3133/tm4A10.]
Hirsch, R.M., Moyer, D.L., and Archfield, S.A., 2010, Weighted regressions on time, discharge, and season (WRTDS), with an application to Chesapeake Bay River inputs: Journal of the American Water Resources Association, v. 46, no. 5, p. 857–880. [Also available at https://doi.org/10.1111/j.1752-1688.2010.00482.x.]
Juracek, K.E., and Hansen, C.V., 1995, Digital maps of the extent, base, top, and 1991 potentiometric surface of the High Plains aquifer in Kansas: U.S. Geological Survey Open-File Report 96–613, scales 1:500,000 and 1:1,000,000. [Also available at https://doi.org/10.3133/ofr96613.]
Kansas Department of Agriculture, 2021, Kansas farm facts: Topeka, Kans., Kansas Department of Agriculture, 156 p. [Also available at https://agriculture.ks.gov/docs/default-source/ag-marketing/farm-facts-2021-final.pdf.]
Kansas Department of Health and Environment, 2000a, Lower Arkansas River Basin total maximum daily load. Water body—Little Arkansas River subbasin. Water quality impairment—Sediment impact on aquatic life: Topeka, Kans., Kansas Department of Health and Environment, 11 p. [Also available at https://www.kdhe.ks.gov/DocumentCenter/View/14307/Little-Arkansas-River-Sediment-PDF.]
Kansas Department of Health and Environment, 2000b, Lower Arkansas River Basin total maximum daily load. Water body—Little Arkansas River subbasin. Water quality impairment—Nutrients and oxygen demand impact on aquatic life: Topeka, Kans., Kansas Department of Health and Environment, 14 p. [Also available at https://www.kdhe.ks.gov/DocumentCenter/View/14303/Little-Arkansas-River-Bio-PDF.]
Kansas Department of Health and Environment, 2000c, Lower Arkansas River Basin total maximum daily load. Waterbody—Little Arkansas River subbasin. Water quality impairment—Fecal coliform bacteria: Topeka, Kans., Kansas Department of Health and Environment, 14 p. [Also available at https://www.kdhe.ks.gov/DocumentCenter/View/14305/Little-Arkansas-River-FCB-PDF.]
Kansas Department of Health and Environment, 2004, Surface water nutrient reduction plan: Topeka, Kans., Kansas Department of Health and Environment, Bureau of Water, 47 p. [Also available at http://cdm16884.contentdm.oclc.org/cdm/ref/collection/p16884coll4/id/88.]
Kansas Department of Health and Environment, 2006a, Lower Arkansas River Basin total maximum daily load. Waterbody/assessment unit (AU)—Lower Arkansas River—Hutchinson to Maize. Water quality impairment—Chloride: Topeka, Kans., Kansas Department of Health and Environment,27 p. [Also available at https://www.kdhe.ks.gov/DocumentCenter/View/14275/Arkansas-River-Hutch-to-Maize-PDF.]
Kansas Department of Health and Environment, 2006b, Lower Arkansas River Basin total maximum daily load. Water body/assessment unit—Upper Little Arkansas River. Water quality impairment—Chloride: Topeka, Kans., Kansas Department of Health and Environment, 25 p. [Also available at https://www.kdhe.ks.gov/DocumentCenter/View/14304/Little-Arkansas-River-Cl-PDF.]
Kansas Department of Health and Environment, 2008, Lower Arkansas River Basin category 4B alternative. Water body/assessment unit—Little Arkansas River. Water quality impairment—Atrazine: Topeka, Kans., Kansas Department of Health and Environment, 35 p. [Also available at https://www.kdhe.ks.gov/DocumentCenter/View/14306/Little-Arkansas-River-PDF.]
Kansas Department of Health and Environment, 2011, Water quality standards white paper—Bacteria criteria for streams: Topeka, Kans., Kansas Department of Health and Environment, Bureau of Water, 7 p. [Also available at https://www.kdhe.ks.gov/DocumentCenter/View/9395/Bacteria-Criteria-for-Streams-PDF?bidId=.]
Kansas Department of Health and Environment, 2014, Lower Arkansas Basin total maximum daily load. Waterbody/assessment unit—Little Arkansas River watershed. Water quality impairment—Total suspended solids (TSS): Topeka, Kans., Kansas Department of Health and Environment, 53 p. [Also available at https://www.kdhe.ks.gov/DocumentCenter/View/14309/Little-Arkansas-River-TSS-PDF.]
Kansas Department of Health and Environment, 2017, Kansas surface water quality standards—Tables of numeric criteria: Topeka, Kans., Kansas Department of Health and Environment, 23 p. [Also available at https://www.kdhe.ks.gov/DocumentCenter/View/13319/Kansas-Surface-Water-Quality-Standards---Tables-of-Numeric-Criteria-March-2-2017-PDF.]
Kansas Department of Health and Environment, 2018, Kansas Surface Water Quality Standards: Topeka, Kans., Kansas Department of Health and Environment, Bureau of Water, Kansas Administrative Regulations (KAR), title 28, article 16, 28b–h and 58. [variously paged]. [Also available at https://www.kdhe.ks.gov/DocumentCenter/View/9390/State-Water-Quality-Standards-PDF.]
Kansas Department of Health and Environment, 2019, Lower Arkansas River Basin total maximum daily load. Waterbody—Arkansas River, Wichita to Arkansas City and Little Arkansas River, Valley Center to Wichita. Water quality impairment—Total phosphorus and pH: Topeka, Kans., Kansas Department of Health and Environment, 107 p. [Also available at https://www.kdhe.ks.gov/DocumentCenter/View/14310/Little-Arkansas-River-at-Wichita-TP-PDF.]
Kansas Department of Health and Environment, 2021, Lower Arkansas River Basin total maximum daily load. Waterbody—Little Arkansas River from Alta Mills to Valley Center. Water quality impairment—Total phosphorus and dissolved oxygen: Topeka, Kans., Kansas Department of Health and Environment, 81 p. [Also available at https://www.kdhe.ks.gov/DocumentCenter/View/14308/Little-Arkansas-River-TP-PDF.]
Kansas Department of Health and Environment, 2022, 2022 303(d) list of all impaired & potentially impaired waters: Topeka, Kans., Kansas Department of Health and Environment, 70 p. [Also available at https://www.kdhe.ks.gov/1219/303d-Methodology-List-of-Impaired-Waters.]
Kansas Rural Center, 2018, Pesticides, noxious weed control, and chemical drift protection in Kansas: Kansas Rural Center, 29 p. [Also available at https://kansasruralcenter.org/other-publications/pesticides-weeds-chemical-drift-kansas.]
Kansas State University Research and Extension, Kansas Center for Agricultural Resources and the Environment, and Kansas Department of Health and Environment, 2018, Little Arkansas River watershed—Watershed Restoration and Protection Strategy: Kansas State University Research and Extension, Kansas Center for Agricultural Resources and the Environment, and Kansas Department of Health and the Environment, 198 p. [Also available at https://kswraps.org/wp-content/uploads/2020/10/Little-Ark-WRAPS-Plan-Update-2018-Final.pdf.]
Kansas Water Office, 2022, The 2022 Kansas Water Plan: Topeka, Kans., Kansas Water Office, [variously paged]. [Also available at https://kwo.ks.gov/water-plan/water-plan.]
Klager, B.J., 2016, Status of groundwater levels and storage volume in the Equus Beds aquifer near Wichita, Kansas, January 2016: U.S. Geological Survey Scientific Investigations Report 2016–5165, 15 p. [Also available at https://doi.org/10.3133/sir20165165.]
Klager, B.J., Kelly, B.P., and Ziegler, A.C., 2014, Preliminary simulation of chloride transport in the Equus Beds aquifer and simulated effects of well pumping and artificial recharge on groundwater flow and chloride transport near the city of Wichita, Kansas, 1990 through 2008: U.S. Geological Survey Open-File Report 2014–1162, 76 p. [Also available at https://doi.org/10.3133/ofr20141162.]
Kloesel, K., Bartush, B., Banner, J., Brown, D., Lemery, J., Lin, X., Loeffler, C., McManus, G., Mullens, E., Nielsen-Gammon, J., Shafer, M., Sorensen, C., Sperry, S., Wildcat, D., and Ziolkowska, J., 2018, Southern Great Plains, chap. 23 of Reidmiller, D.R., Avery, C.W., Easterling, D.R., Kunkel, K.E., Lewis, K.L.M., Maycock, T.K., and Stewart, B.C., eds., Impacts, risks, and adaptation in the United States—Fourth National Climate Assessment, volume II: Washington, D.C., U.S. Global Change Research Program, p. 987–1035. [Also available https://doi.org/10.7930/NCA4.2018.CH23.]
Kramer, A.R., Klager, B.J., Stone, M.L., and Eslick-Huff, P.J., 2021, Regression relations and long-term water-quality constituent concentrations, loads, yields, and trends in the North Fork Ninnescah River, south-central Kansas, 1999–2019: U.S. Geological Survey Scientific Investigations Report 2021–5006, 51 p. [Also available at https://doi.org/10.3133/sir20215006.]
Lane, C.W., and Miller, D.E., 1965, Geohydrology of Sedgwick County, Kansas: Lawrence, Kans., State Geological Survey of Kansas, Bulletin 176, 100 p. [Also available at https://www.kgs.ku.edu/General/Geology/Sedgwick/index.html.]
Lee, C.J., Hirsch, R.M., and Crawford, C.G., 2019, An evaluation of methods for computing annual water-quality loads: U.S. Geological Survey Scientific Investigations Report 2019–5084, 59 p. [Also available at https://doi.org/10.3133/sir20195084.]
Leonard, R.B., and Kleinschmidt, M.K., 1976, Saline water in the Little Arkansas River basin area, south-central Kansas: Lawrence, Kans., Kansas Geological Survey, Chemical Quality Series 3, 24 p. [Also available at https://www.kgs.ku.edu/Publications/Bulletins/CQS3/index.html.]
Mallows, C., 1973, Some comments on Cp: Technometrics, v. 15, no. 4, p. 661–675. [Also available at https://doi.org/10.2307/1267380.]
McMahon, P.B., and Chapelle, F.H., 2008, Redox processes and water quality of selected principal aquifer systems: Ground Water, v. 46, no. 2, p. 259–271. [Also available at https://doi.org/10.1111/j.1745-6584.2007.00385.x.]
Medalie, L., Hirsch, R.M., and Archfield, S.A., 2012, Use of flow-normalization to evaluate nutrient concentration and flux changes in Lake Champlain tributaries, 1990–2009: Journal of Great Lakes Research, v. 38, p. 58–67. [Also available at https://doi.org/10.1016/j.jglr.2011.10.002.]
Meyer, M.T., Loftin, K.A., Lee, E.A., Hinshaw, G.H., Dietze, J.E., and Scribner, E.A., 2009, Determination of glyphosate, its degradation product aminomethylphosphonic acid, and glufosinate, in water by isotope dilution and online solid-phase extraction and liquid chromatography/tandem mass spectrometry: U.S. Geological Survey Techniques and Methods, book 5, chap. A10, 32 p. [Also available at https://doi.org/10.3133/tm5A10.]
Moyer, D.L., Hirsch, R.M., and Hyer, K.E., 2012, Comparison of two regression-based approaches for determining nutrient and sediment fluxes and trends in the Chesapeake Bay watershed: U.S. Geological Survey Scientific Investigations Report 2012‒5244, 118 p. [Also available at https://doi.org/10.3133/sir20125244.]
Mueller, D.K., Schertz, T.L., Martin, J.D., and Sandstrom, M.W., 2015, Design, analysis, and interpretation of field quality-control data for water-sampling projects: U.S. Geological Survey Techniques and Methods, book 4, chap. C4, 54 p. [Also available at https://doi.org/10.3133/tm4C4.]
Munn, M.D., Frey, J.W., Tesoriero, A.J., Black, R.W., Duff, J.H., Lee, K.E., Maret, T.R., Mebane, C.A., Waite, I.R., and Zelt, R.B., 2018, Understanding the influence of nutrients on stream ecosystems in agricultural landscapes: U.S. Geological Survey Circular 1437, 80 p. [Also available at https://doi.org/10.3133/cir1437.]
Murphy, J.C., 2020, Changing suspended sediment in United States rivers and streams—Linking sediment trends to changes in land use/cover, hydrology and climate: Hydrology and Earth System Sciences, v. 24, no. 2, p. 991–1010. [Also available at. https://doi.org/10.5194/hess-24-991-2020.]
Murphy, J.C., and Sprague, L.S., 2019, Water-quality trends in US rivers—Exploring effects from streamflow trends and changes in watershed management: Science of the Total Environment, v. 656, p. 645–658. [Also available at https://doi.org/10.1016/j.scitotenv.2018.11.255.]
Murphy, J.C., Hirsch, R.M., and Sprague, L.A., 2013, Nitrate in the Mississippi River and its tributaries, 1980–2010—An update: U.S. Geological Survey Scientific Investigations Report 2013–5169, 31 p. [Also available at https://doi.org/10.3133/sir20135169.]
Myers, D.N., Stoeckel, D.M., Bushon, R.N., Francy, D.S., and Brady, A.M.G., 2014, Fecal indicator bacteria (ver. 2.1, May 2014): U.S. Geological Survey Techniques of Water-Resources Investigations, book 9, chap. A7, sec. 7.1, 73 p. [Also available at https://doi.org/10.3133/twri09A7.1.]
Myers, N.C., Hargadine, G.D., and Gillespie, J.B., 1996, Hydrologic and chemical interaction of the Arkansas River and the Equus beds aquifer between Hutchinson and Wichita, south-central Kansas: U.S. Geological Survey Water-Resources Investigations Report 95–4191, 100 p. [Also available at https://doi.org/10.3133/wri954191.]
National Oceanic and Atmospheric Administration, 2022, Daily summaries station details for Mount Hope, KS, Network ID GHCND:USC00145539: National Oceanic and Atmospheric Administration database, accessed August 2022 at https://www.ncdc.noaa.gov/cdo-web/datasets/GHCND/stations/GHCND:USC00145539/detail.
Oelsner, G.P., Sprague, L.A., Murphy, J.C., Zuellig, R.E., Johnson, H.M., Ryberg, K.R., Falcone, J.A., Stets, E.G., Vecchia, A.V., Riskin, M.L., De Cicco, L.A., Mills, T.J., and Farmer, W.H., 2017, Water-quality trends in the Nation’s rivers and streams, 1972–2012—Data preparation, statistical methods, and trend results (ver. 2.0, October 2017): U.S. Geological Survey Scientific Investigations Report 2017–5006, 136 p. [Also available at https://doi.org/10.3133/sir20175006.]
Painter, C.C., and Loving, B.L., 2015, U.S. Geological Survey quality-assurance plan for surface-water activities in Kansas, 2015: U.S. Geological Survey Open-File Report 2015–1074, 33 p. [Also available at https://doi.org/10.3133/ofr20151074.]
Pellerin, B.A., Bergamaschi, B.A., Downing, B.D., Saraceno, J.F., Garrett, J.D., and Olsen, L.D., 2013, Optical techniques for the determination of nitrate in environmental waters—Guidelines for instrument selection, operation, deployment, maintenance, quality assurance, and data reporting: U.S. Geological Survey Techniques and Methods, book 1, chap. D5, 37 p. [Also available at https://doi.org/10.3133/tm1D5.]
Porterfield, G., 1972, Computation of fluvial-sediment discharge: U.S. Geological Survey Techniques of Water-Resources Investigations, book 3, chap. C3, 66 p. [Also available at https://doi.org/10.3133/twri03C3.]
R Core Team, 2021, R—A language and environment for statistical computing, version 4.1.3: Vienna, Austria, R Foundation for Statistical Computing. [Also available at https://www.r-project.org.]
Rasmussen, P.P., Eslick, P.J., and Ziegler, A.C., 2016, Relations between continuous real-time physical properties and discrete water-quality constituents in the Little Arkansas River, south-central Kansas, 1998–2014: U.S. Geological Survey Open-File Report 2016–1057, 20 p. [Also available at https://doi.org/10.3133/ofr20161057.]
Rasmussen, P.P., Gray, J.R., Glysson, G.D., and Ziegler, A.C., 2009, Guidelines and procedures for computing time-series suspended-sediment concentrations and loads from in-stream turbidity-sensor and streamflow data: U.S. Geological Survey Techniques and Methods, book 3, chap. C4, 53 p. [Also available at https://doi.org/10.3133/tm3C4.]
Rasmussen, T.J., Bennett, T.J., Stone, M.L., Foster, G.M., Graham, J.L., and Putnam, J.E., 2014, Quality-assurance and data-management plan for water-quality activities in the Kansas Water Science Center, 2014: U.S. Geological Survey Open-File Report 2014–1233, 41 p. [Also available at https://doi.org/10.3133/ofr20141233.]
Ryberg, K.R., Stone, W.W., and Baker, N.T., 2020, Causal factors for pesticide trends in streams of the United States—Atrazine and deethylatrazine: Journal of Environmental Quality, v. 49, no. 1, p. 152–162. [Also available at https://doi.org/10.1002/jeq2.20045.]
Ryberg, K.R., and York, B.C., 2020, seawaveQ—An R package providing a model and utilities for analyzing trends in chemical concentrations in streams with a seasonal wave (seawave) and adjustment for streamflow (Q) and other ancillary variables, version 2.0.0: U.S. Geological Survey Open-File Report 2020–1082, 25 p. [Also available at https://doi.org/10.3133/ofr20201082.]
Sauer, V.B., and Turnipseed, D.P., 2010, Stage measurement at gaging stations: U.S. Geological Survey Techniques and Methods, book 3, chap. A7, 45 p. [Also available at https://doi.org/10.3133/tm3A7.]
Schmidt, H.C.R., Ziegler, A.C., and Parkhurst, D.L., 2007, Geochemical effects of induced stream-water and artificial recharge on the Equus Beds aquifer, south-central Kansas, 1995–2004: U.S. Geological Survey Scientific Investigations Report 2007–5025, 58 p. [Also available at https://doi.org/10.3133/sir20075025.]
Searcy, J.K., 1959, Flow-duration curves: U.S. Geological Survey Water Supply Paper 1542–A, 33 p. [Also available at https://doi.org/10.3133/wsp1542A.]
Shafer, M., Ojima, D., Antle, J.M., Kluck, D., McPherson, R.A., Petersen, S., Scanlon, B., and Sherman, K., 2014, Great Plains, chap. 19 of Melillo, J.M., Richmond, T.C., and Yohe, G.W., eds., Climate change impacts in the United States—The Third National Climate Assessment: Washington, D.C., U.S. Global Change Research Program, p. 441–461. [Also available at https://doi.org/10.7930/J0D798BC.]
Smedley, P.L., and Kinniburgh, D.G., 2002, A review of the source, behaviour and distribution of arsenic in natural waters: Applied Geochemistry, v. 17, no. 5, p. 517–568. [Also available at https://doi.org/10.1016/S0883-2927(02)00018-5.]
Stone, M.L., 2017, Eighty years of cooperative water science: U.S. Geological Survey General Information Product 174, 2 p. [Also available at https://doi.org/10.3133/gip174.]
Stone, M.L., and Klager, B.J., 2022, Documentation of models describing relations between continuous real-time and discrete water-quality constituents in the Little Arkansas River, south-central Kansas, 1998–2019: U.S. Geological Survey Open-File Report 2022–1010, 34 p. [Also available at https://doi.org/10.3133/ofr20221010.]
Stone, M.L., Garrett, J.D., Poulton, B.C., and Ziegler, A.C., 2016, Effects of aquifer storage and recovery activities on water quality in the Little Arkansas River and Equus Beds aquifer, south-central Kansas, 2011–2014: U.S. Geological Survey Report 2016–5024, 88 p. [Also available at https://doi.org/10.3133/sir20165042.]
Stone, M.L., Juracek, K.E., Graham, J.L., and Foster, G.M., 2015, Quantifying suspended sediment loads delivered to Cheney Reservoir, Kansas—Temporal patterns and management implications: Journal of Soil and Water Conservation, v. 70, no. 2, p. 91–100. [Also available at https://doi.org/10.2489/jswc.70.2.91.]
Stone, M.L., Klager, B.J., and Ziegler, A.C., 2019, Water-quality and geochemical variability in the Little Arkansas River and Equus Beds aquifer, south-central Kansas, 2001–16: U.S. Geological Survey Scientific Investigations Report 2019–5026, 79 p. [Also available at https://doi.org/10.3133/fs20193017.]
Stone, M.L., Rasmussen, T.J., Bennett, T.J., Poulton, B.C., and Ziegler, A.C., 2012, Protocols for collection of streamflow, water-quality, streambed-sediment, periphyton, macroinvertebrate, fish, and habitat data to describe stream quality for the Hydrobiological Monitoring Program, Equus Beds Aquifer Storage and Recovery Program, city of Wichita, Kansas: U.S. Geological Survey Open-File Report 2012–1055, 55 p. [Also available at https://doi.org/10.3133/ofr20121055.]
Stramel, G.J., 1967, Progress report on the ground-water hydrology of the Equus-beds area, Kansas—1966: Lawrence, Kans., State Geological Survey of Kansas, Bulletin 187, Part 2, 27 p. [Also available at https://www.kgs.ku.edu/Publications/Bulletins/187_2/.]
Stullken, L.E., Watts, K.R., and Lindgren, R.J., 1985, Geohydrology of the High Plains aquifer, western Kansas: U.S. Geological Survey Water-Resources Investigations Report 85–4198, 86 p. [Also available at https://doi.org/10.3133/wri854198.]
Tappa, D.J., Lanning-Rush, J.L., Klager, B.J., Hansen, C.V., and Ziegler, A.C., 2015, Water quality of the Little Arkansas River and Equus Beds aquifer before and concurrent with large-scale artificial recharge, south-central Kansas, 1995–2012 (ver. 1.1, May 6, 2015): U.S. Geological Survey Scientific Investigations Report 2015–5023, 67 p. [Also available at https://doi.org/10.3133/sir20155023.]
Tobin, J., 1958, Estimation of relationships for limited dependent variables: Econometrica, v. 26, no. 1, p. 24–36. [Also available at https://doi.org/10.2307/1907382.]
Turnipseed, D.P., and Sauer, V.B., 2010, Discharge measurements at gaging stations: U.S. Geological Survey Techniques and Methods, book 3, chap. A8, 87 p. [Also available at https://doi.org/10.3133/tm3A8.]
U.S. Census Bureau, 2021, QuickFacts—Wichita city, Kansas—Population estimates, July 1, 2021: U.S. Census Bureau database, accessed August 2022 at https://census.gov/quickfacts/fact/table/wichitacitykansas.
U.S. Department of Agriculture, 2022, Quick stats: U.S. Department of Agriculture database, accessed September 2022 at https://quickstats.nass.usda.gov.
U.S. Environmental Protection Agency, 2000a, Improved enumeration methods for the recreational water quality indicators—Enterococci and Escherichia coli: Washington, D.C., U.S. Environmental Protection Agency, Office of Science and Technology, EPA–821–R–97–004, 49 p. [Also available at https://nepis.epa.gov/Exe/ZyPDF.cgi/200036RZ.PDF?Dockey=200036RZ.PDF.]
U.S. Environmental Protection Agency, 2000b, Nutrient criteria technical guidance manual—Rivers and streams: Washington, D.C., U.S. Environmental Protection Agency, Office of Water, EPA–822–B–00–002, [variously paged]. [Also available at https://www.epa.gov/sites/default/files/2018-10/documents/nutrient-criteria-manual-rivers-streams.pdf.]
U.S. Environmental Protection Agency, 2001a, Ambient water quality criteria recommendations—Information supporting the development of state and tribal nutrient criteria for rivers and streams in nutrient ecoregion V: Washington, D.C., U.S. Environmental Protection Agency, Office of Water, EPA–822–B–01–014, [variously paged]. [Also available at https://www.epa.gov/sites/default/files/documents/rivers5.pdf.]
U.S. Environmental Protection Agency, 2001b, Toxicological review of bromate (CAS no. 15541–45–4)—In support of summary information on the Integrated Risk Information System (IRIS): Washington, D.C., U.S. Environmental Protection Agency, Office of Science and Technology, EPA–635–R–01–002, 51 p. [Also available at https://iris.epa.gov/static/pdfs/1002tr.pdf.]
U.S. Environmental Protection Agency, 2005, Occurrence assessment for the final stage 2 disinfectants and disinfection byproducts rule: Washington, D.C., U.S. Environmental Protection Agency, Office of Water, EPA–815–R–05–011, [variously paged]. [Also available at https://nepis.epa.gov/Exe/ZyPDF.cgi?Dockey=P1005ED2.txt.]
U.S. Environmental Protection Agency, 2006a, Method 1103.1—Escherichia coli (E. coli) in water by membrane filtration using membrane-thermotolerant Escherichia coli agar (mTEC): Washington, D.C., U.S. Environmental Protection Agency, Office of Water, EPA–821–R–06–010, 45 p. [Also available at https://nepis.epa.gov/Exe/ZyPDF.cgi/P1002D92.PDF?Dockey=P1002D92.PDF.]
U.S. Environmental Protection Agency, 2006b, Method 1603—Escherichia coli (E. coli) in water by membrane filtration using modified membrane-thermotolerant Escherichia coli agar (modified mTEC): Washington, D.C., U.S. Environmental Protection Agency, Office of Water, EPA–821–R–06–011, 42 p. [Also available at https://nepis.epa.gov/Exe/ZyPDF.cgi/P1002DAB.PDF?Dockey=P1002DAB.PDF.]
U.S. Environmental Protection Agency, 2009, National primary drinking water regulations: U.S. Environmental Protection Agency, EPA–816–F–09–004, 7 p. [Also available at https://www.epa.gov/ground-water-and-drinking-water/national-primary-drinking-water-regulation-table.]
U.S. Environmental Protection Agency, 2023, Water recycling for climate resilience through enhanced aquifer recharge and aquifer storage and recovery: U.S. Environmental Protection Agency, EPA 832–R–23–001, 36 p. [Also available at https://www.epa.gov/system/files/documents/2023-02/Action%207.4%20Aquifer%20Recharge%20FINAL%202023.pdf.]
U.S. Geological Survey, 2006, Collection of water samples (ver. 2.0, September 2006): U.S. Geological Survey Techniques of Water-Resources Investigations, book 9, chap. A4, 231 p. [Also available at https://doi.org/10.3133/twri09A4.]
U.S. Geological Survey, 2019, StreamStats: U.S. Geological Survey Web application, accessed May 8, 2023, at https://streamstats.usgs.gov/ss/.
U.S. Geological Survey, 2020, Dissolved oxygen: U.S. Geological Survey Techniques and Methods, book 9, chap. A6.2, 33 p. [Also available at https://doi.org/10.3133/tm9A6.2.] [Supersedes USGS Techniques of Water-Resources Investigations, book 9, chap. A6.2, version 3.0.]
U.S. Geological Survey, 2021, Measurement of pH: U.S. Geological Survey Techniques and Methods, book 9, chap. A6.4, 21 p. [Also available at https://doi.org/10.3133/tm9A6.4.] [Supersedes USGS Techniques and Water-Resources, book 9, chap. A6.4, version 2.0.]
U.S. Geological Survey, 2023, USGS water data for the Nation: U.S. Geological Survey National Water Information System database, accessed August 2022 at https://doi.org/10.5066/F7P55KJN.
Wagner, R.J., Boulger, R.W., Jr., Oblinger, C.J., and Smith, B.A., 2006, Guidelines and standard procedures for continuous water-quality monitors—Station operation, record computation, and data reporting: U.S. Geological Survey Techniques and Methods, book 1, chap. D3, 96 p. [Also available at https://doi.org/10.3133/tm1D3.]
Whisnant, J.A., Hansen, C.V., and Eslick, P.J., 2015, Groundwater-level and storage-volume changes in the Equus Beds aquifer near Wichita, Kansas, predevelopment through January 2015: U.S. Geological Survey Scientific Investigations Report 2015–5121, 27 p. [Also available at https://doi.org/10.3133/sir20155121.]
Whittemore, D.O., 2007, Fate and identification of oil-brine contamination in different hydrogeologic settings: Applied Geochemistry, v. 22, no. 10, p. 2099–2114. [Also available at https://doi.org/10.1016/j.apgeochem.2007.04.002.]
Xie, Y., 2003, Disinfection byproducts in drinking water—Formation, analysis, and control: Boca Raton, Fla., CRC Press, 176 p. [Also available at https://doi.org/10.1201/9780203486917.]
YSI Incorporated, 2012a, 6-series multiparameter water quality sondes—User manual, revision J: Yellow Springs, Ohio, YSI Incorporated, 379 p. [Also available at https://www.ysi.com/File%20Library/Documents/Manuals/069300-YSI-6-Series-Manual-RevJ.pdf.]
YSI Incorporated, 2012b, EXO user manual—Advanced water quality monitoring platform, revision K: Yellow Springs, Ohio, YSI Incorporated, 243 p. [Also available at https://www.ysi.com/file%20library/documents/manuals/exo-user-manual-web.pdf.]
Zhang, Q., and Hirsch, R.M., 2019, River water-quality concentration and flux estimation can be improved by accounting for serial correlation through an autoregressive model: Water Resources Research, v. 55, no. 11, p. 9705–9723. [Also available at https://doi.org/10.1029/2019WR025338.]
Ziegler, A.C., Christensen, V.G., and Ross, H.C., 1999, Baseline water-quality and preliminary effects of artificial recharge on ground water, south-central Kansas, 1995–98: U.S. Geological Survey Water-Resources Investigations Report 99–4250, 74 p. [Also available at https://doi.org/10.3133/wri994250.]
Ziegler, A.C., and Combs, L.J., 1997, Baseline data-collection and quality control protocols and procedures for the Equus Beds groundwater recharge demonstration project near Wichita, Kansas, 1995–96: U.S. Geological Survey Open-File Report 97–235, 57 p. [Also available at https://doi.org/10.3133/ofr97235.]
Ziegler, A.C., Hansen, C.V., and Finn, D.A., 2010, Water quality in the Equus Beds aquifer and the Little Arkansas River before implementation of large-scale artificial recharge, south-central Kansas, 1995‒2005: U.S. Geological Survey Scientific Investigations Report 2010‒5023, 143 p. [Also available at https://doi.org/10.3133/sir20105023.]
Appendix 1. Turbidity Sensor Relations
References Cited
U.S. Geological Survey, 2023, USGS water data for the Nation: U.S. Geological Survey National Water Information System database, accessed August 2022 at https://doi.org/10.5066/F7P55KJN.
Appendix 2. Turbidity Sensor Comparisons
References Cited
U.S. Geological Survey, 2023, USGS water data for the Nation: U.S. Geological Survey National Water Information System database, accessed August 2022 at https://doi.org/10.5066/F7P55KJN.
Appendix 3. Quality Assurance and Quality Control Summary
References Cited
U.S. Geological Survey, 2023, USGS water data for the Nation: U.S. Geological Survey National Water Information System database, accessed August 2022 at https://doi.org/10.5066/F7P55KJN.
Appendix 4. Surrogate Regression Model Archive Summaries for the Little Arkansas River at Highway 50 near Halstead, Kansas (U.S. Geological Survey station 07143672)
References Cited
U.S. Geological Survey, 2023, USGS water data for the Nation: U.S. Geological Survey National Water Information System database, accessed August 2022 at https://doi.org/10.5066/F7P55KJN.
Appendix 5. Surrogate Regression Model Archive Summaries for the Little Arkansas River near Sedgwick, Kansas (U.S. Geological Survey station 07144100)
References Cited
U.S. Geological Survey, 2023, USGS water data for the Nation: U.S. Geological Survey National Water Information System database, accessed August 2022 at https://doi.org/10.5066/F7P55KJN.
Appendix 6. Surrogate Regression Model Archive Summaries for the Little Arkansas River upstream of ASR Facility near Sedgwick, Kansas (U.S. Geological Survey station 375350097262800)
References Cited
U.S. Geological Survey, 2023, USGS water data for the Nation: U.S. Geological Survey National Water Information System database, accessed August 2022 at https://doi.org/10.5066/F7P55KJN.
Appendix 7. Weighted Regressions on Time, Discharge, and Season Concentrations
References Cited
U.S. Geological Survey, 2023, USGS water data for the Nation: U.S. Geological Survey National Water Information System database, accessed August 2022 at https://doi.org/10.5066/F7P55KJN.
Appendix 8. Weighted Regressions on Time, Discharge, and Season Fluxes
References Cited
U.S. Geological Survey, 2023, USGS water data for the Nation: U.S. Geological Survey National Water Information System database, accessed August 2022 at https://doi.org/10.5066/F7P55KJN.
Appendix 9. Weighted Regressions on Time, Discharge, and Season Graphical Output at station 07143672
References Cited
U.S. Geological Survey, 2023, USGS water data for the Nation: U.S. Geological Survey National Water Information System database, accessed August 2022 at https://doi.org/10.5066/F7P55KJN.
Appendix 10. Weighted Regressions on Time, Discharge, and Season Graphical Output at station 07144100
References Cited
U.S. Geological Survey, 2023, USGS water data for the Nation: U.S. Geological Survey National Water Information System database, accessed August 2022 at https://doi.org/10.5066/F7P55KJN.
Appendix 11. Weighted Regressions on Time, Discharge, and Season Estimated Yearly Water-Quality Constituent Loads
References Cited
U.S. Geological Survey, 2023, USGS water data for the Nation: U.S. Geological Survey National Water Information System database, accessed August 2022 at https://doi.org/10.5066/F7P55KJN.
Conversion Factors
U.S. customary units to International System of Units
Temperature in degrees Celsius (°C) may be converted to degrees Fahrenheit (°F) as °F = (1.8 × °C) + 32.
Supplemental Information
Specific conductance is given in microsiemens per centimeter at 25 degrees Celsius (µS/cm at 25 °C).
Turbidity is given in formazin nephelometric units (FNU).
Concentrations of chemical constituents in water are given in either milligrams per liter (mg/L) or micrograms per liter (µg/L).
Concentrations of nitrogen species in water are given in milligrams per liter as nitrogen (mg/L as N).
Concentrations of phosphorus species in water are given in milligrams per liter as phosphorus (mg/L as P).
Bacteria densities in water are given in colony forming units per 100 milliliters (cfu/100 mL).
Abbreviations
<
less than
AMLE
absolute maximum likelihood estimation
AMPA
aminomethylphosphonic acid
ASR
aquifer storage and recovery
deethylatrazine
2-chloro-4-isopropylamino-6-amino-s-triazine
E. coli
Escherichia coli
EGRET
Exploration and Graphics for RivEr Trends
EGRETci
Exploration and Graphics for RivEr Trends Confidence Intervals
EPA
U.S. Environmental Protection Agency
MCL
maximum contaminant level
NPDES
National Pollutant Discharge Elimination System
NWQL
National Water Quality Laboratory
OLS
ordinary least squares
QA/QC
quality assurance and quality control
R2
coefficient of determination
RPD
relative percentage difference
SMCL
secondary maximum contaminant level
THM
trihalomethane
TKN
total Kjeldahl nitrogen
TMDL
total maximum daily load
USGS
U.S. Geological Survey
WBT
Weighted Regressions on Time, Discharge, and Season bootstrap test
WRTDS
Weighted Regressions on Time, Discharge, and Season
For more information about this publication, contact:
Director, USGS Kansas Water Science Center
1217 Biltmore Drive
Lawrence, KS 66049
785–842–9909
For additional information, visit: https://www.usgs.gov/centers/kswsc
Publishing support provided by the
Rolla Publishing Service Center
Disclaimers
Any use of trade, firm, or product names is for descriptive purposes only and does not imply endorsement by the U.S. Government.
Although this information product, for the most part, is in the public domain, it also may contain copyrighted materials as noted in the text. Permission to reproduce copyrighted items must be secured from the copyright owner.
Suggested Citation
Stone, M.L., and Klager, B.J., 2023, Long-term water-quality constituent trends in the Little Arkansas River, south-central Kansas, 1995–2021: U.S. Geological Survey Scientific Investigations Report 2023–5102, 103 p., https://doi.org/10.3133/sir20235102.
ISSN: 2328-0328 (online)
Study Area
| Publication type | Report |
|---|---|
| Publication Subtype | USGS Numbered Series |
| Title | Long-term water-quality constituent trends in the Little Arkansas River, south-central Kansas, 1995–2021 |
| Series title | Scientific Investigations Report |
| Series number | 2023-5102 |
| DOI | 10.3133/sir20235102 |
| Publication Date | September 26, 2023 |
| Year Published | 2023 |
| Language | English |
| Publisher | U.S. Geological Survey |
| Publisher location | Reston, VA |
| Contributing office(s) | Kansas Water Science Center |
| Description | Report: ix, 103 p.; 1 Figure; 9 Tables; 5 Appendixes; Dataset |
| Country | United States |
| State | Kansas |
| Online Only (Y/N) | Y |
| Additional Online Files (Y/N) | Y |