


The purpose of these interpretive discussions is to provide a perspective on regional- and national-scale variations in element and mineral distributions in soils and their likely causes. The significant spatial variations shown by most elements and minerals can commonly be attributed to geologic sources in underlying parent materials, but other spatial variations seem clearly related to additional factors such as climate, the age of soils, transported source material, and anthropogenic influences. We attempt to distinguish the influence of these various factors on a regional and national scale. Numerous more local features might similarly be related to these same factors, but these features also have some probability of being an artifact of a random sampling of variable compositions, so that there is some probability of samples with similar compositions occurring in clusters of two or more adjacent sites by chance. Distinguishing such random occurrences from true variability is beyond the scope of the data from which these maps are constructed. Some caution, therefore, is advisable in interpreting the significance of these more local features unless some unique sources or processes can clearly be related to them.
Phosphorus (P) is a nonmetallic element used extensively in the production of fertilizers. Phosphorus is also used in the manufacture of flares, safety matches, fireworks, detergents, and pesticides. It is an essential element for all living organisms and is one of the major nutrients for plants. Two allotropes, or common forms, of P are white P and red P. White P is toxic and can cause severe burns on contact with skin. It is spontaneously flammable on contact with air. Red P is a nontoxic solid. Information on the toxic properties of white P is available at the Environmental Protection Agency (EPA) website (click here).
Phosphorus is an important element in soil because it is indispensable for biochemical activity in living cells. The average P concentration in the Earth's upper continental crust is approximately 655 milligrams per kilogram (mg/kg) (Rudnick and Gao, 2003). Phosphorus is somewhat enriched in mafic and felsic rocks with an average concentration of about 1,200 mg/kg in mafic rocks, such as basalt, and 750 mg/kg in felsic rocks, such as granite and rhyolite. Phosphorus concentrations in shale average about 800 mg/kg. Limestone (350 mg/kg) and sandstone (30 mg/kg) contain, on average, less P than the other common rock types. Marine phosphorites, exploited commercially to produce phosphate fertilizer, may contain a few percent P. Important phosphate minerals include apatite, xenotime, and monazite. These minerals are resistant to weathering, and thus they can be present in derivative sedimentary rocks and in unconsolidated materials, such as alluvial, eolian, and glacial deposits. Monazite and xenotime are common detrital heavy minerals that, when released from their parent rock by weathering, can accumulate by density sorting in fluvial, lacustrine, or oceanic coastal shoreline settings. Weathering processes that break down minerals more soluble than apatite can create relatively insoluble secondary crystalline apatite or phosphate pellets.
The P cycle in soil is complex and, because P is an essential plant nutrient, there is extensive literature describing it in the environment (for example, Sharpley, 1995; Smil, 2000). Briefly, soil apatite dissolves slowly, and when a soluble phosphate ion (HPO42–) is released, it can be immobilized by absorbing to plant roots or by being fixed as iron (Fe) and aluminum (Al) phosphates. Plants can take up HPO42–, but they are unable to take up more insoluble forms of P. Phosphate fertilizer is widely applied to many agricultural fields to alleviate soluble P deficiencies. Thus, the distribution of P in soils across the conterminous United States is dependent on the original P concentration of the soil parent material, P transformations and movement during soil formation (weathering and leaching), and certain human activities.
The distribution of mineral resource deposits with P (and phosphate rock) as a commodity (major or minor) in the United States, extracted from the U.S. Geological Survey (USGS) Mineral Resource Data System (MRDS) website, can be seen by hovering the mouse here. Statistics and information on the worldwide supply of, demand for, and flow of P–bearing materials are available through the USGS National Minerals Information Center (NMIC) website. The Western Phosphate Field (inside the dashed line) contains outcrop exposures of the Phosphoria Formation (click here to open USGS Fact Sheet 100–02; Hein, 2002). Much of the phosphate mined in Idaho is from the Phosphoria Formation. In central Tennessee rock phosphate is mined from weathered phosphatic limestone bedrock. In west central Florida, phosphate is mined from phosphate–rich sands.
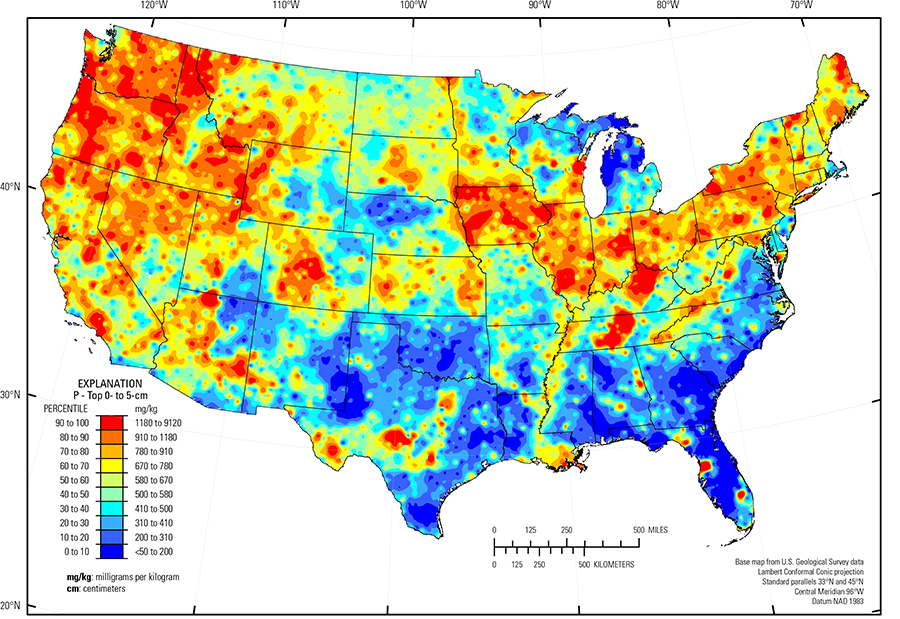
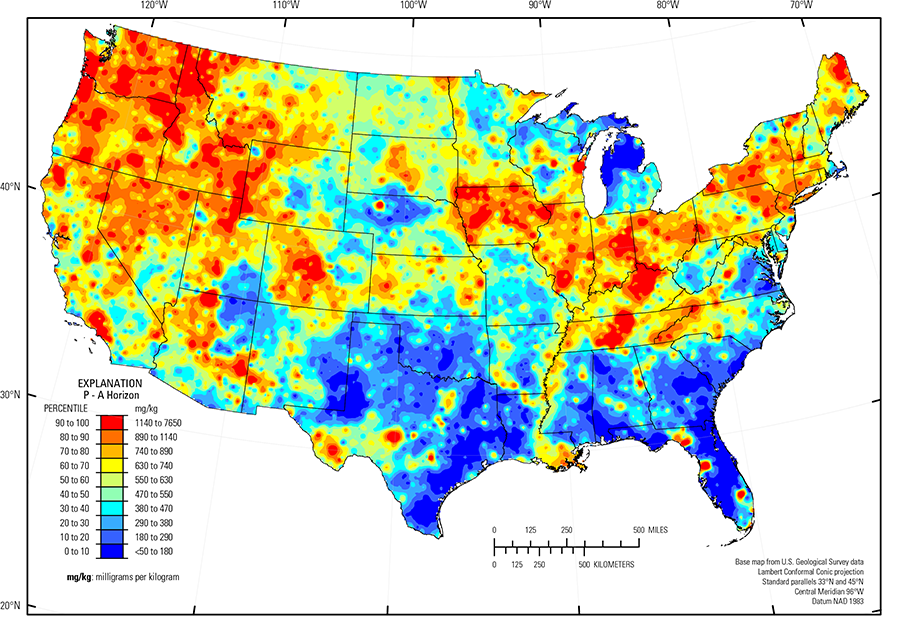
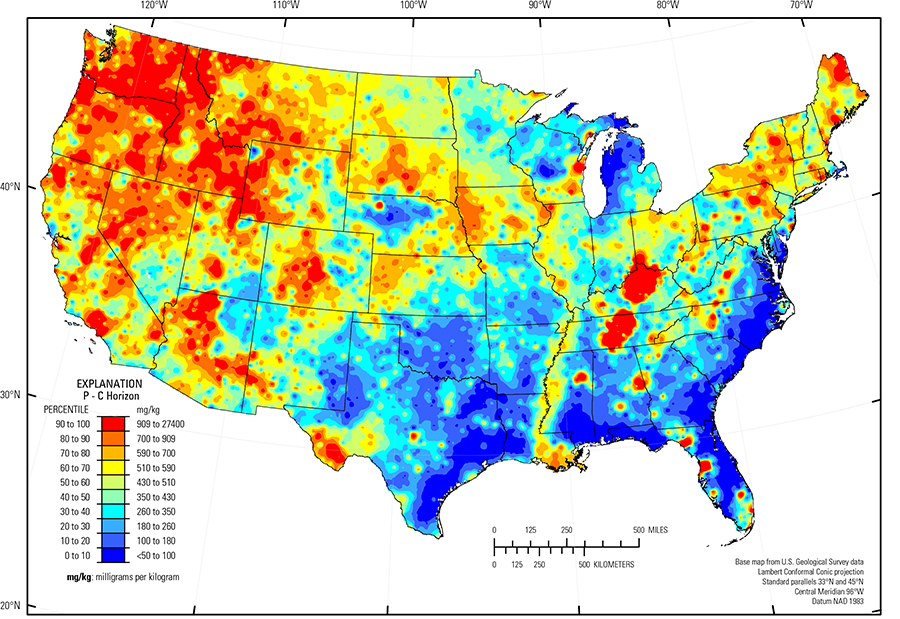
In our data, the median concentration of P is 430 mg/kg in the soil C horizon, 550 mg/kg in the soil A horizon, and 580 mg/kg in the top 0- to 5-cm layer (see the summary statistics [open in new window]). The broad spatial map patterns for P among the three sample types are generally similar to one another. Nonetheless, important regional differences in P concentrations exist between topsoils (the soil A horizon and the top 0- to 5-cm layer) and the soil C horizon.
Phosphorus in the soil C horizon generally reflects the composition of soil parent materials. The highest P concentrations in all soil samples occur in the Kentucky Bluegrass area (USDA, 2006) of central Kentucky, where soil developed on phosphatic limestone, similar in geologic age to phosphatic limestone in the Nashville Basin (USDA, 2006) in central Tennessee. Other instances where P in soil is mainly derived from marine sedimentary rocks include:
- Limestone or shale in northwestern California;
- Cherty limestone in northwestern Arizona;
- Shale in western South Dakota; and
- Limestone and shale across the southern tier of New York.
Many soils with elevated P also occur in areas where the mineral apatite derived from igneous or metamorphic rocks was likely present in the soil parent materials. Because apatite is resistant to weathering, it may persist in soil developed on volcanic ash where other primary minerals and volcanic glass have weathered to clays. Examples of where P in soil may have a volcanic or metamorphic link include:
- Washington and Oregon; soils developed on volcanic rocks, related alluvium, and possibly volcanic ash layers;
- Southern California Mountains (USDA, 2006); soil developed on Precambrian anorthosite. In some areas, soil also may have developed on marine shale;
- Trans–Pecos volcanics (Schruben and others, 1997), Texas; soils developed on rhyolite, alkalic volcanic rocks and related alluvium;
- Mogollon Transition (USDA, 2006), Arizona; soils mainly developed on alluvium derived from volcanic rocks, including granite and basalt; and
- Southern Rocky Mountains (USDA, 2006), Colorado, where soils mainly developed on granitic, volcanic, and metamorphic rocks —in some areas soils may have developed on shale.
Areas with low P concentration in all sample types include:
- Nebraska Sand Hills (USDA, 2006), an area of quartz– and plagioclase–rich unconsolidated sand dunes and sand sheets;
- Southern High Plains (USDA, 2006), eastern New Mexico and northwestern Texas, an area of quartz–rich eolian sands and alluvial sediments;
- Sandy soil of the glaciated Upper Midwest in northern and central Wisconsin, and northern and eastern Michigan; and
- Most of the soils in the Gulf and Atlantic Coastal Plain (Fenneman and Johnson, 1946) that developed on quartz–rich sedimentary rocks and unconsolidated sediment.
The Gulf and Atlantic Coastal Plain is bisected by the Southern Mississippi River Alluvium and the Southern Mississippi Valley Loess (USDA, 2006). Alluvial sediments were deposited in the Mississippi River valley as the river flooded in recent geologic time. When these sediments dried, winds picked up the fine material and deposited it in thick loess sheets, mainly along the east side of the river valley. The youngest loess sheets are about 10,000 years old. A pattern of higher P in soil developed on these young sediments reflects long–range transport of P–bearing materials from the upper part of the Mississippi River drainage basin.
Soils were analyzed for total P, so it is not possible to differentiate among the many P species (for example, plant soluble vs. insoluble) that may have been present in a sample at the time of collection. Crop harvesting, incorporation of plant residues, and application of fertilizer or manure all can create large variations in P concentrations in space and time in the soil A horizon (often an Ap horizon —the plow zone in an agricultural field) and the top 0- to 5-cm layer. For example, across much of Iowa, southern Minnesota and Wisconsin, Illinois, Indiana, and western Ohio, total P concentrations in topsoils are, in general, higher than P concentrations in the soil C horizon. This is an area often called the 'Corn Belt'. For some specific sites, there is as much as a ten–fold increase from subsoil to topsoils. For soils where agriculture is the identified principal land use, this difference suggests possible application of phosphate fertilizer or animal manure that may exceed plant uptake. Soil texture may also have a role in applied P retention. A comparison of P concentration vs. clay concentration for agricultural fields in the Upper Midwest suggests that clay–rich soil may retain more P than sandy soil. Thus, the distribution of P across the conterminous United States identifies areas of high natural concentrations of P as well as human introduction of P to surface soils.
Statistics - 0 TO 5 CM
| Number of samples | 4,841 |
| LLD | 50 mg/kg |
| Number below LLD | 34 |
| Minimum | <50 mg/kg |
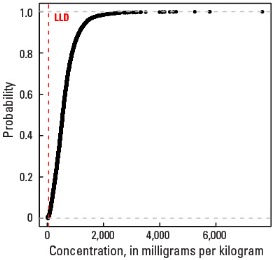
| 5 percentile | 140 mg/kg |
| 25 percentile | 360 mg/kg |
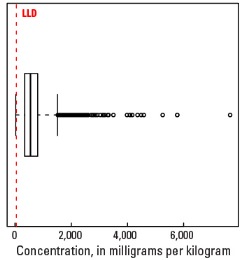
| 50 percentile | 580 mg/kg |
| 75 percentile | 840 mg/kg |
| 95 percentile | 1,390 mg/kg |
| Maximum | 9,120 mg/kg |
| MAD | 356 mg/kg |
| Robust CV | 61.3% |
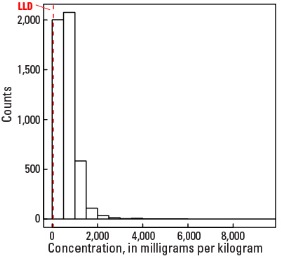
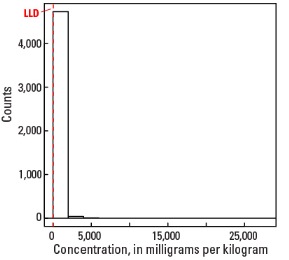
Histogram
Boxplot
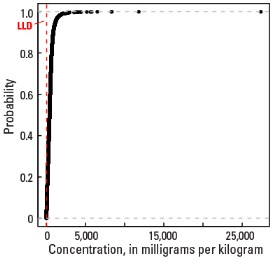
Empirical cumulative distribution function
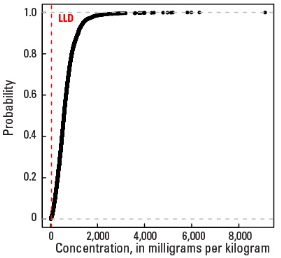
Statistics - A Horizon
| Number of samples | 4,813 |
| LLD | 50 mg/kg |
| Number below LLD | 42 |
| Minimum | <50 mg/kg |
| 5 percentile | 120 mg/kg |
| 25 percentile | 340 mg/kg |
| 50 percentile | 550 mg/kg |
| 75 percentile | 810 mg/kg |
| 95 percentile | 1,390 mg/kg |
| Maximum | 7,650 mg/kg |
| MAD | 341 mg/kg |
| Robust CV | 62 % |
Histogram
Boxplot
Empirical cumulative distribution function
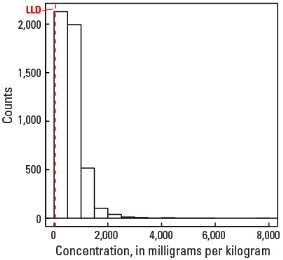
Statistics - C Horizon
| Number of samples | 4,780 |
| LLD | 50 mg/kg |
| Number below LLD | 119 |
| Minimum | <50 mg/kg |
| 5 percentile | 70 mg/kg |
| 25 percentile | 220 mg/kg |
| 50 percentile | 430 mg/kg |
| 75 percentile | 640 mg/kg |
| 95 percentile | 1,190 mg/kg |
| Maximum | 27,400 mg/kg |
| MAD | 311 mg/kg |
| Robust CV | 72.4 % |
Histogram
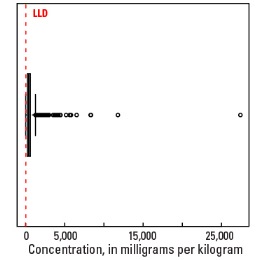
Boxplot