


The purpose of these interpretive discussions is to provide a perspective on regional- and national-scale variations in element and mineral distributions in soils and their likely causes. The significant spatial variations shown by most elements and minerals can commonly be attributed to geologic sources in underlying parent materials, but other spatial variations seem clearly related to additional factors such as climate, the age of soils, transported source material, and anthropogenic influences. We attempt to distinguish the influence of these various factors on a regional and national scale. Numerous more local features might similarly be related to these same factors, but these features also have some probability of being an artifact of a random sampling of variable compositions, so that there is some probability of samples with similar compositions occurring in clusters of two or more adjacent sites by chance. Distinguishing such random occurrences from true variability is beyond the scope of the data from which these maps are constructed. Some caution, therefore, is advisable in interpreting the significance of these more local features unless some unique sources or processes can clearly be related to them.
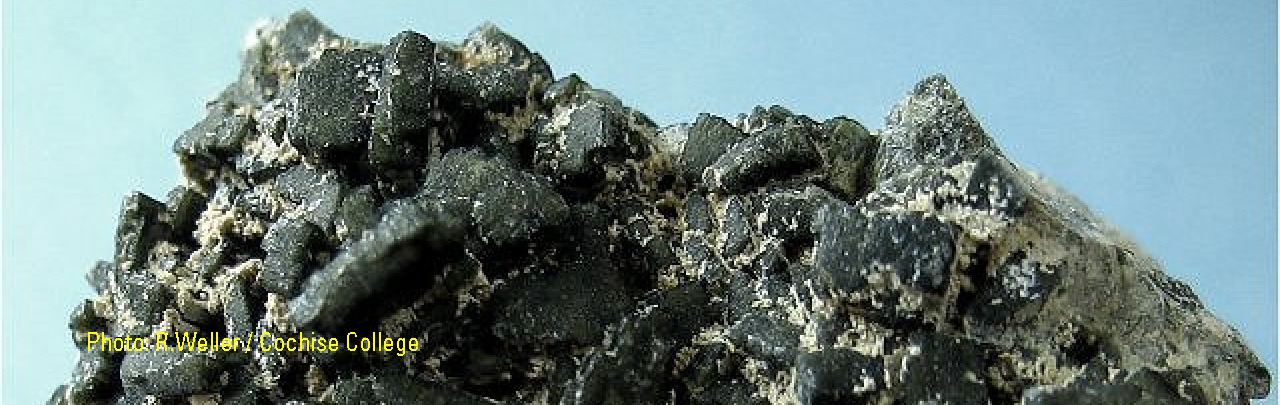
Pyroxenes are a group of silicate minerals with complex and variable chemical compositions. A generalized formula is ABSi2O6, in which A and B are varying proportions of calcium (Ca), iron (Fe), magnesium (Mg), and in some cases lesser amounts of aluminum (Al), sodium (Na), titanium (Ti), manganese (Mn), chromium (Cr), and vanadium (V). Pyroxenes also have a significantly variable crystal structure, so different pyroxene minerals produce varying diffraction patterns in X-ray analyses. For our quantification calculations, we have used a single crystal structure (diopside, CaMgSi2O6) so we may not have fully quantified pyroxenes with significantly different structures. Pyroxenes form mostly in mafic igneous rocks at high temperatures and are generally chemically unstable at conditions of the Earth's surface where they break down readily in many soil–forming environments. This combination of limited bedrock sources and chemical instability results in only a few areas where pyroxenes form a significant portion of soils.
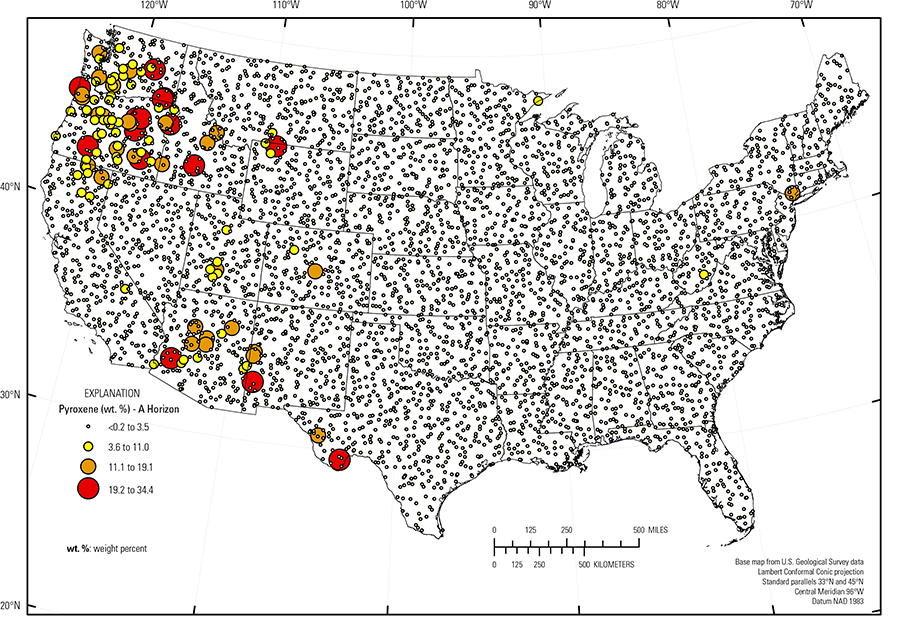
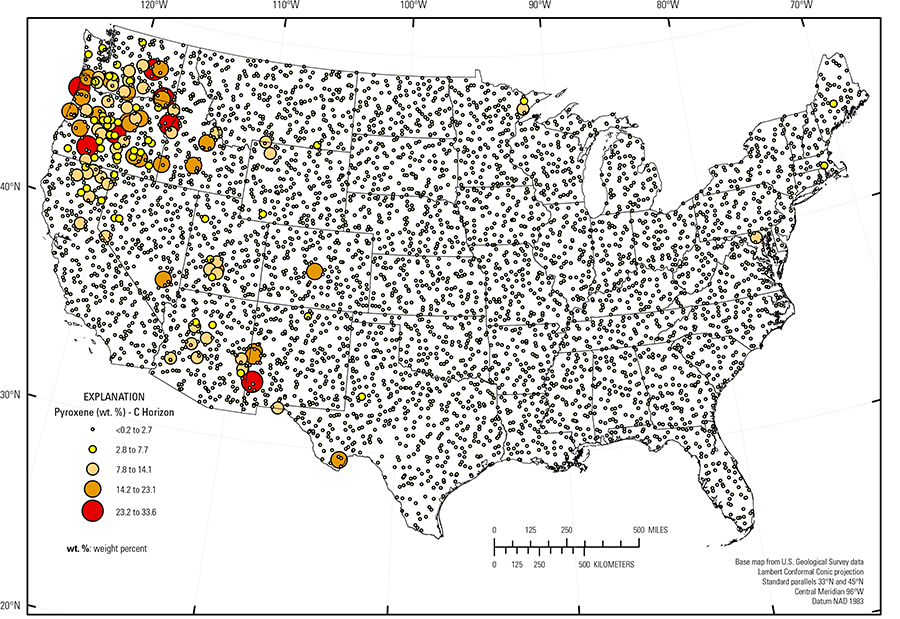
Because pyroxenes were detected only rarely, their distribution is shown by proportional symbols rather than as a continuous interpolated surface (see the summary statistics [open in new window]).
The principal occurrences of pyroxene–bearing soils are in the Pacific Northwest where pyroxenes are detectable in roughly half of the soil samples and locally form more than 20 weight percent (wt. %) of the soil. The source of the pyroxenes is mafic igneous rocks, largely of Cenozoic age, that are common in this area. Relatively dry climate of some of this area may also be a factor in preserving pyroxenes in the surface environment, although some soils in very high rainfall (PRISM climate group) regions along the Pacific Coast also contain pyroxenes. Lesser amounts of pyroxene–bearing soil also occur overlying or near mafic volcanic rocks in the Arizona and New Mexico Mountains (USDA, 2006), Trans–Pecos volcanic rocks (Schruben and others, 1997) in western Texas, and the southern Wasatch and Uinta Mountains (USDA, 2006) in Utah. Pyroxenes also occur in soil over glacial deposits that are composed largely of local Precambrian mafic igneous rocks in northeastern Minnesota.
Statistics - 0 TO 5 CM
Statistics - A Horizon
| Number of samples | 4,802 |
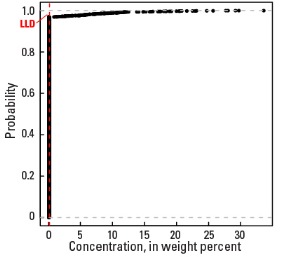
| LLD | 0.2 wt. % |
| Number below LLD | 4,655 |
| Minimum | <0.2 wt. % |
| 5 percentile | <0.2 wt. % |
| 25 percentile | <0.2 wt. % |
| 50 percentile | <0.2 wt. % |
| 75 percentile | <0.2 wt. % |
| 95 percentile | <0.2 wt. % |
| Maximum | 34.4 wt. % |
| MAD | |
| Robust CV |
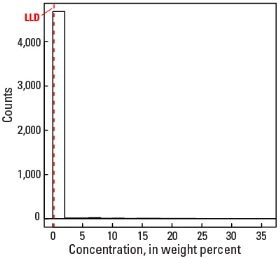
Histogram
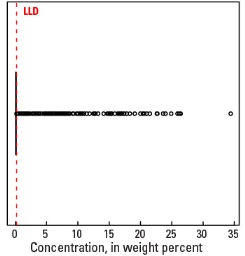
Boxplot

Empirical cumulative distribution function
Statistics - C Horizon
| Number of samples | 4,773 |
| LLD | 0.2 wt. % |
| Number below LLD | 4,626 |
| Minimum | <0.2 wt. % |
| 5 percentile | <0.2 wt. % |
| 25 percentile | <0.2 wt. % |
| 50 percentile | <0.2 wt. % |
| 75 percentile | <0.2 wt. % |
| 95 percentile | <0.2 wt. % |
| Maximum | 33.6 wt. % |
| MAD | |
| Robust CV |
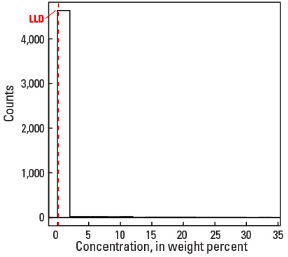
Histogram

Boxplot