


The purpose of these interpretive discussions is to provide a perspective on regional- and national-scale variations in element and mineral distributions in soils and their likely causes. The significant spatial variations shown by most elements and minerals can commonly be attributed to geologic sources in underlying parent materials, but other spatial variations seem clearly related to additional factors such as climate, the age of soils, transported source material, and anthropogenic influences. We attempt to distinguish the influence of these various factors on a regional and national scale. Numerous more local features might similarly be related to these same factors, but these features also have some probability of being an artifact of a random sampling of variable compositions, so that there is some probability of samples with similar compositions occurring in clusters of two or more adjacent sites by chance. Distinguishing such random occurrences from true variability is beyond the scope of the data from which these maps are constructed. Some caution, therefore, is advisable in interpreting the significance of these more local features unless some unique sources or processes can clearly be related to them.
Cadmium (Cd) is a metallic trace element primarily used in the production of rechargeable nickel–cadmium (Ni–Cd) batteries. It is also used as a pigment, as a stabilizer for plastics, and in electroplating of steel. Cadmium is known to have adverse effects on soil biological activity, plant metabolism, and the health of humans and animals. More information about the toxicity of Cd (or other elements and substances) and its potential negative human health impacts can be found at the Agency for Toxic Substances and Disease Registry (ATSDR) website, or click to download a fact sheet about Cd.
Geochemically, Cd is strongly associated with zinc (Zn) and commonly occurs in Zn minerals. Small amounts of Cd are also present in mica and amphibole. In soils, Cd has an affinity for organic matter.
The average concentration of Cd in the Earth's upper continental crust is estimated to be 0.06 milligrams per kilogram (mg/kg) (Hu and Gao, 2008). Marine phosphorites, exploited commercially for the production of phosphate fertilizer, are highly elevated in Cd with concentrations ranging from 3 to 300 mg/kg. Cadmium concentrations are also elevated in coal averaging about 1 mg/kg. Limited data on the loess deposits of the central United States indicate Cd concentrations are somewhat elevated with an average concentration of about 0.17 mg/kg. Compared to the more common rock types, shale is generally elevated in Cd with concentrations averaging about 0.25 mg/kg, whereas sandstone contains, on average, <0.04 mg/kg, limestone about 0.1 mg/kg, and granite and basalt about 0.1–0.2 mg/kg.
The distribution of mineral resource deposits with Cd as a commodity (major or minor) in the United States, extracted from the U.S. Geological Survey (USGS) Mineral Resource Data System (MRDS) website, can be seen by hovering the mouse here. Statistics and information on the worldwide supply of, demand for, and flow of Cd–bearing materials are available through the USGS National Minerals Information Center (NMIC) website.
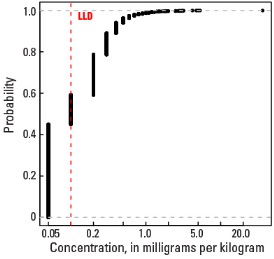
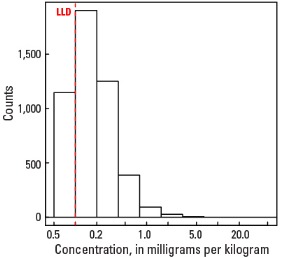
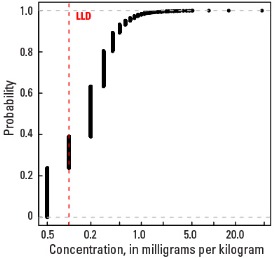
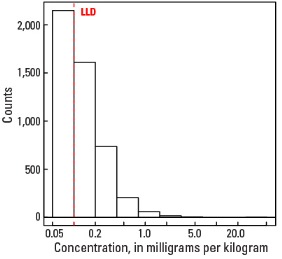
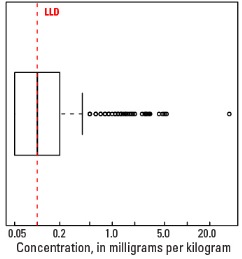
In our data, the lower limit of determination (LLD) for Cd is 0.1 mg/kg (see the summary statistics). Cadmium concentrations in 1,054 of 4,841 samples (21.8 percent) are below the LLD in the top 0- to 5-cm layer; 1,146 of 4,813 samples (23.8 percent) in the soil A horizon; and 2,149 of 4,780 samples (45.0 percent) in the soil C horizon. It is also important to note that 90 percent of the Cd concentrations are less than 0.5 mg/kg for the soil A horizon and for the top 0- to 5-cm layer, and less than 0.4 mg/kg for the soil C horizon. Thus, most of the data for all three sample types are within 5 times the LLD. Data this close to the LLD lack the precision of higher concentration data and spatial patterns generated from such data must be viewed with some degree of caution.
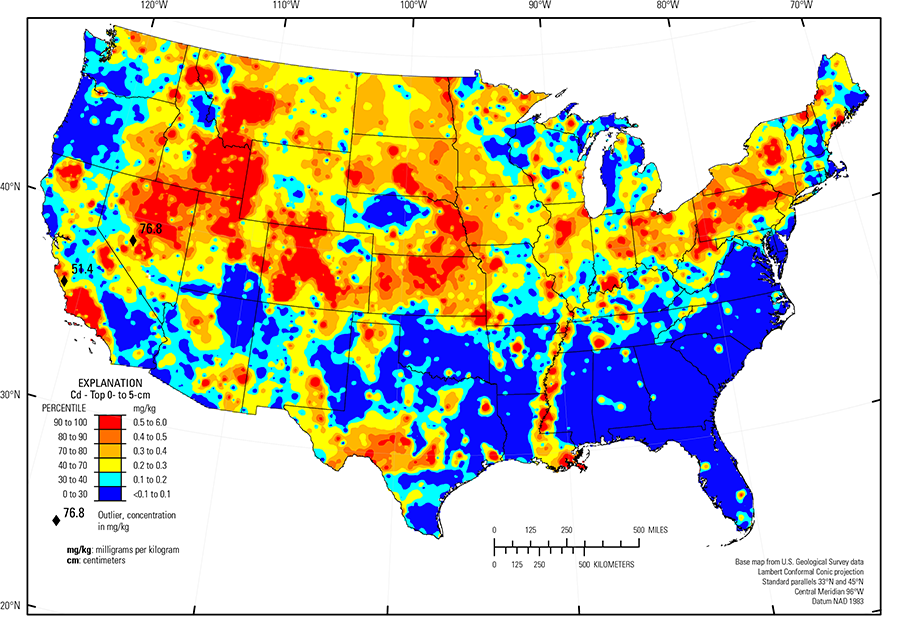
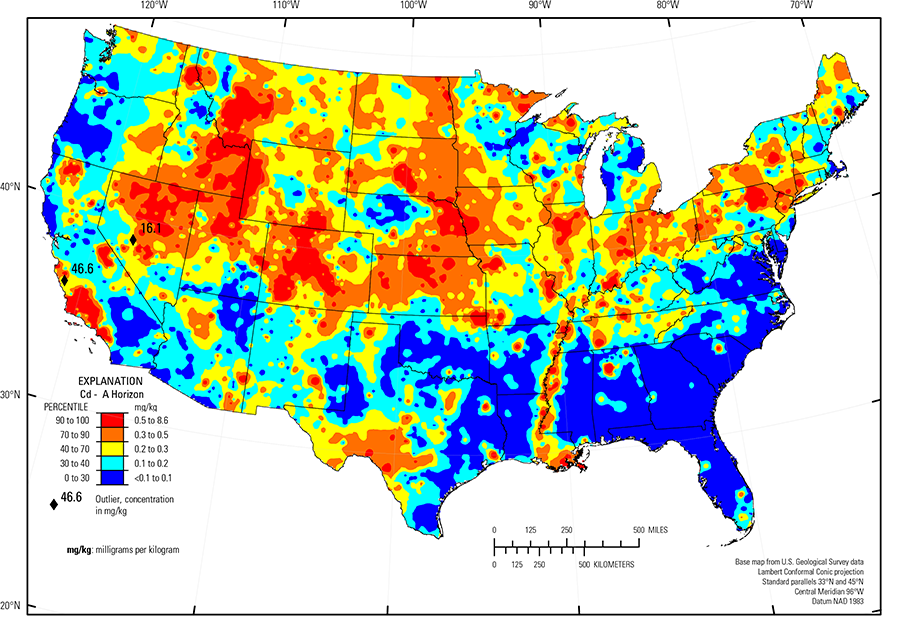
In generating geochemical maps, we normally used 10 classes for color–coding the element concentrations. However, given the characteristics of the data for Cd, the percentile representation was modified so that all values below the LLD are included in the lowest concentration class and the remaining values are shown by the appropriate percentile values and colors. This resulted in the lowest concentration class containing 30 percent of the Cd data for both the soil A horizon and for the top 0- to 5-cm layer and 50 percent of the data for the soil C horizon. Some of the higher percentile classes were also combined because the same concentration represents more than one percentile. Note that concentration classes in the map explanation generally differ by only 0.1 mg/kg, so the observed geochemical patterns on the maps have their basis in this very small concentration difference.
Even with the limitations of the Cd data, geochemical patterns are delineated that can be interpreted in terms of underlying soil parent materials. However, having so much of the data below the LLD means the observed patterns only represent the spatial distribution of the higher concentrations.
Our data show that the median Cd concentration for the top 0- to 5-cm layer and the soil A horizon is 0.2 mg/kg, whereas the median concentration for the soil C horizon is 0.1 mg/kg (see the summary statistics [open in new window]). It thus appears that the topsoils are enriched in Cd compared with the deeper soils, but this observation must be tempered with the realization that these values are equal to or only slightly above the LLD.
The distribution of Cd in soils of the conterminous United States is primarily controlled by the composition of underlying soil parent materials. Areas of elevated Cd concentrations include:
- Western Phosphate Field (Hein, 2002) of eastern Idaho, southwestern Montana, western Wyoming, and northern Utah where exposures of marine phosphorites occur;
- Areas underlain by shale in southern California, just north of Los Angeles;
- Areas in eastern Montana, North Dakota, South Dakota, eastern Nebraska, Kansas, Iowa, Illinois, Indiana, Kentucky, Ohio, and Pennsylvania, where soil parent materials are shale, clayey till, loess, or glacial deposits containing shale fragments;
- In areas of western Texas underlain by limestone bedrock (Texas carbonate terrane); and
- In northern Idaho, western Montana, west-central Colorado, eastern Missouri, and near the junction of Oklahoma, Missouri, and Kansas in areas of historical or current mining activities where Cd was present as a minor constituent of ore. Soils in these areas may be formed on mineralized bedrock containing elevated concentrations of Cd. In areas of extensive mining and mineral processing, it is also possible that there may be a component of Cd contamination from these activities superimposed on the elevated background concentrations.
Black shale also contributes to the Cd pattern in soil across the lower Great Lakes region as best observed in the map for the soil C horizon. In the Upper Midwest, melting of glacial ice following late Wisconsinan period advances (16,000 to 12,000 years ago) left the region north of the southern glacial limit (Soller and others, 2012) mantled with a blanket of mixed, immature sediments, from which present–day soils developed. Individual ice lobes (Grimley, 2000) created distinct patterns in soil mineralogy and geochemistry because of varying provenance and ice transport paths. 'Gray' (carbonate– and shale–rich) till in the James and Des Moines lobes (Grimley, 2000) was derived from Cretaceous sedimentary rocks (dolostone, limestone, and shale). These gray tills have elevated Cd concentrations mostly from the shale contribution. In contrast, 'red' quartz– and feldspar–rich till deposited in central Minnesota, northwestern Michigan, and northern Wisconsin has a Precambrian crystalline rock/red sandstone provenance with no material derived from shale, and thus, soils have low Cd concentrations. Soils with elevated Cd concentrations in northern Illinois, eastern Michigan, eastern Indiana, and western Ohio, developed on glacial deposits that incorporated black shale clasts. This shale signature was created by ice of the Lake Michigan and Huron–Erie lobes (Grimley, 2000), which spread black shale material beyond where the bedrock is exposed near the surface in central Ohio).
The Gulf and Atlantic Coastal Plain (Fenneman and Johnson, 1946) is bisected by the Southern Mississippi River Alluvium and the Southern Mississippi Valley Loess (USDA, 2006). Alluvial sediments have deposited in the Mississippi River valley as the river flooded in recent geologic time. When these sediments dried, winds picked up the fine material and deposited it in thick loess sheets, mainly along the east side of the river valley. The youngest loess sheets are about 10,000 years old. A pattern of higher Cd in soils developed on these young sediments reflects long–range transport of Cd–bearing material from the upper part of the Mississippi River drainage basin.
Low Cd concentrations in soils are observed in:
- Atlantic Coastal Plain and Piedmont (Fenneman and Johnson, 1946), where soil parent materials are dominantly quartz–rich igneous, metamorphic, or sedimentary rocks and unconsolidated sediments;
- Nebraska Sand Hills (USDA, 2006), where soil parent materials are quartz– and plagioclase–rich unconsolidated sand dunes and sand sheets;
- Colorado Plateau (USDA, 2006), where quartz–rich sandstone and eolian deposits are the dominant parent materials; and
- Parts of the Southern High Plains (USDA, 2006) of New Mexico and Texas where parent materials consist of quartz–rich eolian sand and alluvial sediments.
Statistics - 0 TO 5 CM
| Number of samples | 4,841 |
| LLD | 0.1 mg/kg |
| Number below LLD | 1,054 |
| Minimum | <0.1 mg/kg |
| 5 percentile | <0.1 mg/kg |
| 25 percentile | 0.1 mg/kg |
| 50 percentile | 0.2 mg/kg |
| 75 percentile | 0.3 mg/kg |
| 95 percentile | 0.7 mg/kg |
| Maximum | 76.8 mg/kg |
| MAD | ND |
| Robust CV | ND |
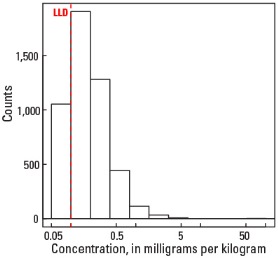
Histogram
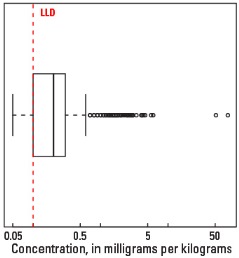
Boxplot
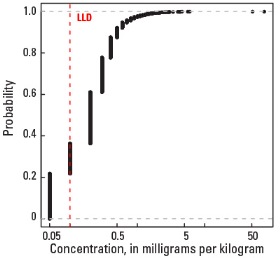
Empirical cumulative distribution function
Statistics - A Horizon
| Number of samples | 4,813 |
| LLD | 0.1 mg/kg |
| Number below LLD | 1,146 |
| Minimum | <0.1 mg/kg |
| 5 percentile | <0.1 mg/kg |
| 25 percentile | 0.1 mg/kg |
| 50 percentile | 0.2 mg/kg |
| 75 percentile | 0.3 mg/kg |
| 95 percentile | 0.6 mg/kg |
| Maximum | 46.6 mg/kg |
| MAD | ND |
| Robust CV | ND |
Histogram
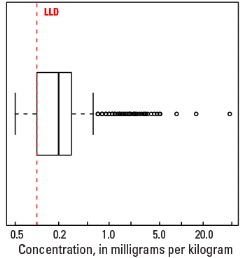
Boxplot
Empirical cumulative distribution function
Statistics - C Horizon
| Number of samples | 4,780 |
| LLD | 0.1 mg/kg |
| Number below LLD | 2,149 |
| Minimum | <0.1 mg/kg |
| 5 percentile | <0.1 mg/kg |
| 25 percentile | <0.1 mg/kg |
| 50 percentile | 0.1 mg/kg |
| 75 percentile | 0.2 mg/kg |
| 95 percentile | 0.5 mg/kg |
| Maximum | 36.4 mg/kg |
| MAD | ND |
| Robust CV | ND |
Histogram
Boxplot