


The purpose of these interpretive discussions is to provide a perspective on regional- and national-scale variations in element and mineral distributions in soils and their likely causes. The significant spatial variations shown by most elements and minerals can commonly be attributed to geologic sources in underlying parent materials, but other spatial variations seem clearly related to additional factors such as climate, the age of soils, transported source material, and anthropogenic influences. We attempt to distinguish the influence of these various factors on a regional and national scale. Numerous more local features might similarly be related to these same factors, but these features also have some probability of being an artifact of a random sampling of variable compositions, so that there is some probability of samples with similar compositions occurring in clusters of two or more adjacent sites by chance. Distinguishing such random occurrences from true variability is beyond the scope of the data from which these maps are constructed. Some caution, therefore, is advisable in interpreting the significance of these more local features unless some unique sources or processes can clearly be related to them.
Nickel (Ni) is a metallic trace element used extensively in the production of stainless steel, nonferrous alloys, and superalloys, used to make parts for gas turbine engines. Other uses include rechargeable nickel–cadmium (Ni–Cd) batteries, coinage, and catalysts. Nickel is essential for some bacteria, plants, and domestic animals, and humans; although in large doses Ni can be toxic to humans. More information about the toxicity of Ni (or other elements and substances) and its potential negative human health impacts can be found at the Agency for Toxic Substances and Disease Registry (ATSDR) website, or click to download a fact sheet about Ni.
Nickel occurs primarily in sulfide minerals, but also may form arsenides and antimonides. It frequently substitutes for iron (Fe) or magnesium (Mg) in minerals such as olivine, pyroxene, amphibole, and garnet. In soils, Ni may be associated with Fe and manganese (Mn) hydroxides and it has a tendency to sorb onto clay minerals and organic matter.
The average abundance of Ni in the Earth's upper continental crust is estimated to be 34 milligrams per kilogram (mg/kg) (Hu and Gao, 2008). Ultramafic rocks, such as serpentinite and peridotite, have highly elevated concentrations of Ni with concentrations as much as a few thousand mg/kg. Mafic rocks, such as basalt, have an average Ni concentration of about 130 mg/kg. Among the other common rock types, shale has elevated Ni with an average concentration of about 70 mg/kg. In contrast, the average Ni concentration is only about 2 mg/kg in sandstone and about 5 mg/kg in limestone and granite.
The distribution of mineral resource deposits with Ni as a commodity (major or minor) in the United States, extracted from the U.S. Geological Survey (USGS) Mineral Resource Data System (MRDS) website, can be seen by hovering the mouse here. Statistics and information on the worldwide supply of, demand for, and flow of Ni–bearing materials are available through the USGS National Minerals Information Center (NMIC) website.
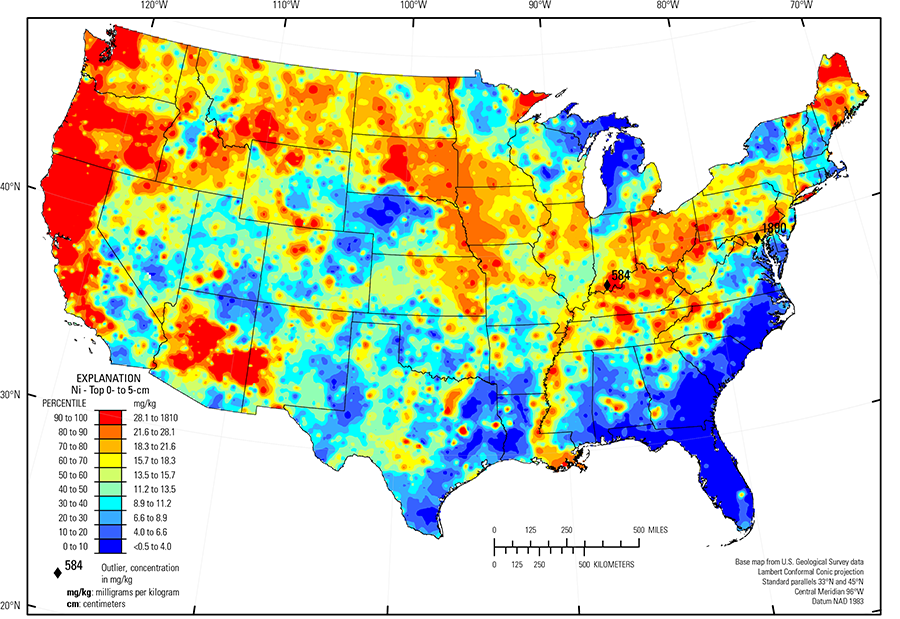
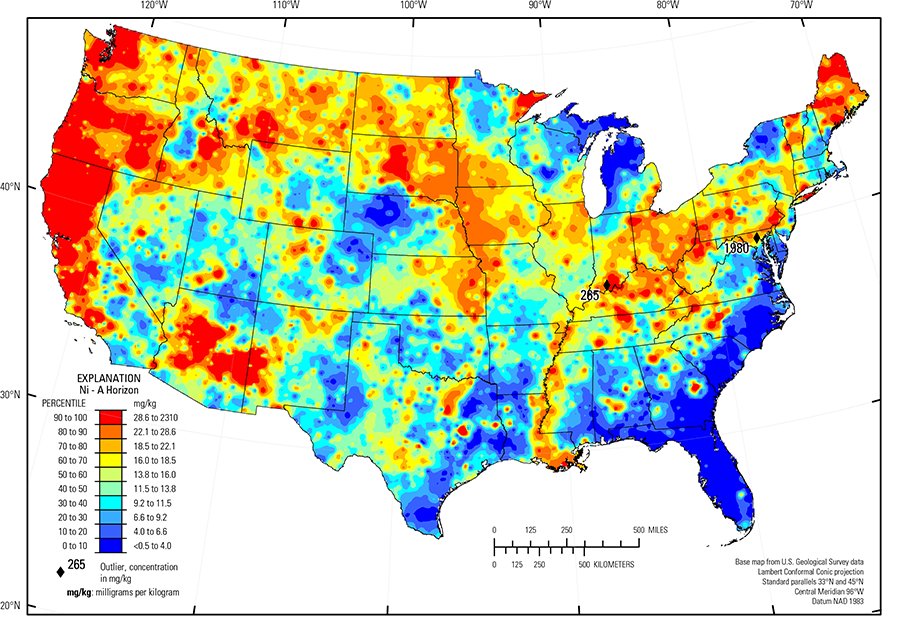
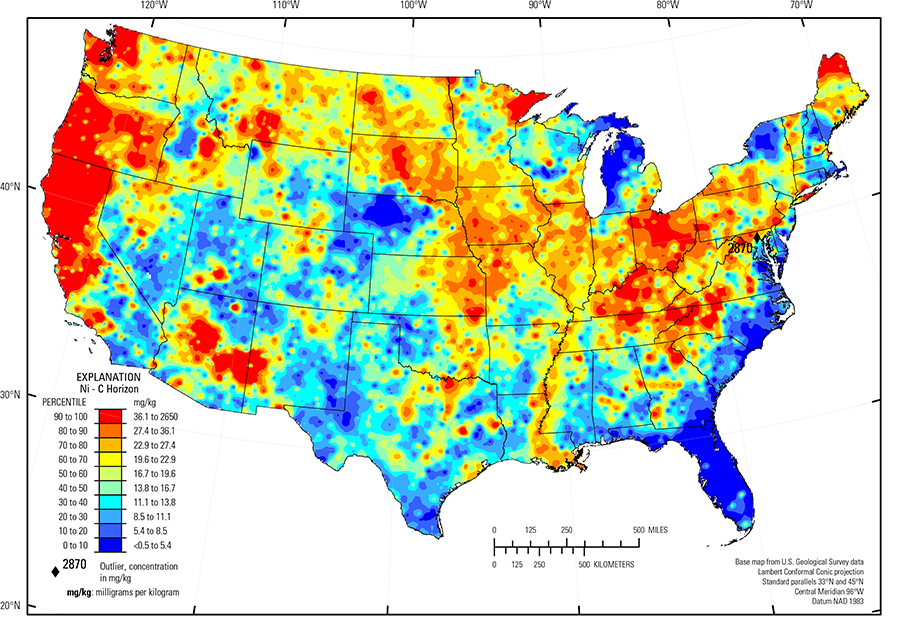
In our data, the median Ni concentration is slightly higher in the soil C horizon (16.7 mg/kg) than in the soil A horizon (13.8 mg/kg) and the top 0- to 5-cm layer (13.5 mg/kg) (see the summary statistics [open in new window]). This indicates that Ni is somewhat mobile in the near–surface weathering environment. In general, the geochemical maps for the three sample types are quite similar for Ni.
The distribution of Ni in soils of the conterminous United States is primarily controlled by the composition of underlying soil parent materials. Areas of elevated Ni concentrations in soils are seen in:
- Northern California, Oregon, western Washington, central Maryland, extreme southeastern Pennsylvania, central and western North Carolina, northeastern Minnesota, and central Arizona, where parent materials for soils are, at least in part, ultramafic or mafic rocks or glacial deposits derived from these rock types; and
- Eastern Montana, North Dakota, South Dakota, Iowa, eastern Nebraska, eastern Kansas, northern Missouri, Illinois, Indiana, Kentucky, Ohio, and Pennsylvania, where parent materials are dominantly marine shale, clayey till or glacial deposits containing a significant amount of shale
The Gulf and Atlantic Coastal Plain (Fenneman and Johnson, 1946) is bisected by the Southern Mississippi River Alluvium and the Southern Mississippi Valley Loess (USDA, 2006). Alluvial sediments have deposited in the Mississippi River valley as the river flooded in recent geologic time. When these sediments dried, winds picked up the fine material and deposited it in thick loess sheets, mainly along the east side of the river valley. The youngest loess sheets are about 10,000 years old. A pattern of higher Ni concentrations in soils developed on these young sediments reflects long–range transport of Ni–bearing material from the upper part of the Mississippi River drainage basin.
Areas of low Ni concentrations in soils include:
- Gulf and Atlantic Coastal Plain (Fenneman and Johnson, 1946) where parent materials are dominantly quartz–rich sedimentary rocks and unconsolidated sediment;
- Nebraska Sand Hills (USDA, 2006), where parent materials are quartz– and plagioclase–rich, unconsolidated sand dunes and sand sheets; and
- Southern High Plains (USDA, 2006) of eastern New Mexico and Texas where parent materials are quartz–rich eolian sands and alluvial sediments.
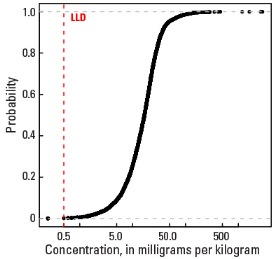
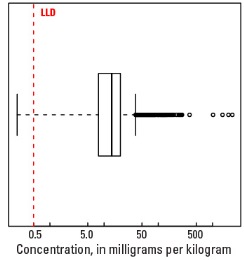
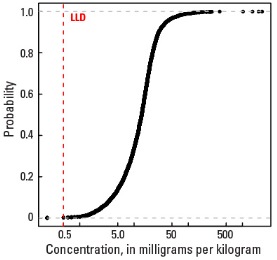
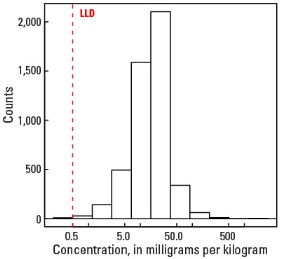
Statistics - 0 TO 5 CM
| Number of samples | 4,841 |
| LLD | 0.5 mg/kg |
| Number below LLD | 23 |
| Minimum | <0.5 mg/kg |
| 5 percentile | 2.5 mg/kg |
| 25 percentile | 7.8 mg/kg |
| 50 percentile | 13.5 mg/kg |
| 75 percentile | 19.8 mg/kg |
| 95 percentile | 38.5 mg/kg |
| Maximum | 1,890 mg/kg |
| MAD | 8.9 mg/kg |
| Robust CV | 65.9 % |
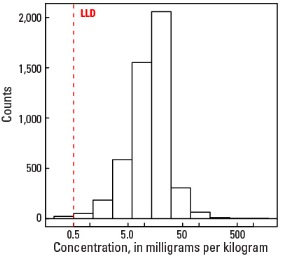
Histogram
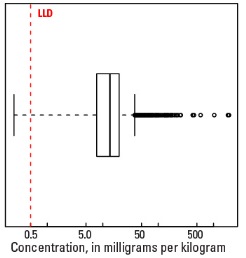
Boxplot
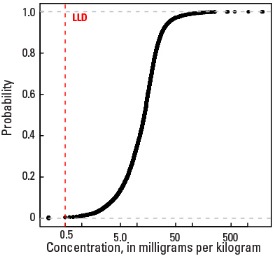
Empirical cumulative distribution function
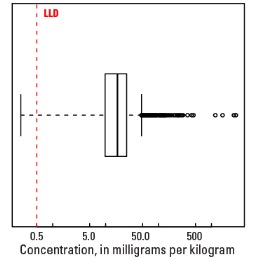
Statistics - A Horizon
| Number of samples | 4,813 |
| LLD | 0.5 mg/kg |
| Number below LLD | 9 |
| Minimum | <0.5 mg/kg |
| 5 percentile | 2.5 mg/kg |
| 25 percentile | 7.9 mg/kg |
| 50 percentile | 13.8 mg/kg |
| 75 percentile | 20 mg/kg |
| 95 percentile | 39.9 mg/kg |
| Maximum | 2,310 mg/kg |
| MAD | 8.9 mg/kg |
| Robust CV | 64.5 % |
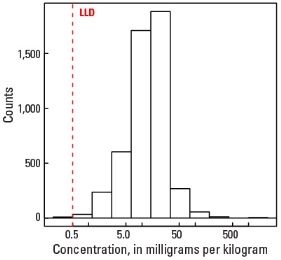
Histogram
Boxplot
Empirical cumulative distribution function
Statistics - C Horizon
| Number of samples | 4,780 |
| LLD | 0.5 mg/kg |
| Number below LLD | 8 |
| Minimum | <0.5 mg/kg |
| 5 percentile | 3.4 mg/kg |
| 25 percentile | 9.8 mg/kg |
| 50 percentile | 16.7 mg/kg |
| 75 percentile | 24.9 mg/kg |
| 95 percentile | 47.5 mg/kg |
| Maximum | 2,870 mg/kg |
| MAD | 10.9 mg/kg |
| Robust CV | 65.3 % |
Histogram
Boxplot