


The purpose of these interpretive discussions is to provide a perspective on regional- and national-scale variations in element and mineral distributions in soils and their likely causes. The significant spatial variations shown by most elements and minerals can commonly be attributed to geologic sources in underlying parent materials, but other spatial variations seem clearly related to additional factors such as climate, the age of soils, transported source material, and anthropogenic influences. We attempt to distinguish the influence of these various factors on a regional and national scale. Numerous more local features might similarly be related to these same factors, but these features also have some probability of being an artifact of a random sampling of variable compositions, so that there is some probability of samples with similar compositions occurring in clusters of two or more adjacent sites by chance. Distinguishing such random occurrences from true variability is beyond the scope of the data from which these maps are constructed. Some caution, therefore, is advisable in interpreting the significance of these more local features unless some unique sources or processes can clearly be related to them.
Zinc (Zn) is a metallic trace element used in large part as a coating to protect iron (Fe) and steel from corrosion (galvanized metal). It is also used by the chemical, rubber, and paint industries. Zinc is considered essential for humans and all living organisms. It has a relatively low toxicity and, in general, Zn deficiency is a greater problem than Zn toxicity. However, exposure to large amounts of Zn can be harmful. More information about the toxicity of Zn (or other elements and substances) and its potential negative human health impacts can be found at the Agency for Toxic Substances and Disease Registry (ATSDR) website, or click to download a fact sheet about Zn.
Zinc forms many different minerals in combination with sulfur (S), oxygen, and carbonate. Zinc occurs in many common minerals such as pyroxene, amphibole, mica, and garnet, and sulfides. In soils, Zn is often associated with Fe and manganese (Mn) oxides and hydroxides, clay minerals, and organic matter.
The average concentration of Zn in the upper continental crust is estimated to be about 75 milligrams per kilogram (mg/kg) (Hu and Gao, 2008). The average Zn concentration is about 100 mg/kg in shale and mafic rocks (such as basalt and gabbro), 20 mg/kg in sandstone, and 40 mg/kg in limestone.
The distribution of mineral resource deposits with Zn as a commodity (major or minor) in the United States, extracted from the U.S. Geological Survey (USGS) Mineral Resource Data System (MRDS) website, can be seen by hovering the mouse here. Statistics and information on the worldwide supply of, demand for, and flow of Zn–bearing materials are available through the USGS National Minerals Information Center (NMIC) website.
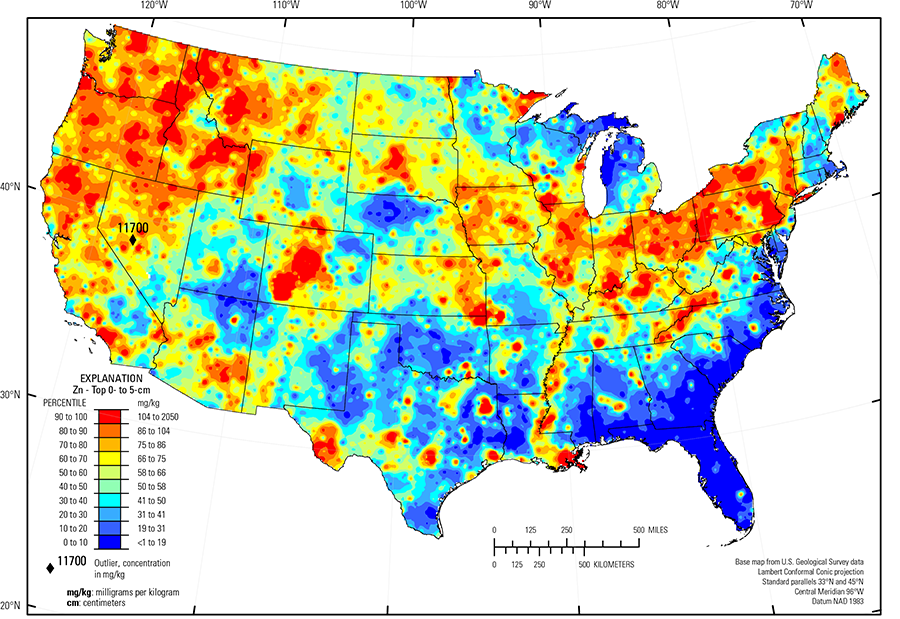
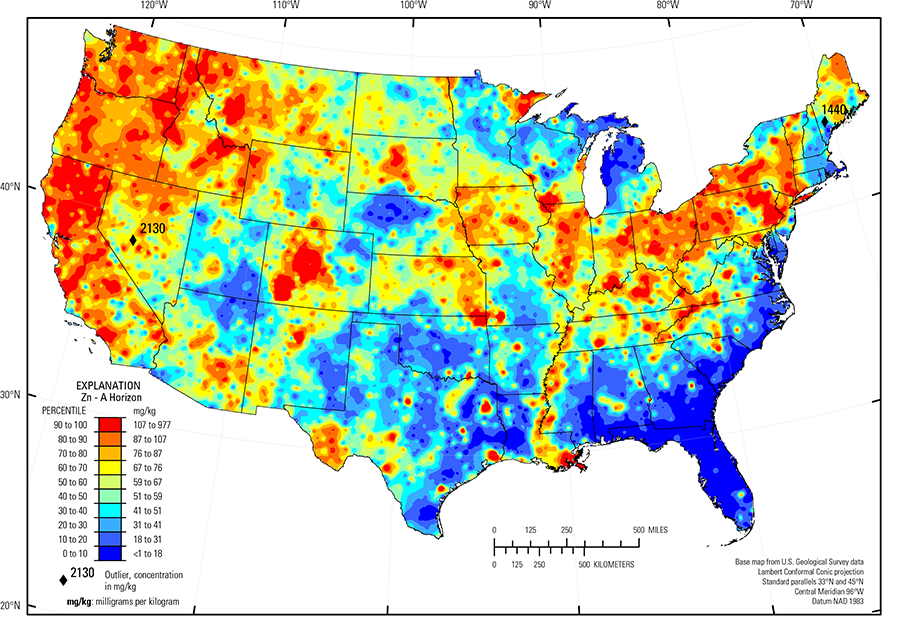
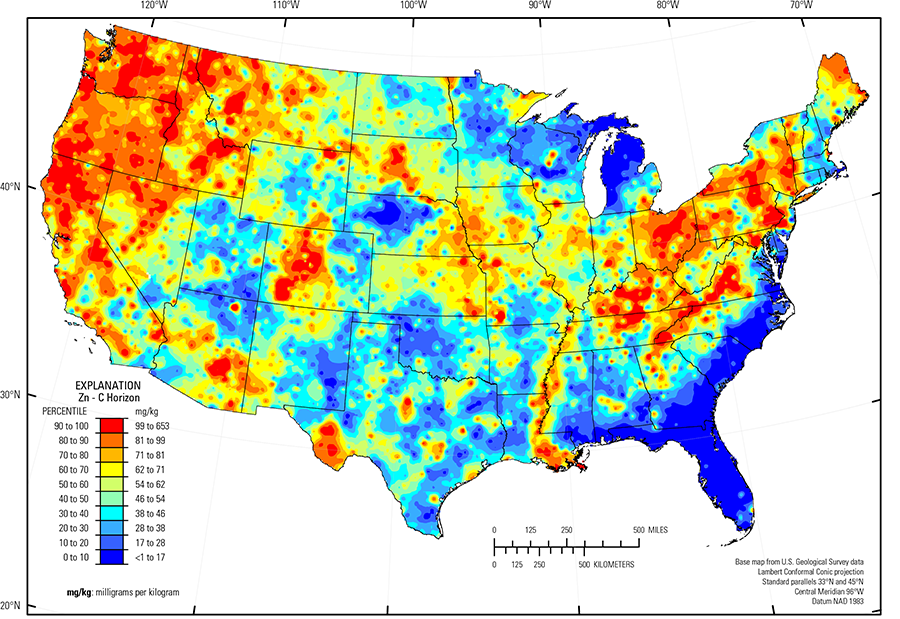
Our data show only a small difference between the three sample types collected. The median Zn concentration is 58 mg/kg in soil from the 0- to 5-cm layer, 59 mg/kg for the soil A horizon, and 54 mg/kg for the soil C horizon (see the summary statistics [open in new window]). In general, the geochemical maps for the three sample types are quite similar for Zn.
The distribution of Zn in soils of the conterminous United States is primarily controlled by the composition of the underlying soil parent materials. Areas of elevated Zn concentrations include:
- The Pacific Northwest and northern California where the parent material is mafic and intermediate volcanic rocks, such as Columbia River basalts (Swanson and Wright, 1981), and basalt and andesite of the Cascade Range;
- Mogollon Transition and Arizona and New Mexico Mountains (USDA, 2006) with parent material consisting, at least in part, of basalt and alluvium derived from basalt;
- Trans–Pecos volcanics (Schruben and others, 1997), Texas with parent materials comprised of rhyolite, alkalic volcanic rocks, and related alluvium;
- Northern and Southern Rolling Pierre Shale Plains (USDA, 2006) where the parent material is dominantly shale;
- Northeastern Minnesota where the parent material consists primarily of basalt and gabbro of the Duluth Complex;
- Central Kentucky and Tennessee with parent material consisting of phosphatic limestone and black shale;
- Ohio, and western Pennsylvania where the parent material is marine shale, clayey glacial till, or glacial deposits containing a significant amount of shale;
- Glaciated Allegheny Plateau and Catskill Mountains (USDA, 2006) with thin glacial deposits mantling bedrock of alternating shale and sandstone; and
- Southern Blue Ridge (USDA, 2006), where the soil parent material consists of igneous and metamorphic rocks, some of which are mafic in composition, for example, amphibolite and basalt.
Areas of northern Idaho, western Montana, west–central Colorado, and near the junction of Oklahoma, Missouri, and Kansas represent areas of historical or current mining activities where Zn was present as either a major or minor constituent of the ore. Soil in these areas may be formed on mineralized bedrock containing elevated concentrations of Zn. In areas of extensive mining and mineral processing, it is also possible that there may be a component of Zn contamination from these activities superimposed on the elevated background concentrations
The Gulf and Atlantic Coastal Plain (Fenneman and Johnson, 1946) is bisected by the Southern Mississippi River Alluvium and the Southern Mississippi Valley Loess (USDA, 2006). Alluvial sediments have deposited in the Mississippi River valley as the river flooded in recent geologic time. When these sediments dried, winds picked up the fine material and deposited it in thick loess sheets, mainly along the east side of the river valley. The youngest loess sheets are about 10,000 years old. A pattern of higher Zn concentrations in soil developed on these young sediments reflects long–range transport of Zn–bearing material from the upper part of the Mississippi River drainage basin.
Areas of low Zn concentrations include:
- Atlantic Coastal Plain (Fenneman and Johnson, 1946), where parent materials are dominantly quartz–rich sedimentary rocks and unconsolidated sediments;
- Nebraska Sand Hills (USDA, 2006), where parent materials are quartz– and plagioclase–rich sand dunes and sand sheets;
- Colorado Plateau (USDA, 2006), where the soils are derived from quartz–rich sandstone and eolian deposits; and
- Northern and western Michigan, where the parent material is comprised of quartz–rich glacial deposits.
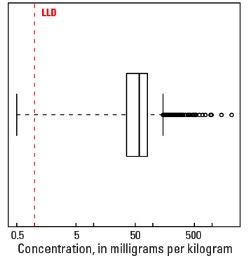
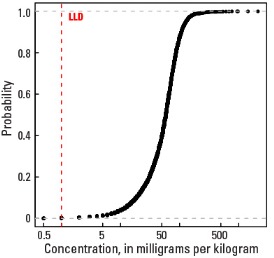
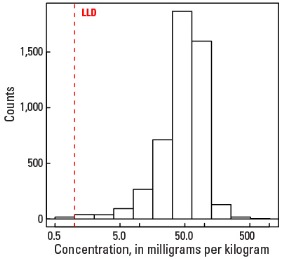
Statistics - 0 TO 5 CM
| Number of samples | 4,841 |
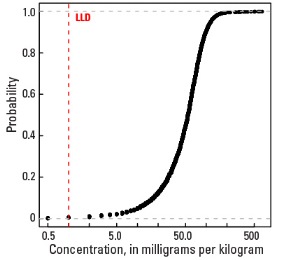
| LLD | 1 mg/kg |
| Number below LLD | 5 |
| Minimum | <1 mg/kg |
| 5 percentile | 12 mg/kg |
| 25 percentile | 36 mg/kg |
| 50 percentile | 58 mg/kg |
| 75 percentile | 80 mg/kg |
| 95 percentile | 125 mg/kg |
| Maximum | 11,700 mg/kg |
| MAD | 32.6 mg/kg |
| Robust CV | 56.2% |
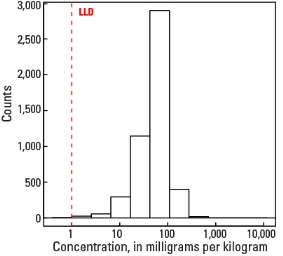
Histogram
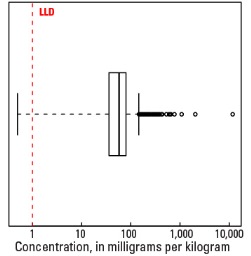
Boxplot
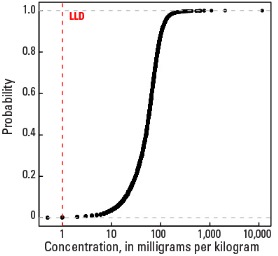
Empirical cumulative distribution function
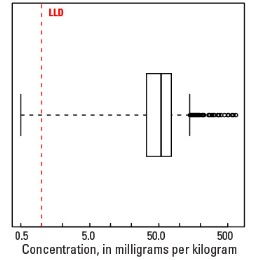
Statistics - A Horizon
| Number of samples | 4,813 |
| LLD | 1 mg/kg |
| Number below LLD | 6 |
| Minimum | <1 mg/kg |
| 5 percentile | 12 mg/kg |
| 25 percentile | 36 mg/kg |
| 50 percentile | 59 mg/kg |
| 75 percentile | 81 mg/kg |
| 95 percentile | 128 mg/kg |
| Maximum | 2,130 mg/kg |
| MAD | 34.1 mg/kg |
| Robust CV | 57.8 % |
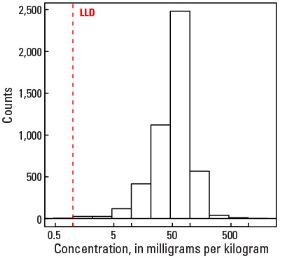
Histogram
Boxplot
Empirical cumulative distribution function
Statistics - C Horizon
| Number of samples | 4,780 |
| LLD | 1 mg/kg |
| Number below LLD | 17 |
| Minimum | <1 mg/kg |
| 5 percentile | 10 mg/kg |
| 25 percentile | 33 mg/kg |
| 50 percentile | 54 mg/kg |
| 75 percentile | 76 mg/kg |
| 95 percentile | 117 mg/kg |
| Maximum | 653 mg/kg |
| MAD | 31.1 mg/kg |
| Robust CV | 57.7 % |
Histogram
Boxplot