


The purpose of these interpretive discussions is to provide a perspective on regional- and national-scale variations in element and mineral distributions in soils and their likely causes. The significant spatial variations shown by most elements and minerals can commonly be attributed to geologic sources in underlying parent materials, but other spatial variations seem clearly related to additional factors such as climate, the age of soils, transported source material, and anthropogenic influences. We attempt to distinguish the influence of these various factors on a regional and national scale. Numerous more local features might similarly be related to these same factors, but these features also have some probability of being an artifact of a random sampling of variable compositions, so that there is some probability of samples with similar compositions occurring in clusters of two or more adjacent sites by chance. Distinguishing such random occurrences from true variability is beyond the scope of the data from which these maps are constructed. Some caution, therefore, is advisable in interpreting the significance of these more local features unless some unique sources or processes can clearly be related to them.
Cerium (Ce) is a metallic trace element. It is used in the manufacture of carbon arc lights, used in the motion picture industry, and is a major component of the alloy mischmetal, which is used in the manufacture of flints for cigarette lighters. Cerium oxide is used inside the walls of self–cleaning ovens to prevent the buildup of cooking residues. Cerium has no known biological role and is considered to be relatively nontoxic.
Cerium is 1 of 15 rare earth elements (REEs), many of which are not particularly rare. Most REEs have similar geochemical properties, and the distribution of Ce in soils is very similar to the distribution of lanthanum (La), another REE, and yttrium (Y), which shares many properties with REEs. The abundance of Ce in the Earth's upper continental crust is estimated to be 63 milligrams per kilogram (mg/kg) (Rudnick and Gao, 2003). Rare earth elements, including Ce, have low concentrations in many common minerals, such as feldspars and pyroxenes, moderate concentrations in clay minerals, and very high concentrations in accessory minerals, including phosphate minerals (such as monazite and apatite), allanite (REE–enriched epidote), zircon, and sphene (or titanite —a calcium (Ca)–titanium (Ti) silicate mineral). These accessory minerals typically occur in many rock types, with somewhat higher concentrations in felsic igneous rocks (such as granite, rhyolite, and pegmatite), alkali igneous rocks, and phosphate–rich sedimentary rocks, as well as metamorphic equivalents of all of these rock types. The average Ce concentration is about 3 mg/kg in ultramafic rocks, 12 mg/kg in limestone, 30 mg/kg in sandstone, 80 mg/kg in clays or accessory minerals, and 90 mg/kg in granite. Some Ce–bearing accessory minerals are resistant to weathering, and can be present in unconsolidated materials, such as alluvial, eolian, and glacial deposits. Some REE–bearing minerals, including monazite, xenotime, allanite, and zircon are common detrital heavy minerals that, when released from their parent rock by weathering, can accumulate by density sorting in fluvial, lacustrine, or oceanic coastal shoreline settings.
The distribution of mineral resource deposits with REE (including Ce) as a commodity (major or minor) in the United States, extracted from the U.S. Geological Survey (USGS) Mineral Resource Data System (MRDS) website, can be seen by hovering the mouse here. Statistics and information on the worldwide supply of, demand for, and flow of REE are available through the USGS National Minerals Information Center (NMIC) website.
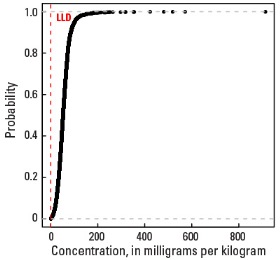
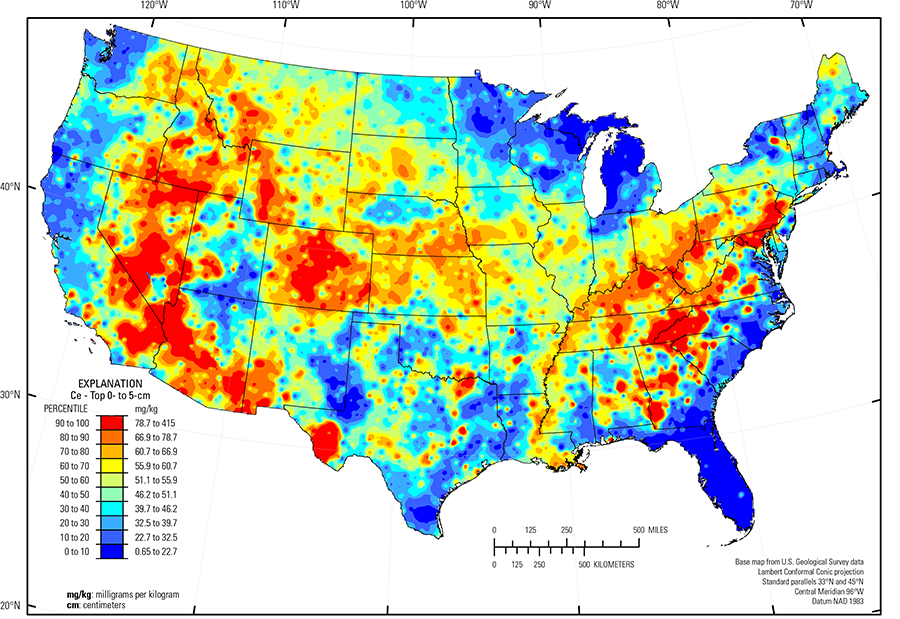
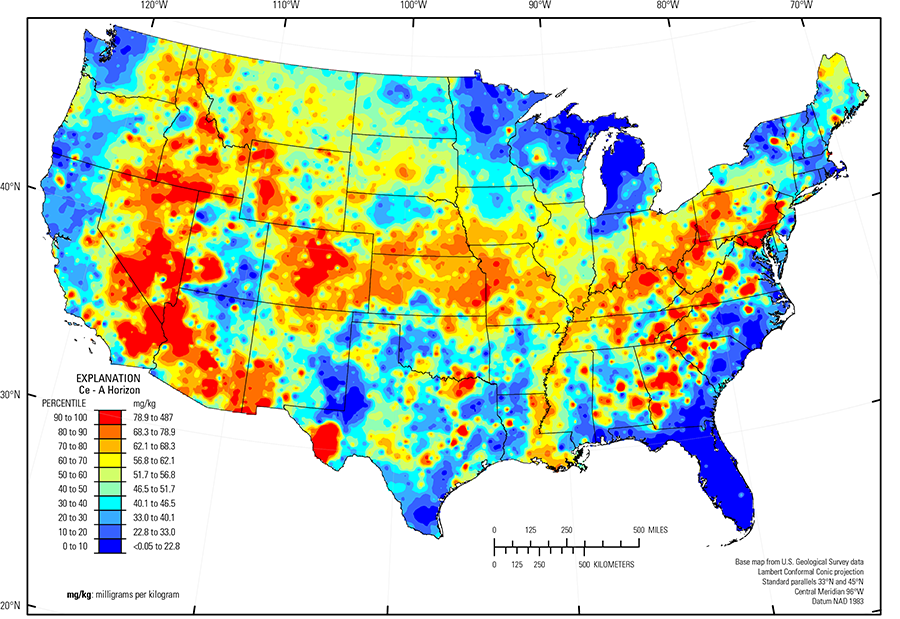
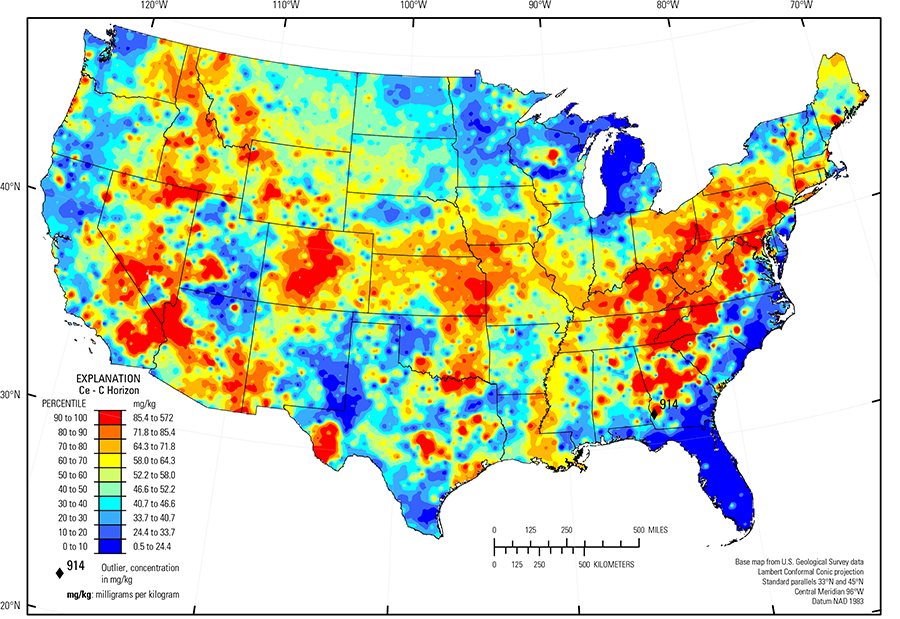
In our data, the median Ce concentration is 52.2 mg/kg in the soil C horizon, 51.7 mg/kg in the soil A horizon, and 51.1 mg/kg in the top 0- to 5-cm layer (see the summary statistics [open in new window]). All but two samples have Ce concentrations above the 0.05-mg/kg lower limit of determination (LLD). An anomalously high Ce concentration of 914 mg/kg in the soil C horizon was removed prior to constructing the interpolated map and is shown as a diamond symbol on the map. As suggested by the similar median concentrations, Ce map patterns are generally consistent among the three sample types.
High Ce concentrations occur in soils developed on felsic rocks (granite and rhyolite), intermediate igneous rocks (alkali basalt or syenite), or sedimentary rocks and more recent alluvial and eolian deposits sourced from similar rock types. Examples of such areas include:
- Parts of the Central Rocky Mountains and the Southern Rocky Mountains (USDA, 2006), Colorado, Wyoming, Montana, and Idaho (variety of rock types, including granite);
- Parts of the Owyhee High Plateau (USDA, 2006, Nevada, Idaho, and Oregon (granite and felsic volcanics);
- Southern Nevada Basin and Range (USDA, 2006) (felsic volcanic rocks and related alluvium);
- Mojave Desert and Lower Colorado Desert (USDA, 2006), California and Nevada (granitic rocks and syenite);
- Trans–Pecos volcanics (Schruben and others, 1997),Texas (rhyolite, alkalic volcanic rocks and related alluvium); and
- Llano Basin, Texas (Precambrian granitic rocks).
Elevated soil Ce concentrations in the Kentucky Bluegrass area (USDA, 2006) area occur where soils developed on weathered phosphatic, apatite–bearing limestone, similar in geologic age (Ordovician) to phosphatic limestone in the Nashville Basin (USDA, 2006) in Tennessee. Scattered elevated soil Ce concentrations through the Southern Blue Ridge and Southern Piedmont (USDA, 2006) are attributed to occurrences of REE–bearing minerals in metamorphic and granitic rocks. Soils below the 'fall line', the physiographic boundary between older crystalline rocks of the Piedmont (Fenneman and Johnson, 1946) and fluvial and marine sediments of the Gulf and Atlantic Coastal Plain (Fenneman and Johnson, 1946), have high Ce (as well as La, and Y). These soils developed on sands that likely contain detrital REE–bearing monazite or zircon.
In general, soils developed on recent glacial deposits have moderate to low Ce concentrations. In many areas of the Upper Midwest, the southern glacial limit (Soller and others, 2012) marks a change in soil Ce concentrations. Higher soil Ce concentrations in the vast loess sheets south of the southern glacial limit (Soller and others, 2012) compared to Ce concentrations in soils developed in carbonate till north of the ice extent are likely related to the presence of wind–deposited silt–sized feldspar or a small, but persistent, quantity of REE–rich accessory minerals, such as zircon.
Other large areas of the conterminous United States with relatively low Ce concentrations in soils typically lack many of the minerals that contain REE. These areas include:
- Pacific Northwest and northern California (mafic rocks);
- Colorado Plateau (USDA, 2006) (quartz–rich sandstone and eolian deposits);
- Nebraska Sand Hills (USDA, 2006) (quartz– and plagioclase–rich, unconsolidated sand dunes and sand sheets);
- Southern High Plains (USDA, 2006) in eastern New Mexico and western Texas (quartz–rich eolian sands and alluvial sediments); and
- Gulf and Atlantic Coastal Plain (Fenneman and Johnson, 1946) (quartz–rich sedimentary rocks and unconsolidated sediments).
The Gulf and Atlantic Coastal Plain (Fenneman and Johnson, 1946) is bisected by the Southern Mississippi River Alluvium and the Southern Mississippi Valley Loess (USDA, 2006). Alluvial sediments were deposited in the Mississippi River valley as the river flooded in recent geologic time. When these sediments dried, winds picked up the fine material and deposited it in thick loess sheets, mainly along the east side of the river valley. The youngest loess sheets are about 10,000 years old. A pattern of higher Ce concentrations in soils developed on these young sediments reflects long–range transport of Ce–bearing material from the upper part of the Mississippi River drainage basin.
Statistics - 0 TO 5 CM
| Number of samples | 4,841 |
| LLD | 0.05 mg/kg |
| Number below LLD | 0 |
| Minimum | 0.65 mg/kg |
| 5 percentile | 16.0 mg/kg |
| 25 percentile | 36.2 mg/kg |
| 50 percentile | 51.1 mg/kg |
| 75 percentile | 63.6 mg/kg |
| 95 percentile | 92.1 mg/kg |
| Maximum | 415 mg/kg |
| MAD | 20.2 mg/kg |
| Robust CV | 39.5% |
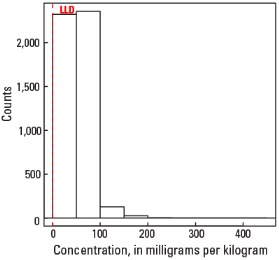
Histogram
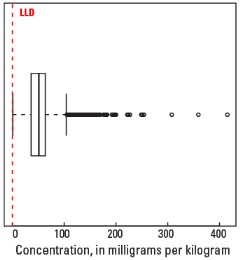
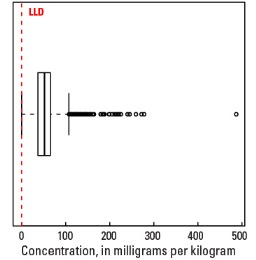
Boxplot
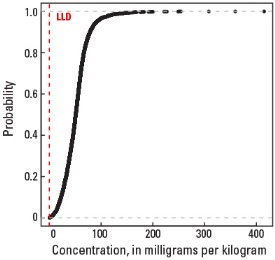
Empirical cumulative distribution function
Statistics - A Horizon
| Number of samples | 4,813 |
| LLD | 0.05 mg/kg |
| Number below LLD | 2 |
| Minimum | <0.05 mg/kg |
| 5 percentile | 16.1 mg/kg |
| 25 percentile | 36.9 mg/kg |
| 50 percentile | 51.7 mg/kg |
| 75 percentile | 65.1 mg/kg |
| 95 percentile | 90.4 mg/kg |
| Maximum | 487 mg/kg |
| MAD | 20.9 mg/kg |
| Robust CV | 40.4 % |
Histogram
Boxplot
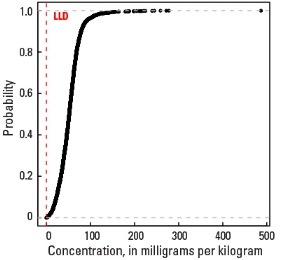
Empirical cumulative distribution function
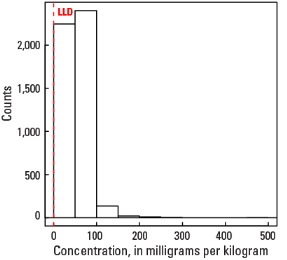
Statistics - C Horizon
| Number of samples | 4,780 |
| LLD | 0.05 mg/kg |
| Number below LLD | 0 |
| Minimum | 0.5 mg/kg |
| 5 percentile | 17.3 mg/kg |
| 25 percentile | 37.4 mg/kg |
| 50 percentile | 52.2 mg/kg |
| 75 percentile | 68.1 mg/kg |
| 95 percentile | 101 mg/kg |
| Maximum | 914 mg/kg |
| MAD | 22.8 mg/kg |
| Robust CV | 43.6 % |
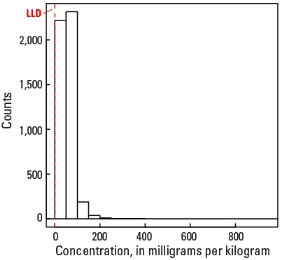
Histogram
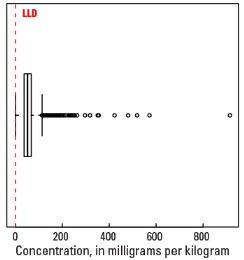
Boxplot