


The purpose of these interpretive discussions is to provide a perspective on regional- and national-scale variations in element and mineral distributions in soils and their likely causes. The significant spatial variations shown by most elements and minerals can commonly be attributed to geologic sources in underlying parent materials, but other spatial variations seem clearly related to additional factors such as climate, the age of soils, transported source material, and anthropogenic influences. We attempt to distinguish the influence of these various factors on a regional and national scale. Numerous more local features might similarly be related to these same factors, but these features also have some probability of being an artifact of a random sampling of variable compositions, so that there is some probability of samples with similar compositions occurring in clusters of two or more adjacent sites by chance. Distinguishing such random occurrences from true variability is beyond the scope of the data from which these maps are constructed. Some caution, therefore, is advisable in interpreting the significance of these more local features unless some unique sources or processes can clearly be related to them.
Titanium (Ti) is a metallic element that is as strong as steel but is much less dense. It is alloyed with other metals such as aluminum (Al), molybdenum (Mo), and iron (Fe) and these alloys are used in aircraft and spacecraft because of their low density and their ability to withstand extreme temperatures. Because Ti does not react with the human body, it is used in the manufacture of artificial hips and pins for setting bones. The largest use of Ti is in the form of titanium dioxide (TiO2). This compound is used extensively as a bright, white pigment in paint. Titanium has no known biological role and is considered to be nontoxic.
Titanium in soil is largely inherited from parent materials. The abundance of Ti in the Earth's upper continental crust is estimated to be approximately 0.38 weight percent (wt. %) (Rudnick and Gao, 2003). Titanium typically occurs within oxide minerals and often with Fe, such as in ilmenite (FeTiO3), titanite (or sphene —CaTiSiO5), and titaniferous magnetite (Ti and Fe oxide mixtures). Titanium also occurs in trace amounts in silicate minerals, including pyroxene, amphibole, mica, and garnet. Mafic rocks, such as basalt or gabbro, contain on average about 1 wt. % Ti, whereas felsic rocks, such as granite and rhyolite, contain about 0.3 wt. % Ti. Rutile (TiO2) is a common Ti mineral in many igneous and metamorphic rocks. Titanium oxide minerals are very resistant to weathering and can accumulate in soil.
With time, intense weathering can break down ilmenite and other Fe–Ti–oxides, releasing Fe and forming refractory Ti–rich secondary minerals such as anatase (another mineral with a formula of TiO2), and leucoxene (a mixture of Ti oxide minerals, such as rutile and anatase), thus potentially increasing Ti concentrations in soil. Sedimentary rocks, including sandstone and shale, and unconsolidated materials such as alluvial, eolian, or glacial deposits, all may contribute Ti to soil. Of the common sedimentary rock types, shale contains about 0.60 wt. % Ti, sandstone about 0.15 wt. %, and limestone about 0.04 wt. %. Ilmenite and rutile are common detrital minerals that, when released from their parent rock by weathering, can accumulate by density sorting in fluvial, lacustrine, or oceanic coastal shoreline settings.
The distribution of mineral resource deposits with Ti as a commodity (major or minor) in the United States, extracted from the U.S. Geological Survey (USGS) Mineral Resource Data System (MRDS) website, can be seen by hovering the mouse here. Statistics and information on the worldwide supply of, demand for, and flow of Ti are available through the USGS National Minerals Information Center (NMIC) website.
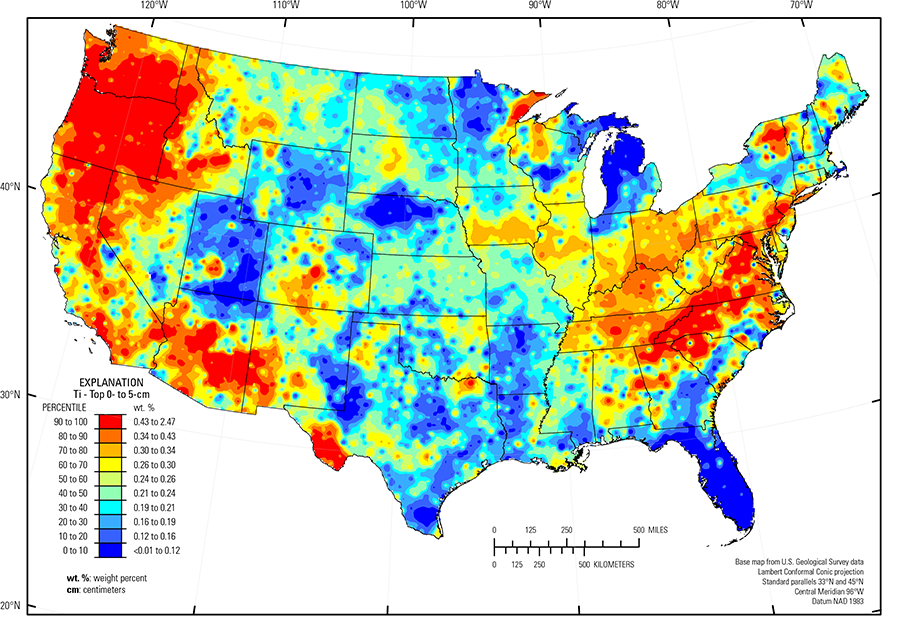
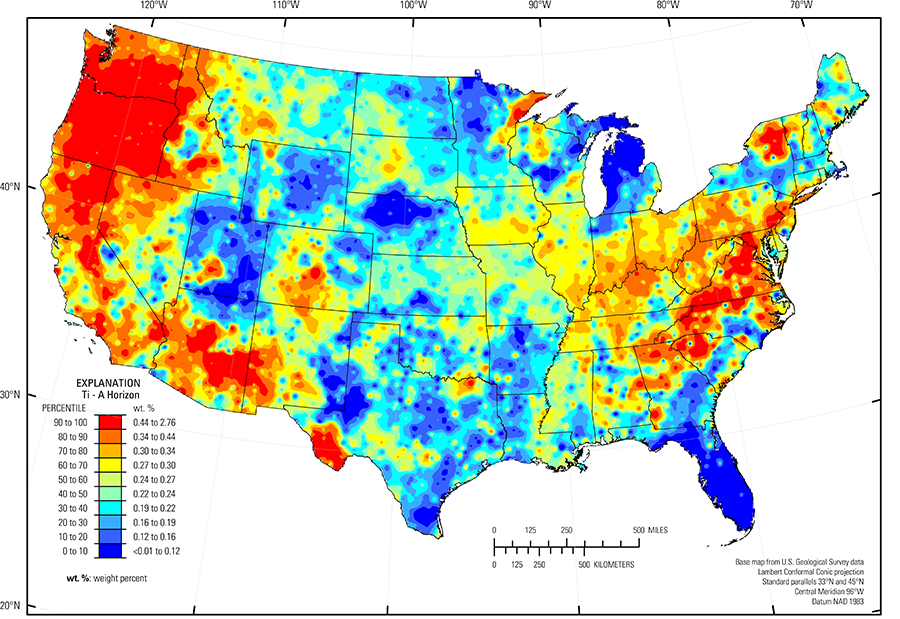
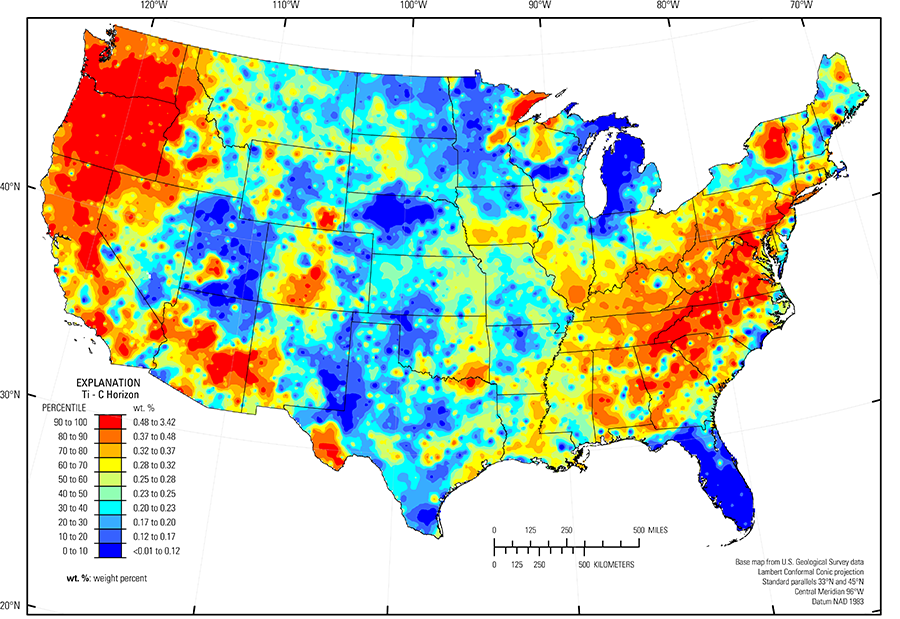
In our data, Ti has a median concentration of 0.25 wt. % in the soil C horizon, and 0.24 wt. % in both the soil A horizon and the top 0- to 5-cm layer (see the summary statistics [open in new window]). Only four samples have Ti concentrations less than the lower limit of determination (LLD) of 0.01 wt. %. The broad spatial map patterns for Ti among the three soil layers are generally similar to one another.
Examples of geographic areas with abundant igneous rocks that contribute Ti to soil (and their dominant soil parent materials) include:
- Pacific Northwest and northern California (mafic and intermediate volcanic rocks, such as Columbia River basalts (Swanson and Wright, 1981), basalt and andesite of the Cascade Range, and a young volcanic belt along the Olympic Peninsula);
- Parts of the Southern Rocky Mountains (USDA, 2006), Colorado (a variety of rock types, including basalt and andesite);
- Southern Sierra Nevada Mountains and Carson Basin and Mountains (USDA, 2006), California and Nevada (basalt and andesite);
- Southern part of the Wasatch and Uinta Mountains (USDA, 2006), Utah (basalt and other volcanic rocks);
- Trans–Pecos volcanics (Schruben and others, 1997), Texas (rhyolite, alkalic volcanic rocks, and related alluvium);
- Mogollon Transition (USDA, 2006) and the Arizona and New Mexico Mountains (USDA, 2006) (basalt and andesite); and
- Adirondack highlands (Fenneman and Johnson, 1946), New York (anorthosite and gabbro —several Ti mines once operated in the Adirondacks).
Somewhat elevated Ti concentrations occur in soil developed on cyclic beds of sandstone and shale or associated colluvium in western Pennsylvania, West Virginia, Kentucky, Tennessee, and northern Georgia. Crystalline igneous and metamorphic rocks are the parent materials for soil in the Piedmont (Fenneman and Johnson, 1946). Soil in the Piedmont is old and highly weathered, and high Ti concentrations are likely related to the presence of resistant accessory minerals such as rutile. High soil Ti concentrations in the Carolina and Georgia Sand Hills (USDA, 2006), are likely related to concentrations of detrital minerals derived from the Piedmont (Fenneman and Johnson, 1946). Occasional high soil Ti concentrations in the Atlantic Coastal Plain (Fenneman and Johnson, 1946) (for example, in Georgia and Florida) may have a similar source. Heavy–mineral detrital deposits containing ilmenite (and weathering products) and rutile occur in sands along the Atlantic Coast from New Jersey to northern Florida, and in marine sand deposits inland.
In the Upper Midwest, melting of glacial ice following late Wisconsinan period advances (16,000 to 12,000 years ago) left the region north of the southern glacial limit (Soller and others, 2012) mantled with a blanket of mixed, immature sediments, from which present–day soil developed. Individual ice lobes (Grimley, 2000) created distinct patterns in soil mineralogy and geochemistry because of varying provenance and ice transport paths. Carbonate– and shale–rich 'gray' till in western Minnesota, North Dakota, South Dakota, and Iowa, were derived from Cretaceous sedimentary rocks (dolostone, limestone, and shale). These gray tills have relatively low Ti concentrations, despite a shale contribution. In contrast, glacial deposits with a local Precambrian gabbro provenance derived from gabbro of the Duluth Complex in northeastern Minnesota have high Ti concentrations. In western and central Ohio, soils with high Ti developed on glacial deposits that incorporated black shale from a thin unit that runs roughly north–south through the State. Soils in southern Iowa, and western Illinois that developed on loess have somewhat higher Ti concentrations than soils north of the southern glacial limit (Soller and others, 2012) that developed on till. The higher concentrations of Ti in the silt–sized sediment that makes up the vast loess sheets may be related to the presence of a small, but persistent, quantity of Ti–rich minerals, such as rutile or leucoxene.
Other areas where Ti is present in much lower concentrations in the soil parent materials include:
- Colorado Plateau (USDA, 2006) (quartz–rich sandstone and eolian deposits);
- Great Salt Lake Area (USDA, 2006) (calcareous alluvial sediments and playa lakebed deposits);
- Central High Plains, Southern Part (USDA, 2006) in eastern Colorado and the Southern High Plains (USDA, 2006) of eastern New Mexico, northwestern Texas, and western Oklahoma (quartz–rich eolian sands and alluvial sediments);
- Nebraska Sand Hills (USDA, 2006) (unconsolidated sand dunes and sand sheets, with soils dominated by quartz and plagioclase feldspar); and
- Florida (marine carbonate bedrock and sands).
Statistics - 0 TO 5 CM
| Number of samples | 4,841 |
| LLD | 0.01 wt. % |
| Number below LLD | 2 |
| Minimum | <0.01 wt. % |
| 5 percentile | 0.09 wt. % |
| 25 percentile | 0.18 wt. % |
| 50 percentile | 0.24 wt. % |
| 75 percentile | 0.32 wt. % |
| 95 percentile | 0.56 wt. % |
| Maximum | 2.47 wt. % |
| MAD | 0.104 wt. % |
| Robust CV | 43.2% |
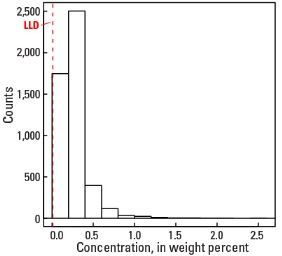
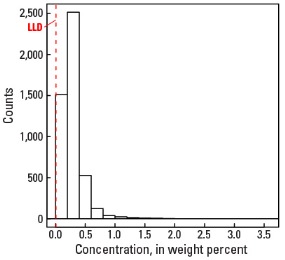
Histogram
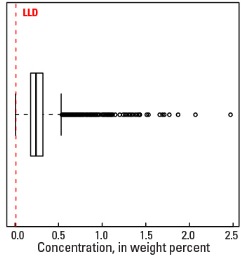
Boxplot
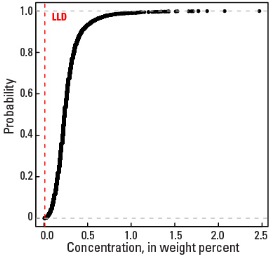
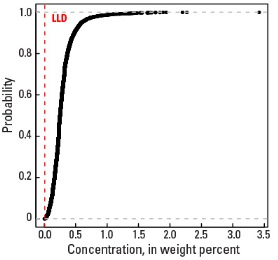
Empirical cumulative distribution function
Statistics - A Horizon
| Number of samples | 4,813 |
| LLD | 0.01 wt. % |
| Number below LLD | 0 |
| Minimum | 0.01 wt. % |
| 5 percentile | 0.09 wt. % |
| 25 percentile | 0.18 wt. % |
| 50 percentile | 0.24 wt. % |
| 75 percentile | 0.31 wt. % |
| 95 percentile | 0.56 wt. % |
| Maximum | 2.76 wt. % |
| MAD | 0.104 wt. % |
| Robust CV | 43.2 % |
Histogram
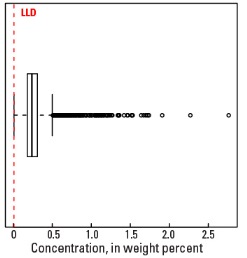
Boxplot
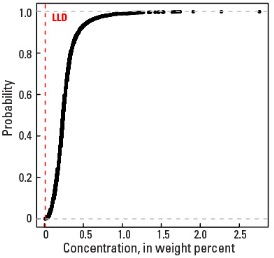
Empirical cumulative distribution function
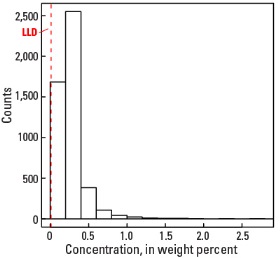
Statistics - C Horizon
| Number of samples | 4,780 |
| LLD | 0.01 wt. % |
| Number below LLD | 2 |
| Minimum | <0.01 wt. % |
| 5 percentile | 0.08 wt. % |
| 25 percentile | 0.18 wt. % |
| 50 percentile | 0.25 wt. % |
| 75 percentile | 0.34 wt. % |
| 95 percentile | 0.59 wt. % |
| Maximum | 3.42 wt. % |
| MAD | 0.119 wt. % |
| Robust CV | 47.4 % |
Histogram
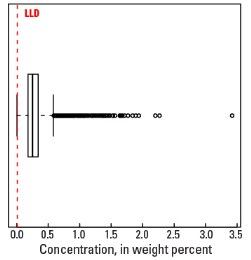
Boxplot