


The purpose of these interpretive discussions is to provide a perspective on regional- and national-scale variations in element and mineral distributions in soils and their likely causes. The significant spatial variations shown by most elements and minerals can commonly be attributed to geologic sources in underlying parent materials, but other spatial variations seem clearly related to additional factors such as climate, the age of soils, transported source material, and anthropogenic influences. We attempt to distinguish the influence of these various factors on a regional and national scale. Numerous more local features might similarly be related to these same factors, but these features also have some probability of being an artifact of a random sampling of variable compositions, so that there is some probability of samples with similar compositions occurring in clusters of two or more adjacent sites by chance. Distinguishing such random occurrences from true variability is beyond the scope of the data from which these maps are constructed. Some caution, therefore, is advisable in interpreting the significance of these more local features unless some unique sources or processes can clearly be related to them.
The total carbon (Ctot) concentration of soils is simply the sum of organic carbon (Corg) and inorganic carbon (Cinorg). Organic carbon is that portion of the total carbon in soils that is chemically incorporated into soil organic matter. Inorganic carbon, as quantified in this study is that portion of the total carbon in soils that occurs as a major component of the carbonate minerals calcite, dolomite, and aragonite. In this survey, Corg was not analyzed directly, but rather was calculated as the difference between Ctot and Cinorg. The two portions that make up Ctot can have very different qualities and very different modes of occurrence. Thus, the Ctot maps portray somewhat disparate information that reflects the combined factors that control the distribution of these two contrasting carbon forms.
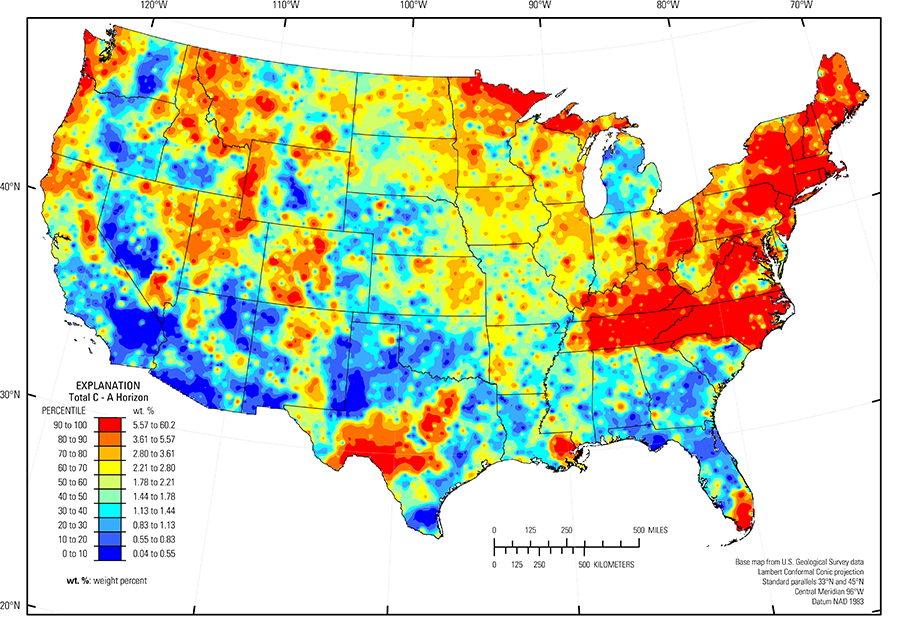
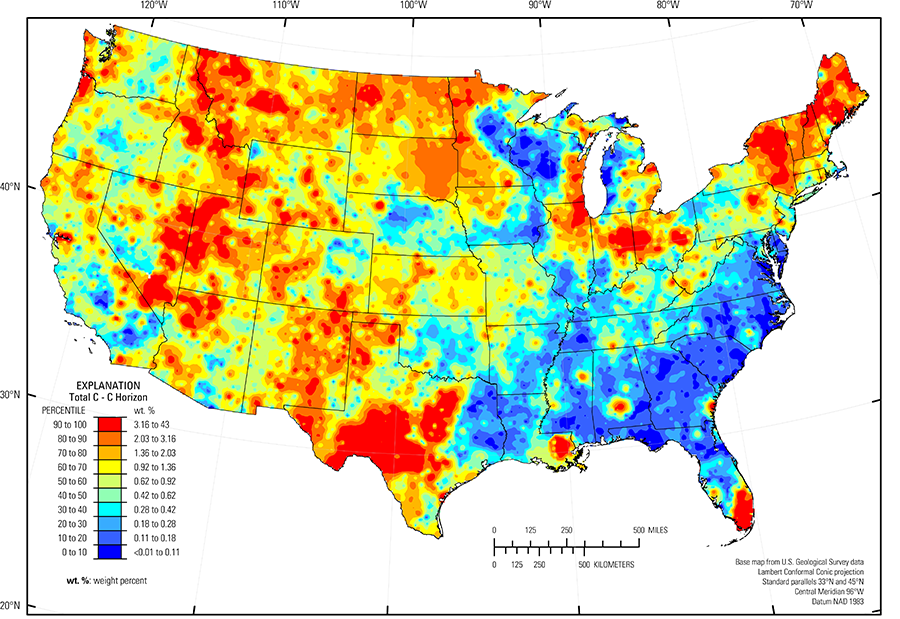
Total carbon in this study was only determined for samples from the soil A and C horizons. The soil A horizon has a median concentration of 1.78 weight percent (wt. %) Ctot and the soil C horizon has a median concentration of 0.62 wt. % Ctot (see the summary statistics [open in new window]). The higher median concentration in the soil A horizon is caused primarily by the accumulation of organic matter in this near–surface sample material as compared to the deeper soil C horizon, which accumulates relatively little organic matter. The geochemical maps for Ctot illustrate the combined distribution of Corg and Cinorg. For example, the Ctot map for the soil A horizon reflects high Corg in forested areas in eastern New York, New Hampshire, Vermont, and Maine. High Ctot concentrations also occur in soils developed on carbonate–rich rocks in the Texas carbonate terrane and in the Everglades (USDA, 2006) of southern Florida. Thus, the factors controlling the distribution of Ctot are quite dissimilar. Those factors are discussed in more detail in the interpretations of Corg and Cinorg, and the reader is referred to those web pages for an explanation of the geochemical patterns related to soil carbon.
Statistics - 0 TO 5 CM
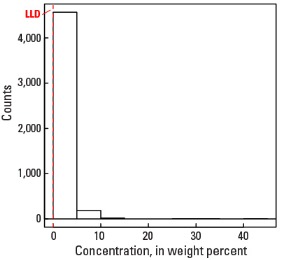
Statistics - A Horizon
| Number of samples | 4,810 |
| LLD | 0.01 wt. % |
| Number below LLD | 0 |
| Minimum | 0.04 wt. % |
| 5 percentile | 0.38 wt. % |
| 25 percentile | 0.96 wt. % |
| 50 percentile | 1.78 wt. % |
| 75 percentile | 3.15 wt. % |
| 95 percentile | 9.34 wt. % |
| Maximum | 60.2 wt. % |
| MAD | 1.43 wt. % |
| Robust CV | 80.6 % |
Histogram
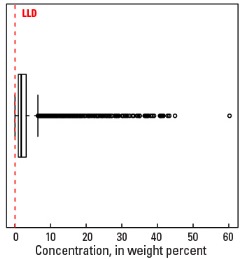
Boxplot
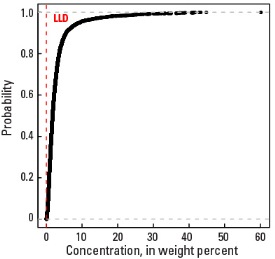
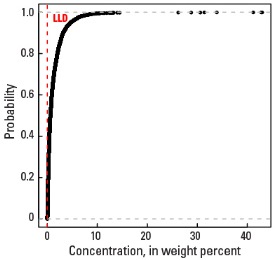
Empirical cumulative distribution function
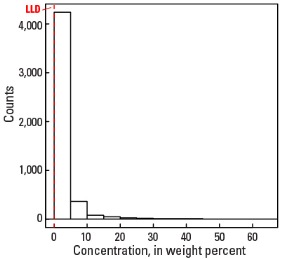
Statistics - C Horizon
| Number of samples | 4,777 |
| LLD | 0.01 wt. % |
| Number below LLD | 4 |
| Minimum | <0.01 wt. % |
| 5 percentile | 0.08 wt. % |
| 25 percentile | 0.22 wt. % |
| 50 percentile | 0.62 wt. % |
| 75 percentile | 1.65 wt. % |
| 95 percentile | 4.63 wt. % |
| Maximum | 43.0 wt. % |
| MAD | 0.712 wt. % |
| Robust CV | 115 % |
Histogram
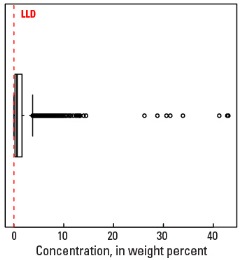
Boxplot