


The purpose of these interpretive discussions is to provide a perspective on regional- and national-scale variations in element and mineral distributions in soils and their likely causes. The significant spatial variations shown by most elements and minerals can commonly be attributed to geologic sources in underlying parent materials, but other spatial variations seem clearly related to additional factors such as climate, the age of soils, transported source material, and anthropogenic influences. We attempt to distinguish the influence of these various factors on a regional and national scale. Numerous more local features might similarly be related to these same factors, but these features also have some probability of being an artifact of a random sampling of variable compositions, so that there is some probability of samples with similar compositions occurring in clusters of two or more adjacent sites by chance. Distinguishing such random occurrences from true variability is beyond the scope of the data from which these maps are constructed. Some caution, therefore, is advisable in interpreting the significance of these more local features unless some unique sources or processes can clearly be related to them.
Inorganic carbon (Cinorg) refers to the sum of the carbon (C) contained in the carbonate minerals calcite (CaCO3), dolomite (CaMg(CO3)2), and aragonite (CaCO3). The concentration of Cinorg was calculated from the mineralogical data for these three minerals, and the distribution of Cinorg in soils mimics the distribution pattern of those minerals. Complete details of the observed patterns are discussed in the pages for calcite, dolomite, and aragonite; only an abbreviated summary of the patterns is given here.
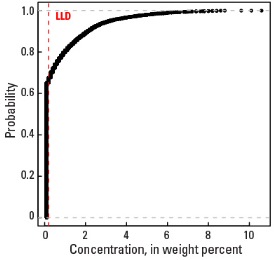
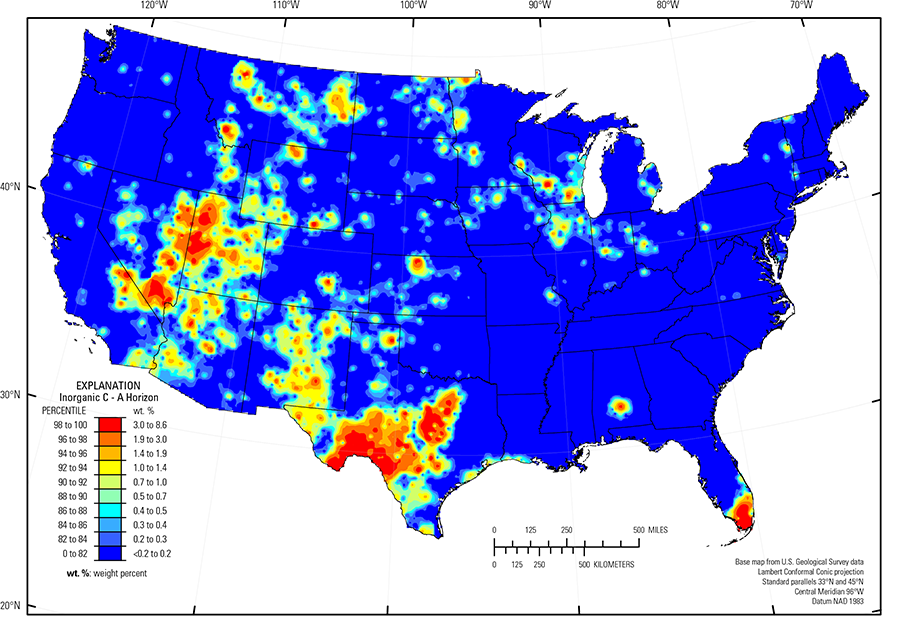
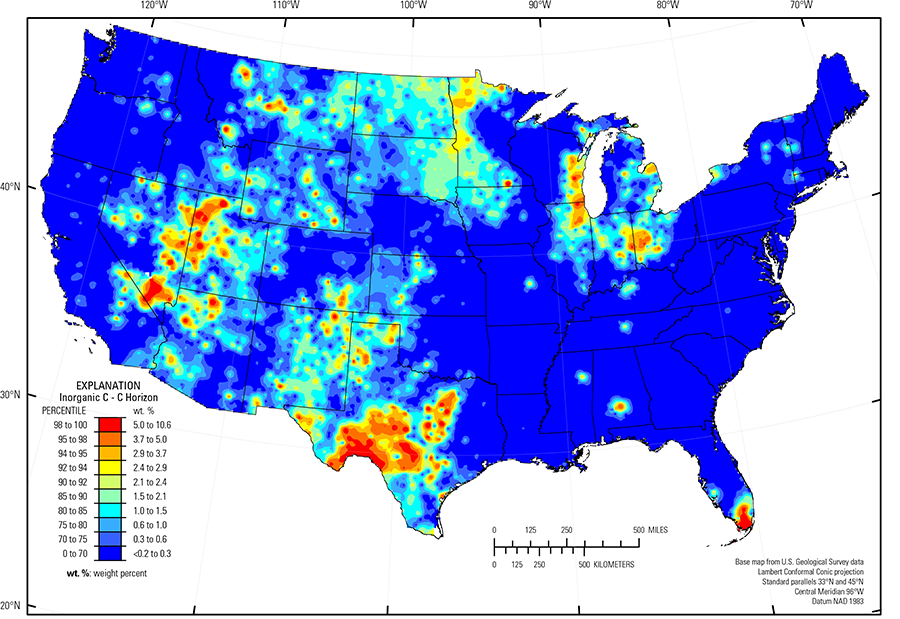
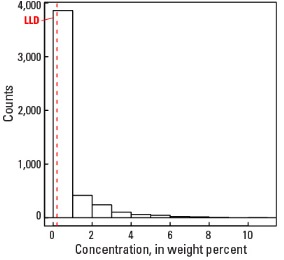
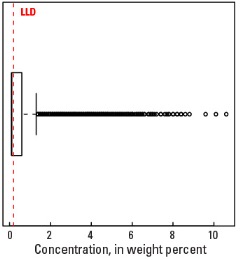
Carbonate minerals, and thus Cinorg, are not detectable in soils of most of the United States. For the soil A horizon, 75.5 percent of the Cinorg concentrations are below the detection limit of 0.2 weight percent (wt. %), but Cinorg concentrations range up to 8.6 wt. %. For the soil C horizon, 60.1 percent of the concentrations are below the detection limit, but Cinorg concentrations can be as much as 10.6 wt. % (see the summary statistics [open in new window]).
Inorganic carbon concentrations are especially high in:
- Texas carbonate terrane where soils developed on limestone, chalk, and dolostone, or on unconsolidated deposits derived from carbonate bedrock;
- Everglades (USDA, 2006) of southern Florida where soils developed on freshwater biogenic marl formed on limestone bedrock;
- Great Salt Lake Area (USDA, 2006), which includes the Bonneville Salt Flats, where soils formed on saline–lake sediments containing aragonite and calcium (Ca) as well as evaporite minerals such as gypsum and halite; and
- In southeastern California, central Nevada, and Arizona where carbonate bedrock is common.
Inorganic carbon is present in soils in the Great Lakes region, where glacial materials derived from sedimentary carbonate rocks were distributed in the down–ice direction by glaciers. In the Upper Midwest, melting of glacial ice following late Wisconsinan period advances (16,000 to 12,000 years ago) left the region north of the southern glacial limit (Soller and others, 2012) mantled with a blanket of mixed, immature sediments, from which present–day soils developed. Individual ice lobes (Grimley, 2000) created distinct patterns in soil mineralogy and geochemistry because of varying provenance and ice transport paths. 'Gray' (carbonate– and shale–rich) till in the James and Des Moines lobes (Grimley, 2000) was derived from Cretaceous sedimentary rocks (carbonates and shale); glacial lake clays in the Red River Valley of the North (USDA, 2006) along the North Dakota–Minnesota border also contain carbonate minerals in some areas. Gray tills were transported significant distances to the south and southeast from their source and deposited in areas underlain by Precambrian bedrock. 'Red' quartz– and feldspar–rich till deposited in northeastern Minnesota, northern Wisconsin, and northwestern Michigan have a Precambrian crystalline rock provenance (Rainy lobe (Grimley, 2000)) and Precambrian red sandstone (with variable quantities of quartz and feldspar provenance (Superior lobe (Grimley, 2000)), with no material derived from carbonate bedrock. Soils in eastern Wisconsin, northern Illinois, and northern Indiana developed on carbonate– and shale–bearing till sourced from sedimentary bedrock. Soils in this area have generally higher Cinorg concentrations than soils in the 'gray' till areas of western Minnesota, North Dakota, and South Dakota. Distinct boundaries in the soil C horizon map along the southern glacial limit (Soller and others, 2012) and between 'gray' and 'red' till clearly separate soils that are enriched in carbonate minerals and thus Cinorg from soils with no detectable carbonate or Cinorg.
The carbonate minerals are relatively soluble in many soil environments, especially in warm humid regions. Numerous areas of carbonate bedrock in the eastern United States are present where overlying soils contain no detectable Cinorg or carbonate minerals because of nearly complete dissolution of them. This same effect appears to cause a more restricted distribution of Cinorg in the soil A horizon than in the C horizon, because of more complete dissolution of carbonate minerals in the soil A horizon. On the other hand, carbonate minerals can form during soil development, especially in arid environments. Our data do not uniquely identify such carbonates that could control the distribution of some Cinorg in parts of the western United States.
Statistics - 0 TO 5 CM
Statistics - A Horizon
| Number of samples | 4,802 |
| LLD | 0.2 wt. % |
| Number below LLD | 3,624 |
| Minimum | <0.2 wt. % |
| 5 percentile | <0.2 wt. % |
| 25 percentile | <0.2wt. % |
| 50 percentile | <0.2 wt. % |
| 75 percentile | <0.2 wt. % |
| 95 percentile | 1.7 wt. % |
| Maximum | 8.6 wt. % |
| MAD | ND |
| Robust CV | ND |

Histogram
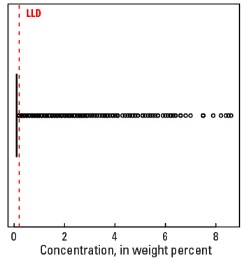
Boxplot
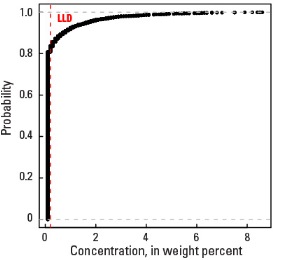
Empirical cumulative distribution function
Statistics - C Horizon
| Number of samples | 4,774 |
| LLD | 0.2 wt. % |
| Number below LLD | 2,903 |
| Minimum | <0.2 wt. % |
| 5 percentile | <0.2 wt. % |
| 25 percentile | <0.2 wt. % |
| 50 percentile | <0.2 wt. % |
| 75 percentile | 0.6 wt. % |
| 95 percentile | 3.2 wt. % |
| Maximum | 10.6 wt. % |
| MAD | ND |
| Robust CV | ND |
Histogram
Boxplot