


The purpose of these interpretive discussions is to provide a perspective on regional- and national-scale variations in element and mineral distributions in soils and their likely causes. The significant spatial variations shown by most elements and minerals can commonly be attributed to geologic sources in underlying parent materials, but other spatial variations seem clearly related to additional factors such as climate, the age of soils, transported source material, and anthropogenic influences. We attempt to distinguish the influence of these various factors on a regional and national scale. Numerous more local features might similarly be related to these same factors, but these features also have some probability of being an artifact of a random sampling of variable compositions, so that there is some probability of samples with similar compositions occurring in clusters of two or more adjacent sites by chance. Distinguishing such random occurrences from true variability is beyond the scope of the data from which these maps are constructed. Some caution, therefore, is advisable in interpreting the significance of these more local features unless some unique sources or processes can clearly be related to them.
Lead (Pb) is a metallic element that occurs naturally in many types of rocks and minerals. It is a toxin, linked to many ecological and human health conditions, especially neurological disorders. Additional detailed information on Pb and its toxicity is available at the Environmental Protection Agency (EPA) website and at the Agency for Toxic Substances and Disease Registry (ATSDR) website, or click to download a fact sheet about Pb. Although most natural materials in the United States, including soils, have Pb concentrations below the human health screening level established by the EPA (400 milligrams per kilogram (mg/kg)) for Pb in residential soils, many cases of higher concentrations have been documented near areas of current and historical mining and in urban areas. Lead has been used by humans for more than 5,000 years and was in wide use for diverse applications throughout our modern industrialized age. Many prominent uses were dispersive, such as Pb additives in gasoline, and as a pigment in house paint. Such uses have resulted in widespread contamination of soils, particularly in urban areas. Because of the toxicity of Pb, many such dispersive uses have been halted and anthropogenic Pb additions to the environment have declined. Although the overall consumption of Pb in the United States continues to increase, about 70 percent of the current demand, mostly for use in Pb–acid batteries, is satisfied by recycling rather than by mining of Pb ores. Statistics and information on the worldwide supply of, demand for, and flow of Pb–bearing materials are available through the U.S. Geological Survey (USGS) National Minerals Information Center (NMIC) website. Because of its toxicity and known elevated concentration in certain areas, the distribution of Pb has been studied in detail at local to regional scales. The national–scale geochemical maps of Pb concentrations in soils provide some additional larger–scale perspective on the Pb concentration in soils across the United States and help identify those parts of the nation where anthropogenic Pb contamination seems most widespread. The distribution of mineral resource deposits with Pb as a commodity (major or minor) in the United States, extracted from the USGS Mineral Resource Data System (MRDS) website, can be seen by hovering the mouse here.
The most common Pb mineral is galena (PbS), but it also occurs as a sulfate (anglesite, PbSO4), carbonate (cerussite, PbCO3), and oxide (minium, Pb3O4). Lead is a significant constituent of feldspar minerals, especially potassium (K) feldspar, which can contain up to percent concentrations of Pb. Lead can also occur in micas, zircon, and magnetite. The mobility of Pb in soils is limited by its ability to sorb to organic matter, clays, and iron (Fe) or manganese (Mn) oxides and hydroxides.
The Pb concentration in the Earth's upper continental crust is estimated to be 17 mg/kg (Rudnick and Gao, 2003). Its concentration is greatest in granitic rocks and sediments derived from them with concentrations averaging about 20 mg/kg. Shale is also somewhat elevated in Pb with concentrations averaging about 22 mg/kg. Mafic and carbonate rocks generally contain less than 5 mg/kg of Pb.
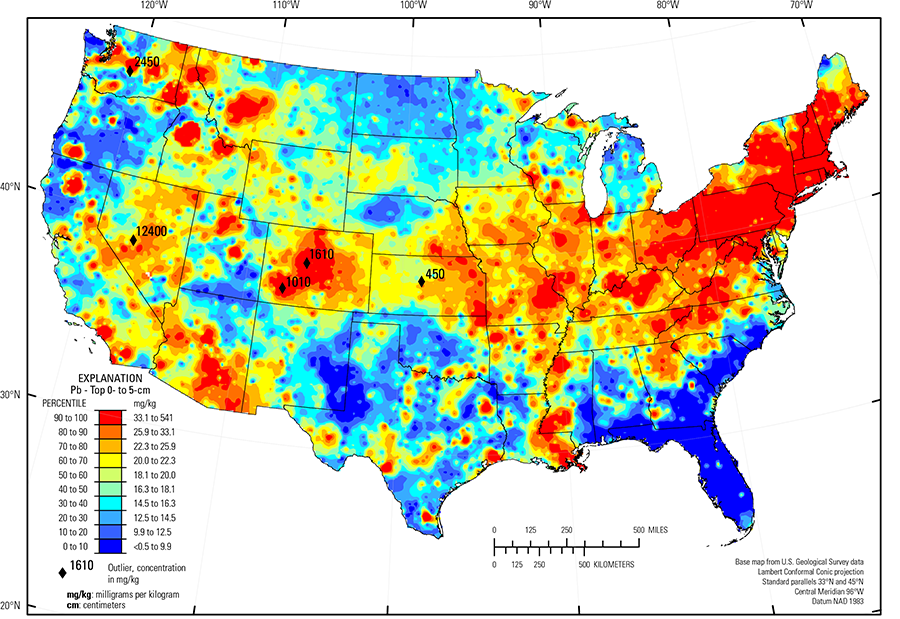
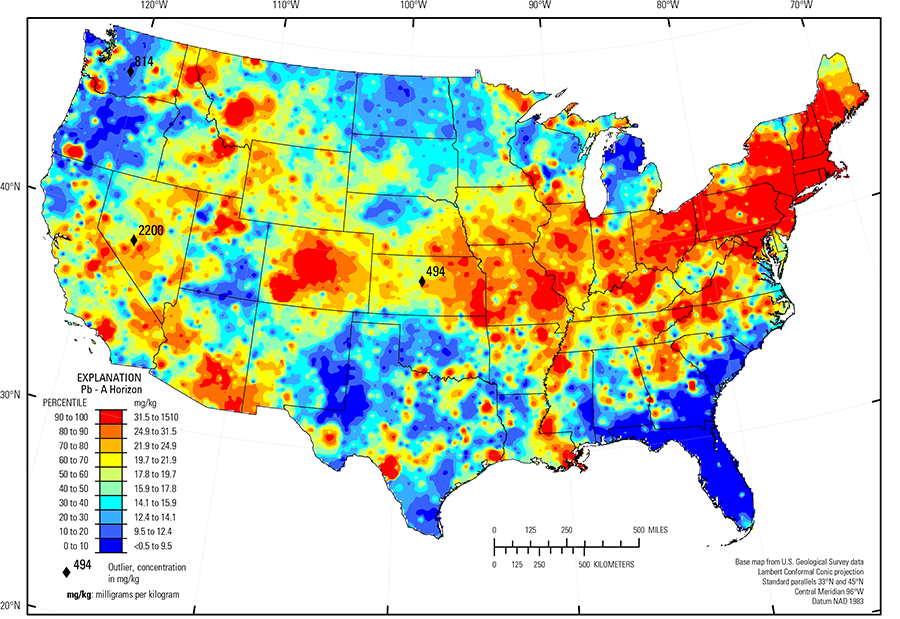
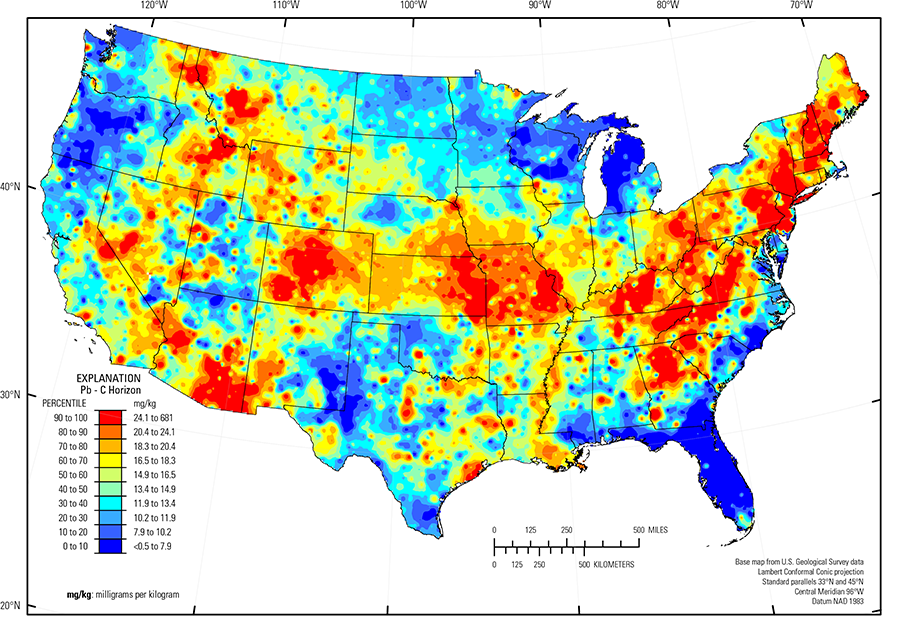
Our data show median Pb concentrations of 14.9 mg/kg for the soil C horizon, 17.8 mg/kg for the soil A horizon, and 18.1 mg/kg for soils collected from the top 0- to 5-cm layer (see the summary statistics [open in new window]). The significantly higher concentrations of Pb in the shallower soils may result from the tendency of Pb to bond with organic matter that is also enriched in some surface soils, or from anthropogenic additions of Pb to the surface.
The distribution of Pb in soils of the conterminous United States is primarily controlled by the composition of underlying soil parent materials. Areas of elevated Pb in soils are seen in:
- Northern Idaho; western Montana; parts of Nevada; central and southwestern Colorado; southeastern Arizona; the area along the borders of Oklahoma, Missouri, and Kansas; southeastern Missouri; and southwestern Wisconsin in areas of historical mining and mineral processing activity where Pb was mined primarily as the sulfide ore galena. Soils in these areas may be formed on mineralized bedrock containing elevated concentrations of Pb. In areas of extensive mining and mineral processing, it is also possible that there may be a component of Pb contamination from these activities superimposed on elevated background concentrations. It should also be noted that in some of these areas (for example, central and western Colorado) the bedrock contains significant quantities of K feldspar, which can contain elevated concentrations of Pb. Thus, the geochemical patterns observed on the maps may be the result of both Pb in mineralized soil parent material and Pb in feldspar-bearing soil parent material;
- Eastern Colorado and central Idaho where soil parent materials are bedrock containing significant amounts of K feldspar; and
- Southern Blue Ridge (USDA, 2006) and Piedmont (Fenneman and Johnson, 1946) where some soil parent materials contain substantial feldspar, but soil–forming processes in these relatively warm and humid regions have converted most feldspar to clays, mainly kaolinite, within the soils. As a result, the Pb concentration is more reflective of clay distribution in these regions.
In addition to natural variations in Pb concentrations, there may be significant and widely distributed anthropogenic Pb additions to soils, especially in the northeastern United States. This effect has been documented through monitoring of the Pb concentration in soils for several decades in several parts of the northeastern region (Richardson and others, 2014). In the northeastern United States, the Pb concentrations in the soil A horizon and top 0- to 5-cm layer are substantially greater than the Pb concentrations in the soil C horizon at many sample sites. The ratio of Pb concentrations between soil A and C horizons commonly exceeds 1.5, and it exceeds 2 for a significant part of the region. Such widespread near–surface elevated concentrations contrast with most other parts of the country, where generally smaller variations exist between soil horizons. The northeastern region, both currently and historically, is among the most heavily populated and industrialized parts of the country. Although some previously common dispersive uses of Pb, such as in leaded gasoline and paint, have been discontinued for decades, there is likely a legacy of these practices preserved in soils. Releases of Pb from industrial facilities are tracked through the EPA Toxic Release Inventory (TRI) website. In 2016 there were literally thousands of industrial facilities in the northeastern United States that used and released Pb, so that anthropogenic Pb additions to soils may have been occurring before and since that time.
Statistics - 0 TO 5 CM
| Number of samples | 4,841 |
| LLD | 0.5 mg/kg |
| Number below LLD | 2 |
| Minimum | <0.5 mg/kg |
| 5 percentile | 7.6 mg/kg |
| 25 percentile | 13.5 mg/kg |
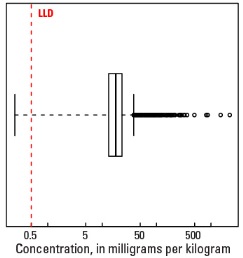
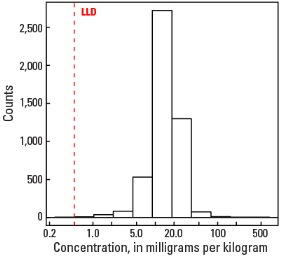
| 50 percentile | 18.1 mg/kg |
| 75 percentile | 23.9 mg/kg |
| 95 percentile | 44.5 mg/kg |
| Maximum | 12,400 mg/kg |
| MAD | 7.41 mg/kg |
| Robust CV | 41% |
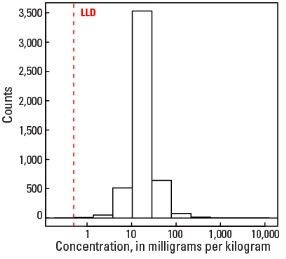
Histogram
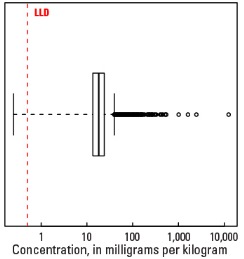
Boxplot
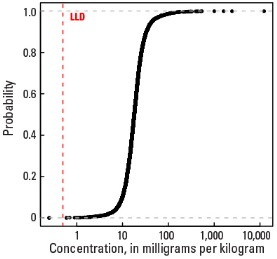
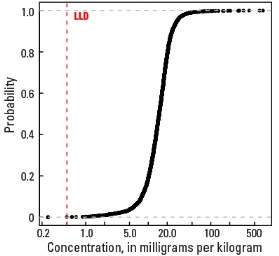
Empirical cumulative distribution function
Statistics - A Horizon
| Number of samples | 4,813 |
| LLD | 0.5 mg/kg |
| Number below LLD | 1 |
| Minimum | <0.5 mg/kg |
| 5 percentile | 7.3 mg/kg |
| 25 percentile | 13.2 mg/kg |
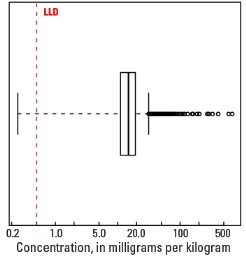
| 50 percentile | 17.8 mg/kg |
| 75 percentile | 23.2 mg/kg |
| 95 percentile | 40.2 mg/kg |
| Maximum | 2,200 mg/kg |
| MAD | 7.26 mg/kg |
| Robust CV | 40.8 % |
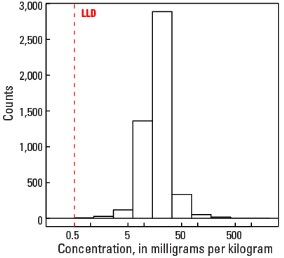
Histogram
Boxplot

Empirical cumulative distribution function
Statistics - C Horizon
| Number of samples | 4,780 |
| LLD | 0.5 mg/kg |
| Number below LLD | 4 |
| Minimum | <0.5 mg/kg |
| 5 percentile | 5.8 mg/kg |
| 25 percentile | 11.1 mg/kg |
| 50 percentile | 14.9 mg/kg |
| 75 percentile | 19.2 mg/kg |
| 95 percentile | 28.9 mg/kg |
| Maximum | 681 mg/kg |
| MAD | 6.08 mg/kg |
| Robust CV | 40.8 % |
Histogram
Boxplot