


The purpose of these interpretive discussions is to provide a perspective on regional- and national-scale variations in element and mineral distributions in soils and their likely causes. The significant spatial variations shown by most elements and minerals can commonly be attributed to geologic sources in underlying parent materials, but other spatial variations seem clearly related to additional factors such as climate, the age of soils, transported source material, and anthropogenic influences. We attempt to distinguish the influence of these various factors on a regional and national scale. Numerous more local features might similarly be related to these same factors, but these features also have some probability of being an artifact of a random sampling of variable compositions, so that there is some probability of samples with similar compositions occurring in clusters of two or more adjacent sites by chance. Distinguishing such random occurrences from true variability is beyond the scope of the data from which these maps are constructed. Some caution, therefore, is advisable in interpreting the significance of these more local features unless some unique sources or processes can clearly be related to them.
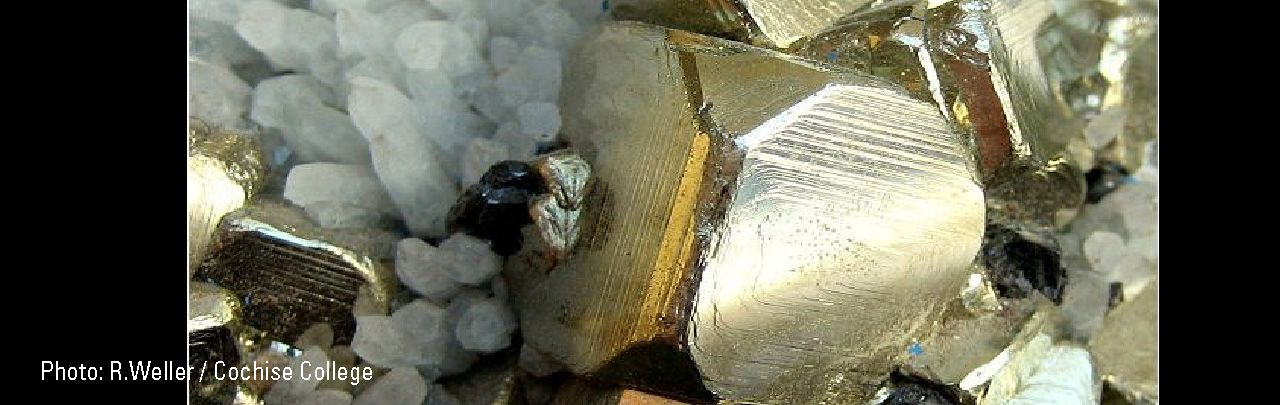
Pyrite is iron (Fe) sulfide (FeS2). Although pyrite is present in many rock types and in many mineral deposits, it is not stable in oxidizing environments and so it is rarely present in soils. Pyrite generally only persists in soils under reduced conditions.
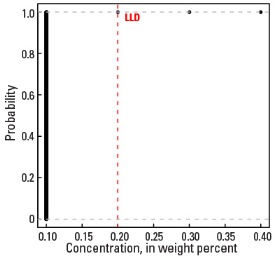
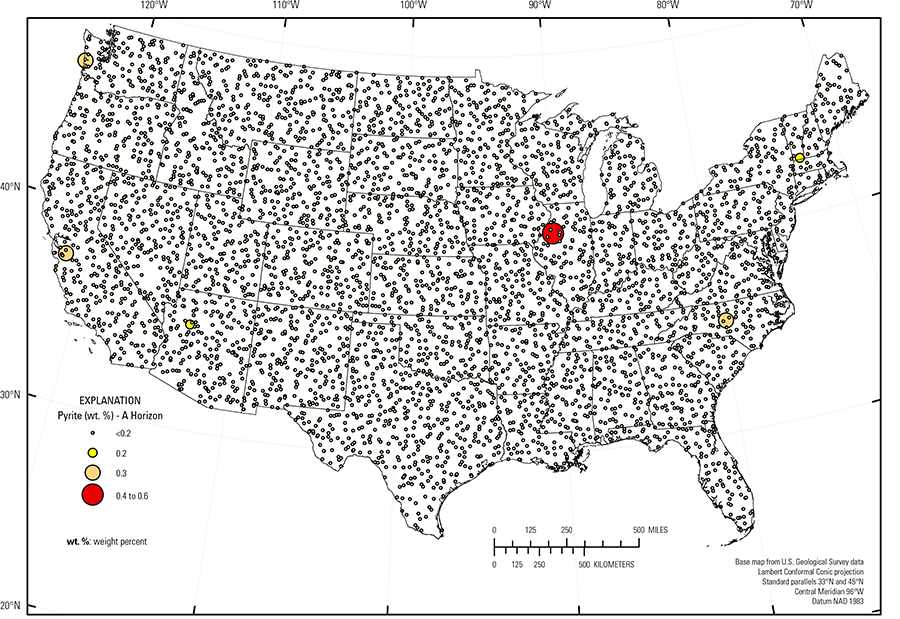
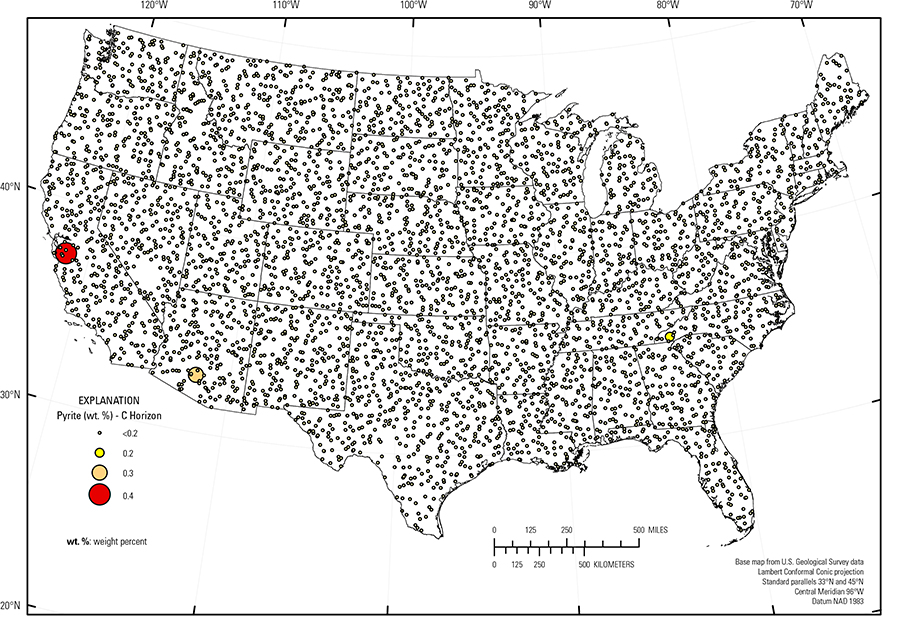
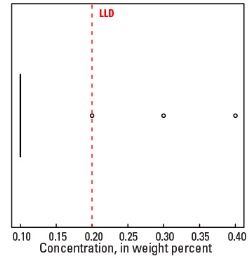
Pyrite is present at only three sites in the soil C horizon, with a maximum concentration of 0.4 weight percent (wt. %), and six sites in the soil A horizon, with a maximum concentration of 0.6 wt. %. (see the summary statistics [open in new window]). Because so few samples have pyrite concentrations above the detection limit (0.2 wt. %), the spatial distribution of pyrite is shown as a proportional symbol map rather than an interpolated and smoothed color surface map.
Only soil at a site in California has pyrite in both the soil A and C horizons. This soil developed on bedrock of the Franciscan Complex. The Franciscan Complex is composed of mafic and ultramafic rocks, and pyrite is a likely remnant from parent bedrock material. For the other two sites containing pyrite in the soil C horizon, the mineral again is likely relict from the geologic soil parent material.
The occurrence of pyrite in the soil A horizon, with no pyrite in deeper soils is more complex. Soil at a site in Arizona developed on gray shale and carbonate bedrock; an isolated pyrite grain may have persisted in the soil. Soils from sites in North Carolina and Vermont have high organic carbon, suggesting the possibility of a somewhat localized reducing environment where secondary pyrite may have formed. Soils at sites in Illinois and Washington have high phosphorus (P) concentrations in the soil A horizon, compared to those in the soil C horizon, as well as detectable pyrite. This suggests possible application of a soil amendment that may have contained pyrite. In any event, pyrite is not a significant mineral in any of the soil samples.
Statistics - 0 TO 5 CM
Statistics - A Horizon
| Number of samples | 4,802 |
| LLD | 0.2 wt. % |
| Number below LLD | 4,796 |
| Minimum | <0.2 wt. % |
| 5 percentile | <0.2 wt. % |
| 25 percentile | <0.2 wt. % |
| 50 percentile | <0.2 wt. % |
| 75 percentile | <0.2 wt. % |
| 95 percentile | <0.2 wt. % |
| Maximum | 0.6 wt. % |
| MAD | |
| Robust CV |
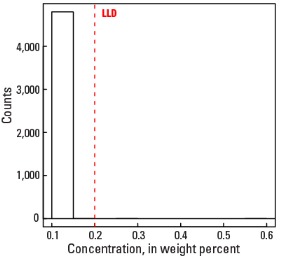
Histogram
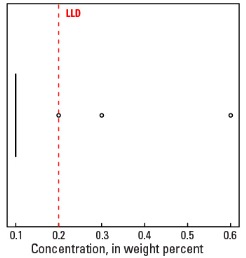
Boxplot
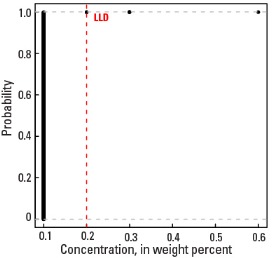
Empirical cumulative distribution function
Statistics - C Horizon
| Number of samples | 4,773 |
| LLD | 0.2 wt. % |
| Number below LLD | 4,770 |
| Minimum | <0.2 wt. % |
| 5 percentile | <0.2 wt. % |
| 25 percentile | <0.2 wt. % |
| 50 percentile | <0.2 wt. % |
| 75 percentile | <0.2 wt. % |
| 95 percentile | <0.2 wt. % |
| Maximum | 0.4 wt. % |
| MAD | |
| Robust CV |
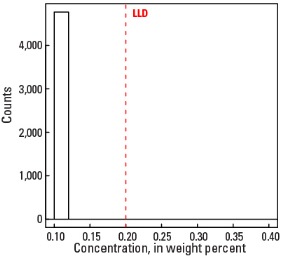
Histogram
Boxplot