


The purpose of these interpretive discussions is to provide a perspective on regional- and national-scale variations in element and mineral distributions in soils and their likely causes. The significant spatial variations shown by most elements and minerals can commonly be attributed to geologic sources in underlying parent materials, but other spatial variations seem clearly related to additional factors such as climate, the age of soils, transported source material, and anthropogenic influences. We attempt to distinguish the influence of these various factors on a regional and national scale. Numerous more local features might similarly be related to these same factors, but these features also have some probability of being an artifact of a random sampling of variable compositions, so that there is some probability of samples with similar compositions occurring in clusters of two or more adjacent sites by chance. Distinguishing such random occurrences from true variability is beyond the scope of the data from which these maps are constructed. Some caution, therefore, is advisable in interpreting the significance of these more local features unless some unique sources or processes can clearly be related to them.
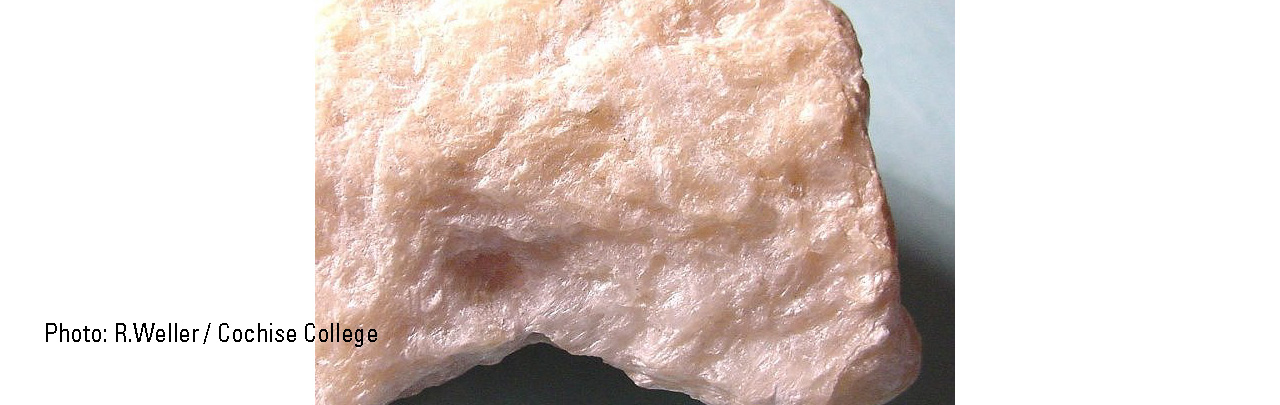
Talc is a magnesium (Mg) silicate that commonly forms by the hydrothermal alteration of ferromagnesian minerals (such as olivine, pyroxene, and amphibole) in ultramafic and mafic rocks. An ideal chemical formula for talc is Mg3(Si4O10)(OH)2. Serpentine (a group of Mg silicate minerals characteristic of altered ultramafic and mafic rocks) can also alter to talc, and both minerals can occur together.
The distribution of mineral resource deposits with talc as a commodity (major or minor) in the United States, extracted from the U.S. Geological Survey (USGS) Mineral Resource Data System (MRDS) website, can be seen by hovering the mouse here. Statistics and information on the worldwide supply of, demand for, and flow of talc are available through the USGS National Minerals Information Center (NMIC) website.
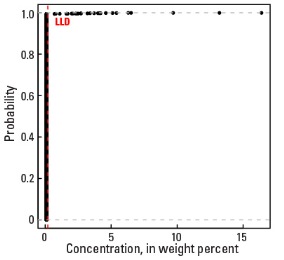
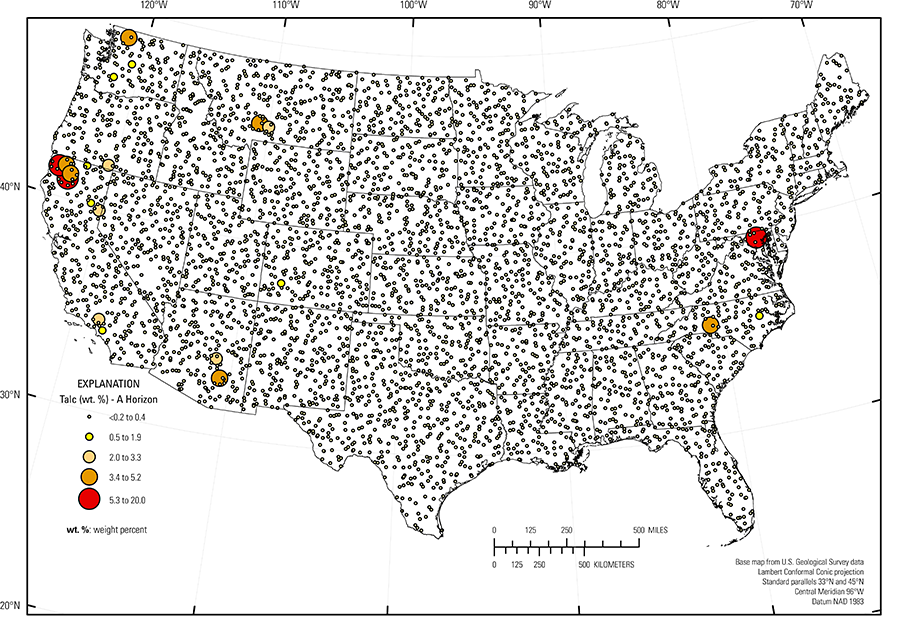
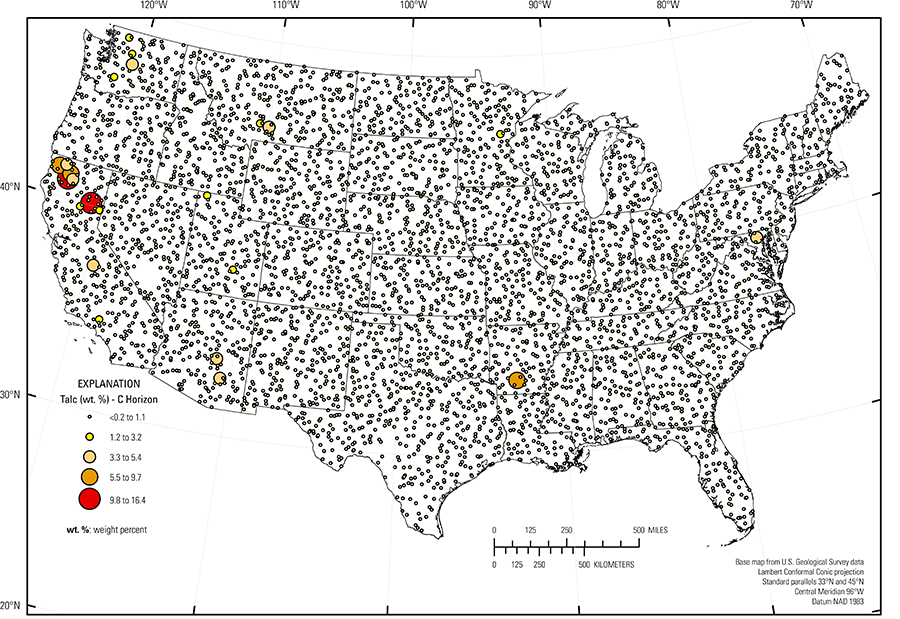
In our data, talc is present at only 26 sites, each in the soil A and C horizons, and with few exceptions, typically at the same site in both soil horizons (see the summary statistics [open in new window]). Because so few samples have talc concentrations above the detection limit (0.2 weight percent (wt. %)), the spatial distribution of talc is shown as a proportional symbol map rather than an interpolated and smoothed color surface map.
Talc is relatively stable in soils; thus, its distribution is controlled by the mineralogy of the soil parent material. Many soils with detectable talc also contain the amphibole mineral hornblende, a mineral characteristic of ultramafic and mafic igneous and metamorphic bedrock. In the Siskiyou–Trinity Area (USDA, 2006) in California, as well as in central Maryland, talc is present in 'serpentine soils' that developed on metamorphosed ultramafic rocks. These soils have unusual mineralogy (including serpentine and talc) and chemistry (high Mg and chromium (Cr) and low calcium (Ca) and potassium (K)), and support unique plant species tolerant of the extreme soil conditions. Other scattered occurrences of talc in soils of Washington, Arizona, Montana, and Arkansas have a similar ultramafic or mafic rock geologic origin.
Statistics - 0 TO 5 CM
Statistics - A Horizon
| Number of samples | 4,802 |
| LLD | 0.2 wt. % |
| Number below LLD | 4,776 |
| Minimum | <0.2 wt. % |
| 5 percentile | <0.2 wt. % |
| 25 percentile | <0.2 wt. % |
| 50 percentile | <0.2 wt. % |
| 75 percentile | <0.2 wt. % |
| 95 percentile | <0.2 wt. % |
| Maximum | 20 wt. % |
| MAD | |
| Robust CV |
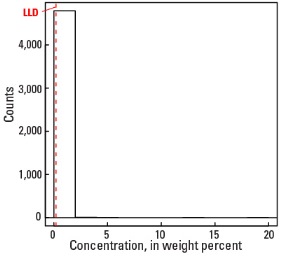
Histogram
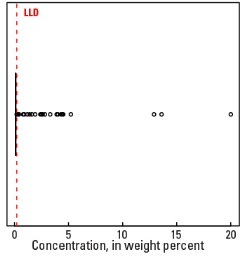
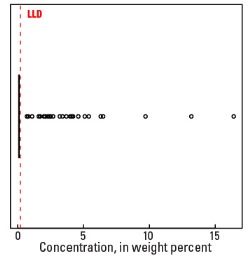
Boxplot
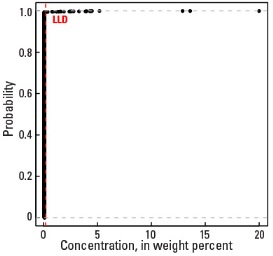
Empirical cumulative distribution function
Statistics - C Horizon
| Number of samples | 4,773 |
| LLD | 0.2 wt. % |
| Number below LLD | 4,747 |
| Minimum | <0.2 wt. % |
| 5 percentile | <0.2 wt. % |
| 25 percentile | <0.2 wt. % |
| 50 percentile | <0.2 wt. % |
| 75 percentile | <0.2 wt. % |
| 95 percentile | <0.2 wt. % |
| Maximum | 16.4 wt. % |
| MAD | |
| Robust CV |
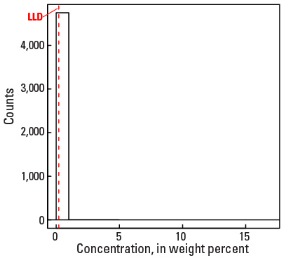
Histogram
Boxplot