


The purpose of these interpretive discussions is to provide a perspective on regional- and national-scale variations in element and mineral distributions in soils and their likely causes. The significant spatial variations shown by most elements and minerals can commonly be attributed to geologic sources in underlying parent materials, but other spatial variations seem clearly related to additional factors such as climate, the age of soils, transported source material, and anthropogenic influences. We attempt to distinguish the influence of these various factors on a regional and national scale. Numerous more local features might similarly be related to these same factors, but these features also have some probability of being an artifact of a random sampling of variable compositions, so that there is some probability of samples with similar compositions occurring in clusters of two or more adjacent sites by chance. Distinguishing such random occurrences from true variability is beyond the scope of the data from which these maps are constructed. Some caution, therefore, is advisable in interpreting the significance of these more local features unless some unique sources or processes can clearly be related to them.
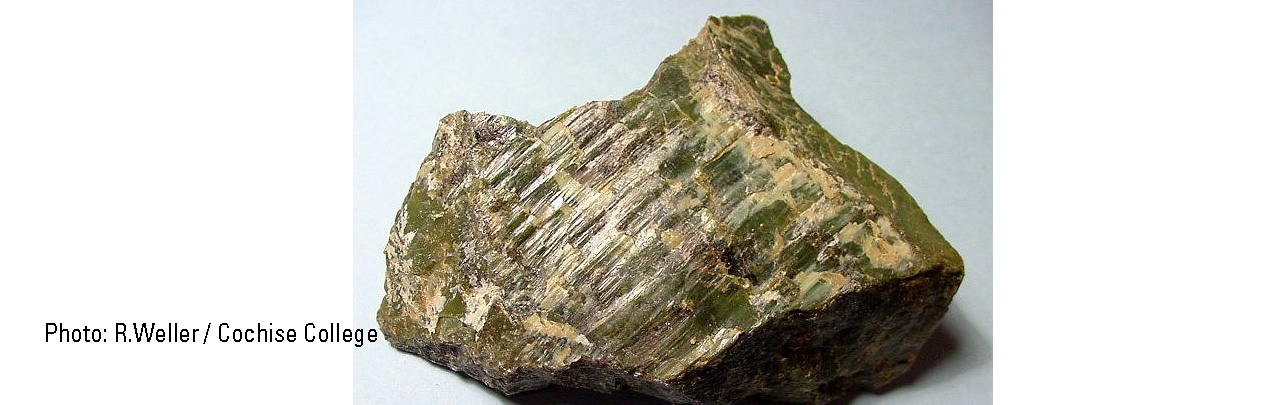
Serpentine represents a group of magnesium (Mg) silicate minerals with similar chemistry and crystal structure and a general chemical formula of (Mg,Fe)3(Si2O5)(OH)4. Serpentine is formed by the hydrothermal alteration of ferromagnesian minerals such as olivine and pyroxene in ultramafic and mafic igneous and metamorphic rocks. In some areas of altered ultramafic rocks, serpentine minerals form large masses. Such areas, including part of northern California and small areas in the Piedmont (Fenneman and Johnson, 1946) along the East Coast, can have 'serpentine' soils, with unusual mineralogy (including serpentine or talc, another Mg silicate mineral) and chemistry (such as high Mg, chromium (Cr), and nickel (Ni), and low calcium (Ca) and potassium (K)). These soils support plant species tolerant of the extreme soil conditions. Serpentine easily weathers to talc and smectite, a clay mineral with a basal spacing of 14 Å (1 Å (angstrom) = 10–10 meters (m)). Serpentine minerals are rare in soils because of their limited geologic occurrence and weathering susceptibility.
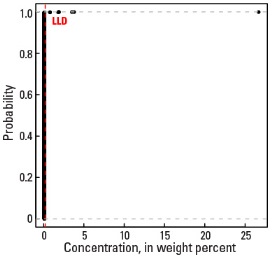
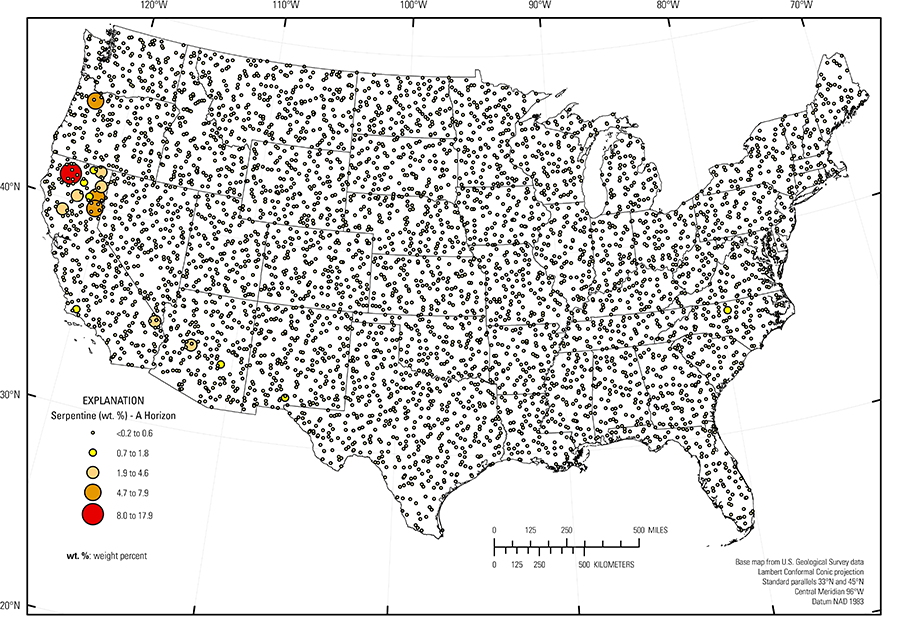
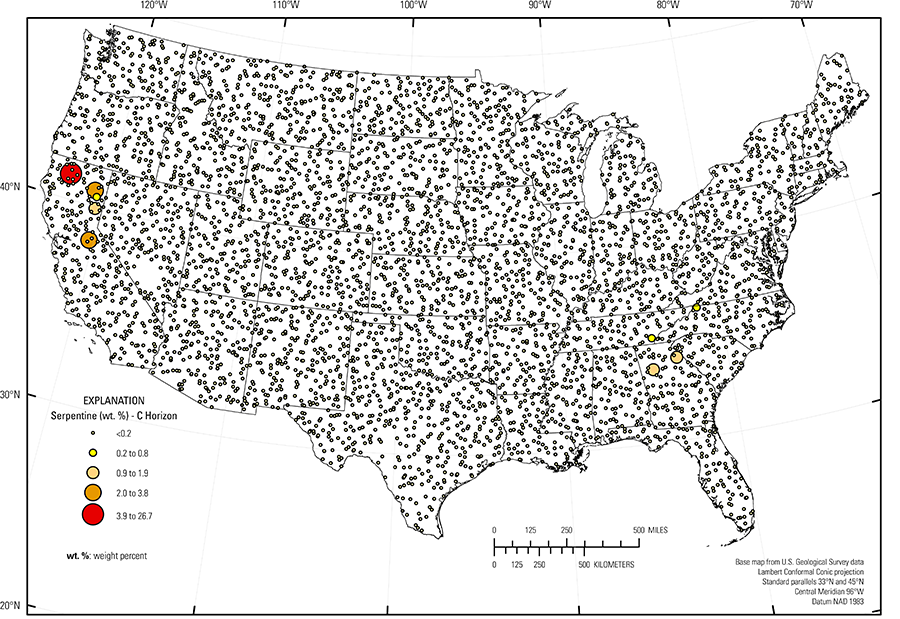
In our data, serpentine is present at only nine sites in the soil C horizon, with a maximum concentration of 26.7 weight percent (wt. %). Serpentine is present at 20 sites in the soil A horizon, with a maximum concentration of 17.9 wt. % (see the summary statistics [open in new window]). Because so few samples have serpentine concentrations above the detection limit (0.2 wt. %), the spatial distribution of serpentine is shown as a proportional symbol map rather than an interpolated and smoothed color surface map.
Most occurrences of serpentine in both the soil A and C horizons are in areas of California where soils developed on weathered ultramafic and mafic rocks. There also are other scattered occurrences in both the western and eastern United States where soil developed on ultramafic or mafic rocks. Serpentine is not present in a 'serpentine' soil sampled in Maryland, recognized because of its geochemistry; the intense weathering in this region has apparently altered all serpentine to talc.
Statistics - 0 TO 5 CM
Statistics - A Horizon
| Number of samples | 4,802 |
| LLD | 0.2 wt. % |
| Number below LLD | 4,782 |
| Minimum | <0.2 wt. % |
| 5 percentile | <0.2 wt. % |
| 25 percentile | <0.2 wt. % |
| 50 percentile | <0.2 wt. % |
| 75 percentile | <0.2 wt. % |
| 95 percentile | <0.2 wt. % |
| Maximum | 17.9 wt. % |
| MAD | |
| Robust CV |
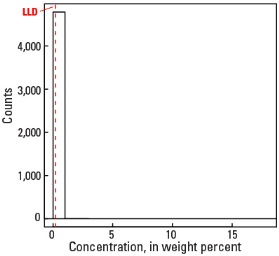
Histogram
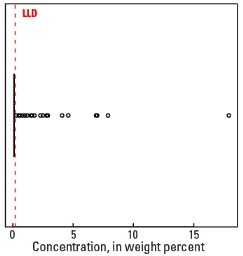
Boxplot
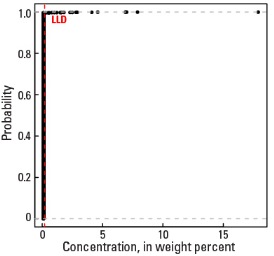
Empirical cumulative distribution function
Statistics - C Horizon
| Number of samples | 4,773 |
| LLD | 0.2 wt. % |
| Number below LLD | 4,764 |
| Minimum | <0.2 wt. % |
| 5 percentile | <0.2 wt. % |
| 25 percentile | <0.2 wt. % |
| 50 percentile | <0.2 wt. % |
| 75 percentile | <0.2 wt. % |
| 95 percentile | <0.2 wt. % |
| Maximum | 26.7 wt. % |
| MAD | |
| Robust CV |

Histogram
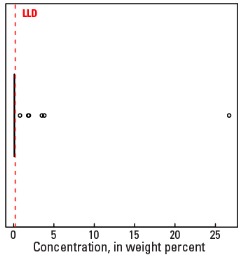
Boxplot