


The purpose of these interpretive discussions is to provide a perspective on regional- and national-scale variations in element and mineral distributions in soils and their likely causes. The significant spatial variations shown by most elements and minerals can commonly be attributed to geologic sources in underlying parent materials, but other spatial variations seem clearly related to additional factors such as climate, the age of soils, transported source material, and anthropogenic influences. We attempt to distinguish the influence of these various factors on a regional and national scale. Numerous more local features might similarly be related to these same factors, but these features also have some probability of being an artifact of a random sampling of variable compositions, so that there is some probability of samples with similar compositions occurring in clusters of two or more adjacent sites by chance. Distinguishing such random occurrences from true variability is beyond the scope of the data from which these maps are constructed. Some caution, therefore, is advisable in interpreting the significance of these more local features unless some unique sources or processes can clearly be related to them.
The category of amorphous material likely includes several classes of minerals and organic material, as well as possible artefacts of the quantification calculations. In the most general of terms, amorphous material is the amount of a sample that was not considered in the quantification process (100 percent minus the sum of all quantified material). To determine the amorphous concentration, an internal standard of zinc oxide (ZnO) was added to each sample at 10 weight percent (wt. %). Final results were recalculated to adjust the calculated amount of zinc oxide to its known 10 wt. % concentration and the percentage of other phases was adjusted accordingly. This generally resulted in a total of the quantified minerals being less than 100 percent and the amorphous concentration was assigned the difference between that total and 100 percent.
The nature of the amorphous material cannot be determined specifically from our data but some inferences can be made. The amorphous material likely includes:
- Organic material that is common in soils, especially the soil A horizon, but does not produce X–ray diffraction patterns that can be used for quantification;
- A variety of inorganic compounds that are insufficiently crystalline to produce diffraction patterns, such as amorphous silica, ferromanganese hydroxides, and poorly crystalline clays;
- Volcanic glass that is non-crystalline; and
- Undercalculations of some mineral phases, purely an artefact of imperfections in the quantification calculations.
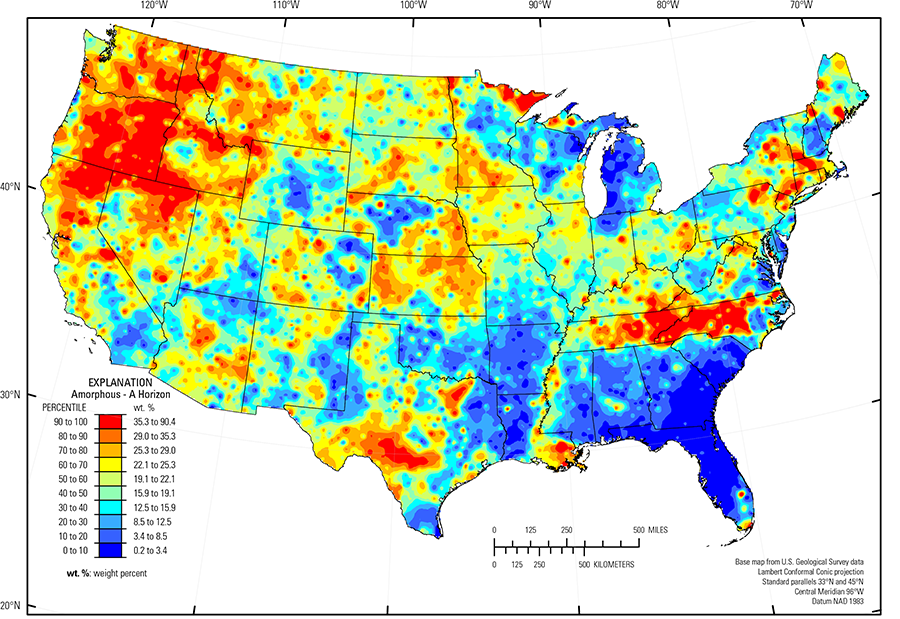
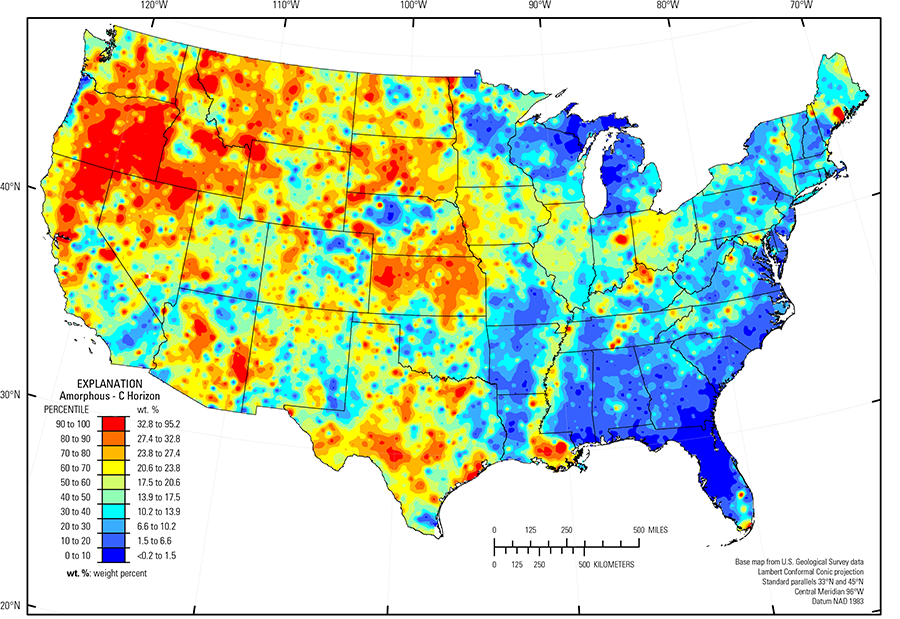
In our data, the median concentration of amorphous material is 19.1 wt. % for the soil A horizon and 17.5 wt. % for the soil C horizon. This difference probably reflects the somewhat higher concentration of organic compounds in the soil A horizon (see the summary statistics [open in new window]). The largest area of soils with high amorphous concentration is in the northwestern United States, where substantial areas contain more than 30 wt. %, an amorphous concentration that exceeds by 1.5 times the national median amorphous concentration. An unusual feature of this area is a widespread blanket of volcanic ash containing large amounts of volcanic glass that formed as a result of the catastrophic eruption of Mt. Mazama (now Crater Lake) about 7,700 years ago (Bacon and Lanphere, 2006). The unusual character of soils in the region is well known and described in many studies (for example, Page-Dumroese and others, 2007). Volcanic glass is a significant component of soils hundreds of kilometers away from Crater Lake. Soils in eastern Washington, for instance, more than 500 km from Crater Lake, generally contain more than 10 percent glass from the Mazama eruption (Kimsey and others, 2007). Although our data do not uniquely identify volcanic glass as distinct from other amorphous material, it seems likely, in view of the well–documented occurrence of glass in soils of the region, that this area of high amorphous concentration is strongly influenced by Mazama ash deposits or ash deposits from other Cascade volcanoes. Other contributing factors to the amorphous concentration of these soils may include organic material. Because both the soil A and C horizons have similar patterns of amorphous concentration, ash from the Mazama eruption may not be entirely responsible for the observed pattern. In much of this area, the Mazama ash is less than 1 meter (m) thick so Mazama ash should not be an important component of the soil C horizon samples. Perhaps earlier eruptions of Mazama, or other Cascade volcanoes, also have added substantial glass, or poorly crystalline breakdown products of glass, to deeper soils of this region. High concentrations of organic carbon (Corg) in soils of part of this region, such as the Northern Rocky Mountains (USDA, 2006), may also be responsible for part of the pattern of amorphous material.
In much of the eastern, southeastern, and Upper Midwest parts of the United States, the amorphous concentration of the soil A horizon correlates with organic carbon (Corg) concentration, so it appears the organic compounds account for most of the amorphous material in those regions. These higher concentrations are, for the most part, unique to the soil A horizon and generally do not occur in the soil C horizon, further suggesting that much of the amorphous material is organic compounds.
The Texas carbonate terrane, underlain mostly by limestone, has a high amorphous concentration that also correlates with the organic carbon (Corg) concentration, especially in the soil A horizon.
Soils formed on Southern Mississippi River Alluvium (USDA, 2006) have high amorphous concentrations that do not correlate strongly with organic carbon. These soils have high concentrations of 14Å clays (1 Å = 10-10 meters(m)), which may be undercalculated by our method (see discussion and maps of 14Å clays), so the amorphous material there may be related to that group of clay minerals.
The amorphous concentration of the soil A horizon has a sharp boundary between soils rich in amorphous material in Tennessee and North Carolina and soils with low amorphous concentration to the south in South Carolina, Georgia, and Alabama. This is a result of variations in field identification of soils and variable sampling between two field crews who applied different definitions of the base of the soil A horizon. This sharp boundary is an artefact of sampling variation of the soil A horizon and does not appear in the soil C horizon.
Statistics - 0 TO 5 CM
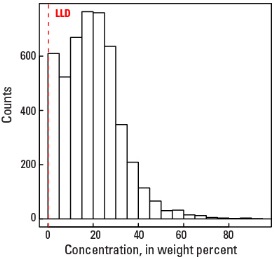
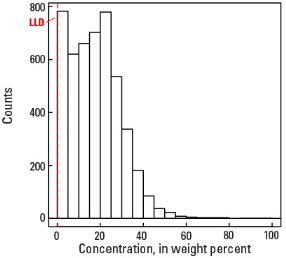
Statistics - A Horizon
| Number of samples | 4,802 |
| LLD | 0.2 wt. % |
| Number below LLD | 274 |
| Minimum | <0.2 wt. % |
| 5 percentile | <0.2 wt. % |
| 25 percentile | 10.8 wt. % |
| 50 percentile | 19.1 wt. % |
| 75 percentile | 26.9 wt. % |
| 95 percentile | 42.1 wt. % |
| Maximum | 90.4 wt. % |
| MAD | |
| Robust CV |
Histogram
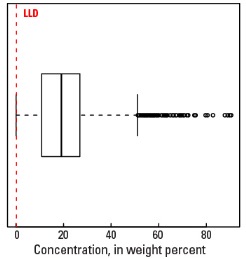
Boxplot
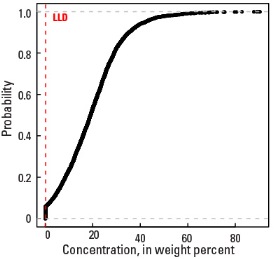
Empirical cumulative distribution function
Statistics - C Horizon
| Number of samples | 4,773 |
| LLD | 0.2 wt. % |
| Number below LLD | 345 |
| Minimum | <0.2 wt. % |
| 5 percentile | <0.2 wt. % |
| 25 percentile | 8.4 wt. % |
| 50 percentile | 17.5 wt. % |
| 75 percentile | 25.2 wt. % |
| 95 percentile | 37.9 wt. % |
| Maximum | 95.2 wt. % |
| MAD | |
| Robust CV |
Histogram
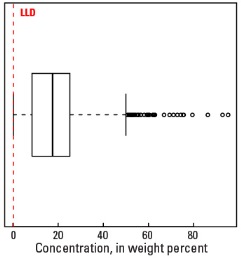
Boxplot
