
U.S. GEOLOGICAL SURVEY
Water-Resources Investigation Report 03-4178
Honolulu, Hawaii 2003
Commonwealth Utilities Corporation, Commonwealth of the Northern Mariana Islands
Figures are in pdf format. Download Adobe reader for free.
Saipan has an area of 48 mi2 and is the largest of the 14 islands in the Commonwealth of the Northern Mariana Islands (CNMI). The island is formed by volcanic rocks overlain by younger limestones. The island is situated in the western Pacific Ocean at latitude 15°12'N and longitude 145°45'E, about 3,740 mi west-southwest of Honolulu and midway between Japan and New Guinea (fig. 1). The climate on Saipan is classified as tropical marine with an average temperature of 80°F. The natural beauty of the island and surrounding waters are the basis for a growing tourist-based economy. The resulting rapid development and increases in resident and tourist populations have added stresses to the island's limited water supplies.

Figure 1. Location map and shaded relief of Saipan.
Freshwater resources on Saipan are not readily observable because, aside from the abundant rainfall, most freshwater occurs as ground water. Fresh ground water is found in aquifers composed mainly of fragmental limestones. About 90 percent of the municipal water supply comes from 140 shallow wells that withdraw about 11 Mgal/d. The chloride concentration of water withdrawn from production wells ranges from less than 100 mg/L for wells in the Akgak and Capital Hill well fields, to over 2,000 mg/L from wells in the Puerto Rico, Maui IV, and Marpi Quarry well fields.
The chloride concentrations and rates of ground-water production are not currently adequate for providing island residents with a potable 24-hour water supply and future demands are expected to be higher. To better understand the ground-water resources of the island, and water resources on tropical islands in general, the U.S. Geological Survey (USGS) entered into a cooperative program with the Commonwealth Utilities Corporation (CUC). The objective of the program, initiated in 1989, is to assess the ground-water resources of Saipan and to make hydrologic information available to the CUC in support of their ongoing efforts to improve the quality and quantity of the municipal water supply.
This report presents some of the results of the program including descriptions of (1) the geography and geology, (2) the occurrence of fresh ground water in permeable limestones that extend to some distance below sea level where water-level elevation is affected by ocean tides (coastal aquifers) and in limestones that overlie volcanic basement rocks above sea level (high-level aquifers), (3) the water-table configuration and directions of ground-water flow, and (4) the rainfall, ground-water withdrawal, and chloride concentrations in well water. Also described is the relation of the changes in water-table elevations to changes in sea level, rainfall, and ground-water withdrawal.
The population of Saipan resides primarily on and adjacent to the western coastal plain and the plateau areas at the southern end of the island and the Kagman Peninsula. The interior of the island and most of the northern and eastern coastal areas are less populated. Parts of the central uplands and the northern region of the island contain undeveloped secondary forest and grassland, and small pockets of primary forest. Land uses include hotel resorts, golf courses, garment manufacturing, small businesses, agriculture, and residential activities. Several quarries, a solid-waste dump, septic systems, and commercial activities may present a potential for ground-water contamination.
The population of Saipan, about 62,400 people in 2000 (U.S. Census Bureau, 2001), resides primarily in rural village areas along the western coast, on the southern plateau, and on the Kagman Peninsula, occupying about 70 percent of the island (fig. 1), and including public, commercial, and residential areas. Public land accounts for about 15 percent, commercial land about 20 percent, and residential land about 35 percent. Public land use includes the airport, sea port, schools, cemetery, agricultural cooperatives, Lake Susupe and adjacent wetland areas, parks, and beaches. Commercial land use includes hotel resorts, golf courses, garment manufacturing, and small businesses. Residential land use includes small-scale farming and grazing, and homestead developments. The remaining 30 percent of the island consists of unused grassland, secondary forest, and isolated regions of primary forest.
Land uses that may affect the potential for ground-water contamination include (1) quarries used for the extraction of limestone building materials, (2) an old solid-waste dump site near Puerto Rico, (3) small-scale sewage-waste systems of residences and businesses located away from the sewer-treatment distribution system, (4) commercial fuel-storage facilities, and (5) businesses such as gasoline stations, dry cleaners, and automotive repair and painting facilities. In the past, all solid waste, including toxic materials, was dumped at the unlined solid-waste dump located along the coast at Puerto Rico; however, in February 2003, the dump was closed and a new landfill constructed to U.S. Environmental Protection Agency (USEPA) specifications was opened at Bañaderu on the northern end of the island.
The surface terrain of Saipan is dominated by a succession of nearly horizontal limestone platforms and terraces, separated by steep scarps, that ascend from the sea towards central uplands in the northern three-fourths of the island. The eastern, southern, and northern coasts are backed by limestone cliffs of varying relief separated intermittently by small beaches and coves. The western coast is formed by a narrow coastal plain of limesand. Toward the southern end of the coastal plain is a small brackish lake surrounded by an extensive marshy area. Seaward of the west coast is a shallow lagoon bordered by a barrier reef.
Although it is the largest of the 14 islands that make up the CNMI, Saipan is only about 13 mi long north to south and averages less than 4 mi wide. The 48 mi2 island has a maximum elevation of 1,555 ft above sea level at Mount Tagpochau, a little south of center, and 942 ft at the top of the Kalabera cliffs (Laderan Kalaberan Lichan), toward the northern end. The surface landforms of Saipan were separated into six principal physiographic subdivisions by Cloud and others (1956) (fig. 2).
Of the six principal physiographic subdivisions, the central uplands cover the largest land area and most of the elevation above 300 ft. The central uplands encompass northern and southern terraced limestone uplands that are separated by a central volcanic ridge with slopes that are dissected by erosion into short, rugged valleys and steep hills. To the southeast of Mount Tagpochau, the central uplands are bordered by a group of high volcanic hills that culminate at Mount Laulau.
The central uplands are bordered by a set of limestone platforms and terraced benches that form a terraced pattern downward to the sea. The limestone platforms are conspicuous, broad, and relatively flat areas at the southern, southeast-central, and northern margins of the central uplands. The elevations of the limestone platforms range from about 120 to 240 ft. The terraced benches occur around and between the limestone platforms. The southeastern coastal fault ridges are distinct from the low limestone platforms and terraced benches bordering the eastern coast in their abrupt topographic rise to over 400 ft. The Donni clay hills belt extends northward from Mount Laulau as an irregularly narrow strip about 3 mi long with an average width of 1/2 mi. The area is marked by short and rounded east-west ridges separated by steep-sided ravines at elevations from about 100 to 500 ft. The western coastal plain extends continuously south from the beaches at San Roque to Agingan Point and ranges in width from 1/8 to over 1 mi. The western coastal plain is predominately composed of emerged calcium carbonate sands and its surface rises gradually inland to elevations generally not more than 15 to 20 ft. Part of the coastal plain contains wetland areas, the largest of which surrounds the brackish-water Lake Susupe. Lake Susupe has an area of about 45 acres at normal water levels and ground water flows into the lake during periods of low lake stage (Wong and Hill, 2000). Seaward of the long west-coast beach is a shallow lagoon which is separated from the Philippine Sea by a barrier reef (fig. 3).
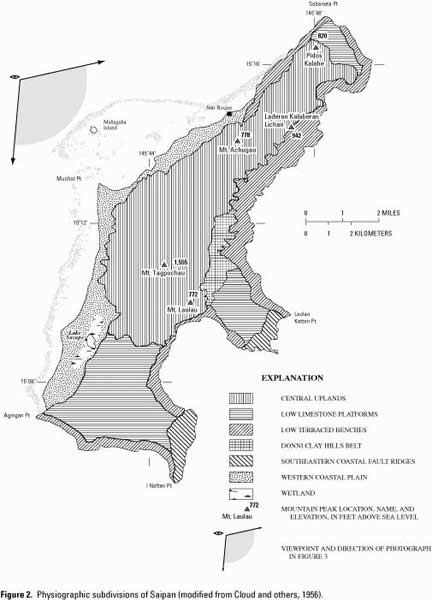
Figure 2. Physiographic subdivisions of Saipan (modified from Cloud and others, 1956).
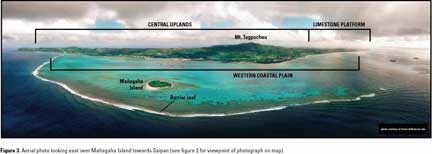
Figure 3. Aerial photo looking east over Mañagaha Island towards Saipan (see figure 2 for viewpoint of photograph on map).
Saipan is a subareal peak on the Mariana island arc and consists of a volcanic core overlain by younger limestones. Limestones and calcareous deposits dominate the surface lithology, comprising about 90 percent of the surface exposures. Volcanic rocks are exposed on the remaining 10 percent of the land surface. Primary and secondary porosity of the limestones usually result in high permeability (conducive to faster ground-water flow), whereas poor sorting and alteration in the volcanic rocks usually result in low permeability (conducive to slower ground-water flow). Faults transect the island in a north-northeast direction, complicating the sequence and permeabilities of the rock units.
The eight most hydrologically significant of the thirteen geologic units described by Cloud and others (1956) are shown in figure 4. The dacitic flow and pyroclastic rocks of the Sankakuyama Formation are the oldest exposed rocks and underlie all other exposed rock units. Radiometric dating of two samples of Sankakuyama dacite indicate an age of about 41 million years, confirming Cloud and others (1956) suggestion that the formation was likely to be late Eocene in age (Meijer and others, 1983). The thickness of the Sankakuyama Formation is unknown; however, the thickness is at least 1,800 ft based on a section calculated from exposed rocks along the flanks of Mount Achugao. Mount Achugao is interpreted by Cloud and others (1956) to be a remnant of a stratified composite volcanic cone whose Eocene center was not far north of the present peak.
Two other volcanic formations of Eocene age are exposed in the vicinity of Mount Achugao: the andesitic pyroclastic rocks, lava flows, and water-laid volcanogenic sediments of the Hagman Formation and the marine transitional rocks, volcanogenic sediments, and andesitic breccia of the Densinyama Formation. The Hagman Formation also is exposed along the flanks of Mount Laulau and on the eastern side of the Laulau Bay fault near the coast at I Naftan Pt and Kagman Peninsula. The estimated thickness of the Hagman Formation is 1,100 ft based on the cumulative thickness of its facies. The thickness of the Densinyama Formation thins to zero from a maximum of about 800 ft.
The Fina-Sisu Formation, made up of calcareous marine tuffs and andesite flows, occurs as deeply weathered outcrops in the Fina Sisu hills area of southern Saipan. Cloud and others (1956) reported a late Oligocene age for the Fina-Sisu Formation based on microfossils; however, potassium/argon analysis produced an age of about 13 million years before present, indicating the formation is middle Miocene in age (Meijer and others, 1983). The maximum exposed thickness is about 400 ft; however, the true maximum thickness is not known because the base of the formation is not exposed. Generally, the surfaces of the iron and alumina-rich andesitic rocks and sediments have been intensely weathered and altered to clay, soft saprolites, and poor quality acidic soils. The surfaces of the quartz-rich dacitic rocks remain almost unweathered.
The Miocene age Tagpochau Limestone is a complex of calcareous clastic rocks that intergrade with one another and are distinguished from other fragmental limestones on Saipan mainly on fossil evidence (Cloud and others, 1956). The most widely distributed facies of the Tagpochau Limestone is a compact, generally pure, pink to white, inequigranular limestone. The formation also includes impure limestone and sedimentary facies of reworked volcanic materials. The Tagpochau Limestone covers nearly half of the land area of Saipan and is the principal rock type that makes up the central highlands. The unit thickness ranges from near zero at exposures near Mount Achugao, to at least 900 ft based on composite sections from the cliffs on the northern end of the island.
The early Pleistocene age Mariana Limestone is a mainly light colored (dirty white to brownish), coarsely porous, finely to coarsely fragmental limestone that contains abundant coral remains. The Mariana Limestone differs from the Tagpochau Limestone in its combination of coarsely porous and fragmental texture, abundance of corals, and the modern aspect of its fossil assemblage. Thickness of the Mariana Limestone on Saipan ranges from near zero to about 500 ft and the largest areas of outcrop are in southern Saipan, the Kagman Peninsula, and the Bañaderu area on the northern end of the island. About half of the 140 municipal production wells on Saipan are completed in the Mariana Limestone.
The Tanapag Limestone includes mainly dirty white to brownish coral-algal reef limestone and bioclastic limestone. The rock generally is well indurated and coarsely porous and well preserved coral heads and mollusk shells are common. Much of the Tanapag Limestone closely resembles parts of the massive facies of the Mariana Limestone; however, the Tanapag Limestone is restricted to elevations of less than 100 ft and its surface ordinarily is constructional rather than erosional (Cloud and others, 1956). The Tanapag Limestone appears to have formed mainly as constructional fringing reefs on an emerging surface and its maximum thickness probably is less than 50 ft. The deposits of Pleistocene and Holocene age include younger terrace deposits of varied types of reworked volcanic materials, marsh deposits, recently emerged limesands, and present reef and beach deposits.
Saipan has undergone deformation and apparent changes of elevation relative to the ocean at various times since first becoming a land mass in Eocene time. The principal tectonic features are normal faults that trend northeast, approximately parallel to the island's long axis and to the trend of the Mariana island arc. The faulting has introduced complexity into the sequence and permeabilities of the rocks. In some places, faults exposed at the surface in limestone show weathered gaps along the fault, suggesting that some faults in limestone may represent narrow zones of relatively higher permeability than the surrounding rock. In other places, test drilling near fault zones in limestone has penetrated dense, hard, and compact rock, suggesting that compression of the rock near the fault zone may represent zones of relatively lower permeability than the surrounding rock.
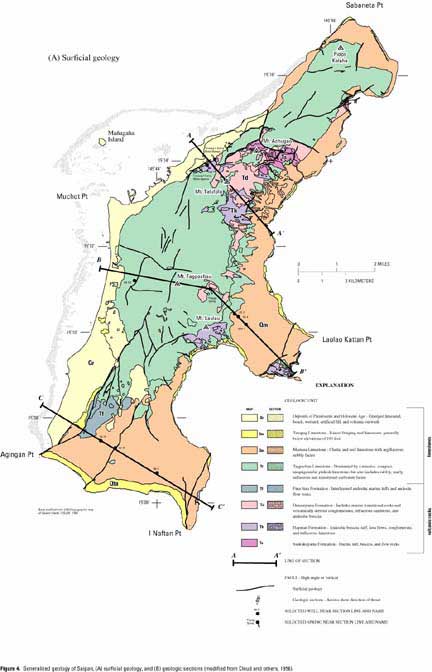
Figure 4. Generalized geology of Saipan, (A) surficial geology, and (B) geologic sections (modified from Cloud and others, 1956).

Figure 4. Generalized geology of Saipan, (A) surficial geology, and (B) geologic sections (modified from Cloud and others, 1956).--Continued
The primary municipal water supply for the island of Saipan comes from ground water. Saturated limestones form the principal aquifers on the island. Rainwater infiltrates the high-permeability limestones and maintains a freshwater body within the island. As on other oceanic islands, fresh ground water on Saipan is underlain by saltwater. Some fraction of the fresh ground water can be withdrawn by wells, but freshwater quality and availability can be affected by overpumping or sustained periods of dry weather.
On Saipan, the position of the volcanic basement rocks relative to sea level and the overlying limestone affects the occurrence of ground water. Most of the recoverable fresh ground water in Saipan is found in limestones that extend from the land surface to some distance below sea level (fig. 5). A smaller amount of recoverable fresh ground water is found in limestones that overlie volcanic basement rocks above sea level. Test drilling has shown the volcanic basement rocks contain fresh ground water; however, the volcanic rocks generally are not considered an aquifer because of their low permeability (permeability describes the ease with which water can move through rock). In contrast, the limestone generally has high permeability resulting from intergranular pores and spaces between the accumulated material as well as larger voids, which formed when the limestone was deposited or developed later by dissolution.
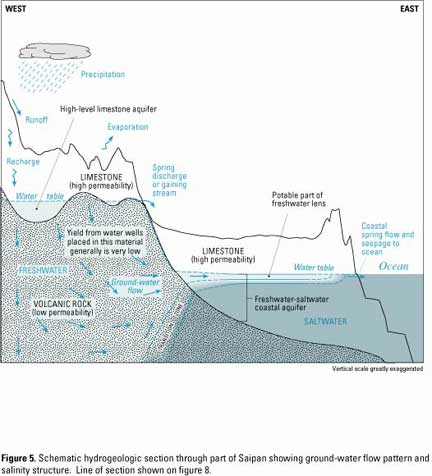
Figure 5. Schematic hydrogeologic section through part of Saipan showing ground-water flow pattern and salinity structure. Line of section shown on figure 8.Generalized geology of Saipan, (A) surficial geology, and (B) geologic sections (modified from Cloud and others, 1956).
Aquifers where water-level elevation is affected by ocean tides (coastal aquifers).--As in other small oceanic islands, most of the available fresh ground water in Saipan is in a freshwater-saltwater coastal-aquifer system where a lens-shaped body of fresh and brackish ground water floats on denser saltwater within the island (fig. 5). Most ground-water withdrawal on Saipan is from the Mariana Limestone aquifer, a coastal aquifer composed of wellindurated, coarsely porous, fragmental limestones that locally contain sedimentary facies of reworked volcanic materials.
Aquifers that overlie volcanic basement rocks that extend above sea level (high-level aquifers).--In the central uplands of Saipan, fresh ground water is found in limestone aquifers that overlie lower-permeability volcanic basement rocks that extend above sea level (fig. 5). Ground-water in these high-level limestone aquifers is above the influence of short-term sea-level fluctuations and has a low salinity, originating entirely from rainfall. The horizontal extent and saturated thickness of these aquifers are limited and overpumping or sustained periods of dry weather can affect ground-water availability. Ground water from high-level limestone aquifers is withdrawn at the Akgak and Capital Hill well fields. Additionally, many low-discharge springs and seeps partially drain high-level aquifers in the central uplands. Water from Donni Spring, Tanapag I and II Springs, and Achugao Spring contributes to the municipal supply. Water level in the high-level aquifers and flow from springs that partially drain these aquifers fluctuate seasonally and are sensitive to periods of low rainfall. Water level and springflow are highest during the wet season and decline throughout the dry season, reaching their lowest levels during sustained periods of below normal rainfall.
Theoretical freshwater lens and actual conditions on Saipan.--The Ghyben-Herzberg principle commonly is used to relate the thickness of a freshwater lens in an ocean-island aquifer to the density difference between freshwater and saltwater. The principle states that the theoretical interface between freshwater and saltwater is at a depth below sea level that is 40 times the elevation of the water table above mean sea level (Todd, 1980). In reality, instead of a sharp freshwater-saltwater interface, freshwater is separated from saltwater by a transition zone in which salinity grades from freshwater to saltwater. In many field studies, the Ghyben-Herzberg interface depth has been found to correspond to the depth of about a 50-percent mix of freshwater and saltwater. Under equilibrium flow conditions in permeable aquifer systems, the Ghyben-Herzberg principle may provide a reasonable estimate of freshwater depth if the transition zone is thin relative to the thickness of the freshwater lens.
Definition of potable freshwater.--Salinity in a freshwater lens is gradational, from an upper freshwater core through the underlying transition zone to saltwater. A chloride concentration of 250 mg/L is the maximum contaminant level (MCL) for drinking water recommended as a secondary standard by the USEPA (U.S. Environmental Protection Agency, 1991). Secondary standards are not mandatory requirements, but instead establish limits for constituents that may affect the aesthetic qualities of drinking water (taste and odor, for example). In this report, the potable part of the freshwater lens is defined as water having a chloride concentration less than or equal to 250 mg/L. Seawater has a chloride concentration of about 19,200 mg/L (Thurman, 1990).
Ground-water flow, recharge, and temporal variations in lens size.--Water flows continuously in a freshwater lens. Rainfall infiltrates and recharges the aquifer, where frictional resistance to flow causes the water to accumulate and a lens to form. Freshwater flows by gravity to the shore, where it discharges as diffuse seepage and as springflow at shoreline and submarine springs (fig. 6). On small islands such as Saipan, mixing in the transition zone results mainly from tidal
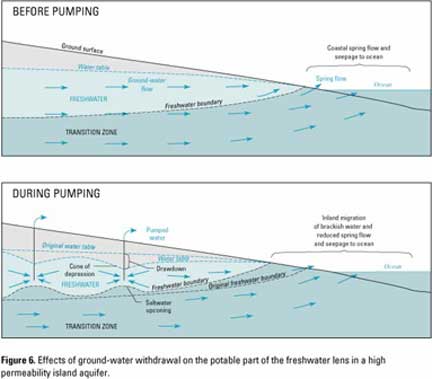
Figure 6. Effects of ground-water withdrawal on the potable part of the freshwater lens in a high permeability island aquifer.
Ground-water withdrawal from wells, saltwater upconing, and regional lens depletion.--Some fraction of fresh ground-water recharge can be withdrawn continuously by wells, in effect capturing a fraction of the natural discharge. The most efficient means of developing freshwater from a thin lens is to locate widely spaced wells near the water table where the lens is thickest and to maintain low, uniform pumping rates at each well (fig. 6). This spreads withdrawal over a wide area and skims freshwater from the lens. The more widespread the withdrawal, the greater the fraction of recharge that can be withdrawn with salinity acceptable for the municipal supply. Saltwater upconing can contaminate wells if the lens is too thin, if wells are too deep (too close to the transition zone), or if too much water is withdrawn from a small area. Even if wells are designed and placed to minimize local upconing, the lens will gradually shrink to a size that is in balance with the withdrawal. This regional shrinkage raises the transition zone closer to the wells, potentially close enough to increase the salinity of pumped water. Shrinkage of the freshwater lens due to dry weather can also contribute to high salinity in wells.
Saipan receives about 80 in. of rainfall annually and has distinct wet and dry seasons. All fresh ground water on Saipan originates as rainfall. About 11 Mgal/d is withdrawn from 140 continuously operated municipal wells located primarily in the southern, east-central, and central regions of the island. Most production comes from well fields in southern Saipan, accounting for about 6.4 Mgal/d. The volume-weighted chloride concentration of pumped water from municipal well fields ranges from less than 100 mg/L in the Akgak and Capital Hill well fields to over 2,000 mg/L in the Maui IV, Puerto Rico, and Marpi Quarry well fields. Chloride-concentration data from monitor and municipal wells indicate that pumping-induced upconing of the transition zone is a major constraint on well location, spacing, depth, and pumping rate.
Rainfall.--Seasonal differences in rainfall define distinct wet and dry seasons on Saipan (fig. 7). The months of July through November (the wet season) receive about 67 percent (53 in.) of the annual rainfall; January through May (the dry season) receive 21 percent (17 in.) of the rainfall; and December and June (transitional months) receive 12 percent (10 in.) of the rainfall. Rainfall records for Saipan are available for most years since 1901 from German, Japanese, and U.S. sources; however, there is confusion about the location of some rain gages and no long-term records are available for any one location (unpublished rainfall data on file at the USGS Saipan Field Office). From 1901 to 2000, the annual totals of rainfall ranged from a low of 34.23 in. in 1998 at the Commonwealth Ports Authority (CPA) Tower rain gage at Isley Field, to a high of 145.07 in. in 1978 at the former Hakmang Communication Center on the Kagman Peninsula. The lowest monthly rainfall recorded from 1901 to 2000 was 0.1 in. in the dry season month of January 1998 at the Isley Reservoir rain gage at Isley Field (unpublished rainfall data on file at the USGS Saipan Field Office). In 1998, rainfall at some Saipan stations was less than half of normal, the lowest 12-month rainfall recorded since data collection began in 1901. The highest amount of monthly rainfall recorded for the period of record was 73.25 in. in August, 1978, when tropical storms Carmen, Winnie, and Tess passed over the island. The record high monthly rainfall was recorded at the Hakmang Communication Center on the Kagman Peninsula. Rainfall from tropical storms makes up a significant percentage of the total annual rainfall and a lack of storms may significantly contribute to drought conditions.
Rain that falls on Saipan is evaporated, consumed by plants, runs directly off the land surface into the ocean, or recharges ground water. The proportion of rainfall that recharges ground water depends on several factors, including soil type and thickness, geology, climate, vegetation, and topography. Estimates of ground-water recharge from previous studies range from about one quarter to one third of the annual rainfall (Mink, 1987). Using a water-budget accounting procedure on daily rainfall data at the Saipan airport from 1987 to 1997, about 30 percent (23 in.) of rainfall is estimated to recharge ground water on Saipan (S.B. Gingerich, USGS, written commun., 2000). Gingerich's (2002) calculation procedure is described in a hydrologic study of Tinian where the same procedure was used for 1987 to 1997 Tinian rainfall data.
Ground-water withdrawal.--Ground water is pumped and distributed by the CUC, the municipal water purveyor for the CNMI. On Saipan, about 140 municipal production wells are active continuously. Pumps typically are operated at maximum capacity 24 hours per day, except when one or more pumps are turned off for maintenance or replacement. The production wells are unequally divided into 15 well fields (fig. 8). Accurate records of groundwater production rates are sparse. In October 1998, a synoptic survey was done to meter and record production rates at all municipal wells and developed springs. A summary of the results of the survey to determine municipal groundwater withdrawal are shown in table 1. Complete results of the synoptic survey are given in Carruth (2000). Daily production at each well was determined by multiplying the instantaneous meter reading in gallons per minute by 1,440 minutes per day; this method of estimating daily withdrawal is considered reasonable over short periods of time because all production wells are operated continuously. Municipal ground-water withdrawal in October 1998 for the entire island was about 11.15 Mgal/d, and withdrawal from southern Saipan well fields accounted for about 57 percent of the total. From a review of available records at the CUC, estimated withdrawal and chlorideconcentration data for 1995–2000 are shown in figure 7. Increases in withdrawal correlate to the activation of new wells or well fields.

Figure 7. Rainfall at CPA Tower rain gage, departure from mean monthly (van der Brug, 1985) rainfall, municipal ground-water withdrawal, and chloride concentration at municipal wells, Saipan. Chloride and pumpage data from Commonwealth Utilities Corporation. Rainfall data from Commonwealth Ports Authority (CPA).
Table 1. Summary of synoptic survey to determine municipal ground-water production and mean daily volume-weighted chloride concentration at municipal well fields, Saipan, October 1998.

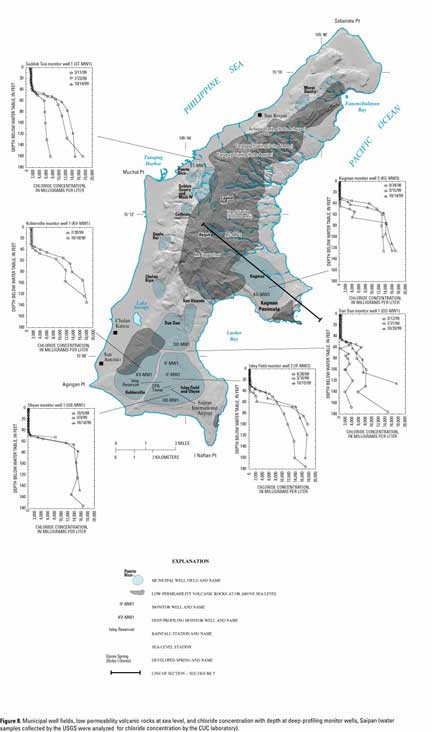
Figure 8. Municipal well fields, low-permeability volcanic rocks at sea level, and chloride concentration with depth at deep-profiling monitor wells, Saipan (water samples collected by the USGS were analyzed for chloride concentration by the CUC laboratory).
Chloride concentration in well water.--Chloride concentration is used as a quantitative measure of salinity, and a concentration of 250 mg/L (about 1.3 percent seawater chloride concentration) is the USEPA recommended limit for drinking water. A summary of mean daily volume-weighted chloride concentration at municipal well fields in October 1998 is shown in table 1. The volume-weighted average chloride concentrations account for well withdrawal rate and weights chloride concentrations measured at each well by the volume of water pumped at that well. The volume-weighted average chloride concentrations from all well fields in early October 1998 ranged from a low of 63 mg/L in the Akgak and Capital Hill well fields, to a high of 2,853 mg/L in the Maui IV well field (table 1). The volume-weighted chloride concentration of water from all well fields except Akgak and Capital Hill exceeded 250 mg/L. Chloride concentrations of water from production wells, analyzed quarterly by the CUC, are shown with estimated withdrawal data for 1995–2000 in figure 7.
Specific conductance was measured by the USGS throughout the water column in six deep-profiling monitor wells using a down-the-hole sampler. The samples were analyzed for chloride concentration by the CUC laboratory. All deep-profiling monitor wells are in freshwater-saltwater coastal aquifers; about 96 percent of municipal groundwater withdrawal is from these aquifers. Vertical chloride-concentration profiles of the deep-profiling monitor wells are shown in figure 8. Data from deep-profiling monitor wells IF-MW2, OB-MW1, and KG-MW3 indicate that the thickness of the potable part of the freshwater lens near these wells ranges from about 30 to 45 ft. At deep-profiling monitor wells DD-MW1, KV-MW1, and ST-MW1, the data show that, although there is an upper zone of fresher water about 30 to 40 ft thick, the chloride concentration exceeds that of potable freshwater. None of the production wells near KV-MW1 produce water with a chloride concentration less than 250 mg/L, and most produce water with over 1,000 mg/L chloride concentration.
The chloride concentration of water pumped at production wells depends on the position of the transition zone relative to the pump intake in the well. The transition zone will rise when the wells are pumped (fig. 9). Historically, many production wells in the coastal aquifers were completed and screened into the freshwater/saltwater transition zone or near the bottom of the freshwater layer. At new well fields in Obyan and Kagman, the CUC gave careful consideration to well depth relative to sea level, well spacing, pumping rates, and the results of a study of groundwater occurrence and estimated well yields from the Mariana Limestone (Hoffmann and others, 1998). The chloride concentration of water from the new well fields in Obyan and Kagman has remained low compared to the volumeweighted average chloride concentration of water from all municipal production wells (fig. 7).
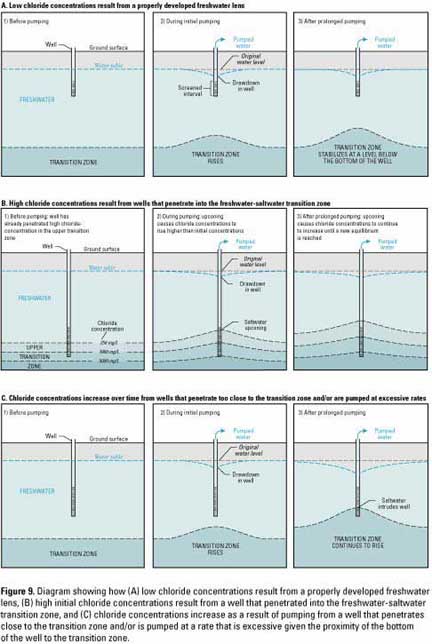
Figure 9. Diagram showing how (A) low chloride concentrations result from a properly developed freshwater lens, (B) high initial chloride concentrations result from a well that penetrated into the freshwater-saltwater transition zone, and (C) chloride concentrations increase as a result of pumping from a well that penetrates close to the transition zone and/or is pumped at a rate that is excessive given the proximity of the bottom of the well to the transition zone.
Even in properly constructed and spaced well fields, increased pumping rates and/or a thinning of the freshwater lens due to decreased recharge during periods of drought may cause the transition zone to rise to the level of the pump intakes, causing chloride concentrations in the pumped water to rise. For example, the chloride concentration of water from municipal well MQ-1 in the As Matuis area (Marpi Quarry) was about 300 mg/L at a pumping rate of 60 gal/min during a pumping test in September 1992 (unpublished pumping-test data on file at the USGS Saipan Field Office). The pumping rate was increased to 115 gal/min in an attempt to meet a higher demand for water in the area and the chloride concentration increased to 3,900 mg/L in April 1996. Additionally, during the drought associated with the 1997-98 El Niño, the volume-weighted average chloride concentration of water from all municipal production wells increased from about 850 mg/L to 1,150 mg/L (fig. 7), indicating that the transition zone rose relative to the level of the pump intakes in many production wells.
The chloride-concentration data in table 1 and figures 7 and 8 indicate that many wells on Saipan were either (1) drilled into the freshwater-saltwater transition zone below the freshwater layer, effectively preventing the production of potable water (fig. 9B), or (2) drilled close to the transition zone and operated at a pumping rate that is excessive given the proximity of the well to the transition zone, causing an eventual rise in chloride concentration (fig. 9C). For wells in the freshwater-saltwater coastal aquifers, the data presented here show that pumping-induced upcoming of the transition zone is a major constraint on well location, spacing, depth, and pumping rate.
The thickness of the freshwater lens changed at some of the monitor wells as a result of seasonal recharge, a drought, and possibly due to ground-water withdrawal. Freshwater thickness decreased by about 10 to 12 ft at wells IF-MW2 and KG-MW3 after a period of significantly less than average rainfall associated with the 1997-98 El Niño. Freshwater thickness did not change significantly at well OB-MW1 from October 1998 to October 1999, when wet-season rainfall in 1999 was closer to average.
Chloride concentrations with respect to depth in monitor wells IF-MW2 and KG-MW3 were higher after the drought associated with the 1997-98 El Niño in the Pacific (see figs. 7 and 8). The thinning of the freshwater lens results from a decrease in the amount of recharge to the aquifer relative to discharge during dry weather. In both wells, the base of potable water and the midpoint of the transition zone (9,500 mg/L chloride concentration) rose 10 ft or more between September 1998 and October 1999; a decrease of freshwater thickness of about 25 percent. Some of the freshwater thickness decrease at KG-MW3 may also be attributable to increased pumping from new production wells that were activated in September 1998 (fig. 7).
Rainfall during the 1999 wet season also was lower than normal but closer to average than the previous wet season in 1998. The depth to the base of potable water increased at KG-MW3 by about 3 ft between March and October 1999. The increase in thickness of the freshwater lens at KG-MW3 shown in figure 8 may be more indicative of the average yearly change due to wet season recharge. The thickness of the potable part of the freshwater lens did not change significantly at well OB-MW1 from October 1998 to March 1999, a period when rainfall was about 66 percent of average (fig. 8).
After a normal wet season, the thickness of the freshwater lens would be expected to increase in response to an increase in recharge. The chloride-depth profiles show no increase in freshwater thickness or only a slight increase (about 3 ft) in 1998 and 1999. Because the 1998-99 wet seasons were drier than average, the freshwater lens would not be expected to increase to the same size as it would after a wet season of more typical rainfall. The data illustrate the importance of continuing data collection in the deep monitor wells to more fully understand how wet season recharge affects the availability of fresh ground water on Saipan.
Water levels fluctuate daily as much as 0.25 ft in wells closest to the coast in response to ocean tides. Wells in the interior of the island typically do not show daily water-level fluctuations caused by ocean tides (water levels in high-level aquifers show no fluctuation). Water levels in all coastal-aquifer wells rise and fall in response to nontidal short-term and seasonal changes in sea level. Changes in the water-table elevation in the coastal aquifers caused by varying recharge are difficult to evaluate because of the dominance of water-level changes caused by sea-level variations. In contrast, water-level elevation in the high-level limestone aquifers and flow from springs that partially drain these aquifers fluctuate seasonally and are sensitive to periods of low rainfall.
The record of hourly water level in well KG-MW3 during January 1-15, 1999 shows that the water-table elevation fluctuates in response to the ocean tide (fig. 10). The semi-diurnal tidal signal from the ocean is attenuated as it travels through the aquifer and the daily fluctuation of the water table decreases with increasing distance from the ocean. The daily water-level changes in well KG-MW3, about 3,000 ft from the coast, average about 0.25 ft. Monitor wells IF-MW1 and OB-MW1, about 4,500 ft and 3,700 from the coast, respectively, show no daily waterlevel change. Attenuation of the daily tidal signal also is affected by aquifer permeability; lower aquifer permeability results in greater attenuation.
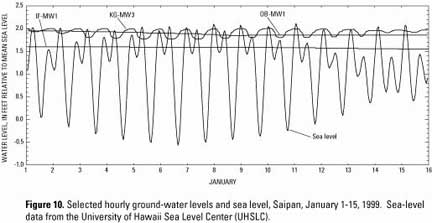
Figure 10. Selected hourly ground-water levels and sea level, Saipan, January 1-15, 1999. Sea-level data from the University of Hawaii Sea Level Center (UHSLC).
In addition to the daily fluctuation in water level caused by the ocean tides, water levels in wells in the coastal aquifers also vary over longer time periods in response to non-tidal changes in sea level (fig. 11). The sea level at the Saipan Sea Port ranged from about 0.55 ft to 2.15 ft elevation (relative to mean sea level) from 1998 through 2000. During the period of tide gage record that corresponds to the well records, water levels in the coastal-aquifer wells ranged from about 1.45 ft to 2.55 ft elevation (fig. 11).
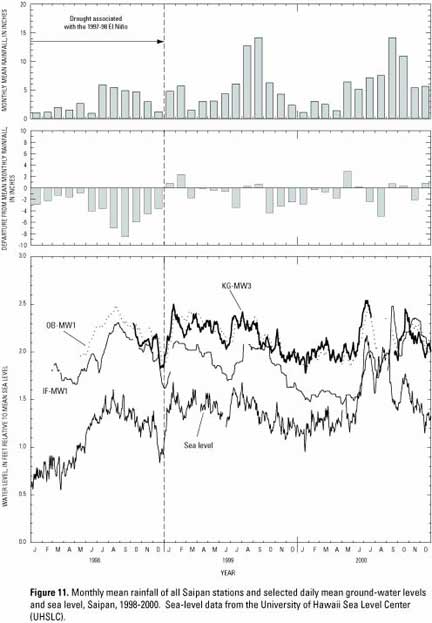
Figure 11. Monthly mean rainfall of all Saipan stations and selected daily mean ground-water levels and sea level, Saipan, 1998-2000. Sea-level data from the University of Hawaii Sea Level Center (UHSLC).
The difficulty in determining the effects of recharge and withdrawal on the water table in the coastal aquifers is illustrated in figure 11. For example, the rise in water level of nearly 0.6 ft in IF-MW1 and OB-MW1 from May to September 1998 corresponds to a similar change in sea level and masks the decline in recharge during the period of lower than average rainfall. All of the fluctuations in water level in the monitored wells in the coastal aquifers appear to be directly in response to changes in sea level.
Water level and springflow in the high-level limestone aquifers in the central uplands are not sensitive to sea level; however, water-level in the high-level limestone aquifers and flow from springs fluctuate seasonally and are sensitive to periods of low rainfall (fig. 12). The dry weather associated with the 1997-98 El Niño (as well as 1983 and 1987 El Niño events) affected the water level in the high-level limestone aquifers. From January 1998 to March 1999 the water level at monitor well AG-MW1 decreased from 407 ft to 378 ft (fig. 12). The water-level elevation at AG-MW1 decreased to 376 ft during the 1983 El Niño.
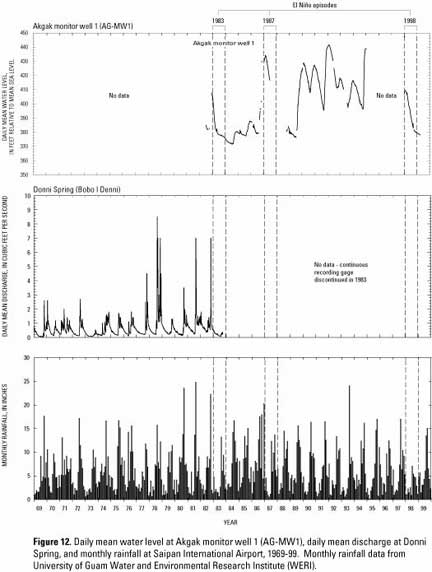
Figure 12. Daily mean water level at Akgak monitor well 1 (AG-MW1), daily mean discharge at Donni Spring, and monthly rainfall at Saipan International Airport, 1969-99. Monthly rainfall data from University of Guam Water and Environmental Research Institute (WERI).
Many high-level springs and seeps are found in the central uplands of Saipan, but most have a low discharge (about 5 to 10 gal/min) and may not flow during the dry season. H.T. Stearns (U.S. Geological Survey, written commun., 1944), estimated that the total flow of high-level springs in the dry season is 250,000 gal/d, and about 1,000,000 gal/d in the wet season. Springflow at Donni Spring, the largest of the developed high-level springs, fluctuates seasonally from less than 1 ft3/s in the dry season, to over 7 ft3/s in some wet seasons (fig. 12) (1 ft3/s is equal to about 450 gal/min). Flows of 2 to over 8 ft3/s at Donni Spring are short duration and follow periods of heavy rainfall. The continuous-recording gage at Donni Spring was discontinued in 1983.
The water table is highest in low-permeability volcanic rocks that are above sea level, primarily in the central part of the island. The water table is relatively flat beneath the limestone plateau areas where high-permeability limestones extend below sea level. Ground water flows from the central uplands, where the water-table elevation is highest, towards the coast, where the water-table elevation is lowest. Depressions in the water table due to groundwater withdrawal can cause ground-water flow patterns to change in the vicinity of production wells; water-level data indicate this may be happening at the Isley Field well field.
The water-table contours define the elevation of the top of the water table relative to sea level; all rock below the water table is fully saturated (fig. 13). Areas of significant mounding (from 30 to over 600 ft) occur in the northcentral part of the island where low-permeability volcanic rocks extend above sea level. The relatively flat watertable surface (from 0.5 to 3 ft) occurs in areas where high-permeability limestones extend below sea level. Areas underlain by rocks of moderate to low permeability, such as impure limestone mixed with sediments of weathered volcanic material, have water levels from three to several tens of feet elevation.
Measured water levels in the central uplands, where low-permeability volcanic rocks occur above sea level, range from about 30 ft to over 600 ft. The highest measured water levels are about 605 ft at Unnamed Seep 1, and 580 ft about half a mile to the south at exploratory well TH-17. Figure 13 illustrates the steepness of the water table in the central uplands, in effect defining the area where low-permeability volcanic rocks are above sea level.
In the limestone coastal aquifers, the water table is no more than a few feet above sea level, and the slope of the water table is nearly flat (fig. 13). The water-table map reflects pumping conditions in the coastal aquifers because withdrawal from the production wells had been steady during the preceding months. Depressions in the vicinity of the Isley Field and Kagman well fields indicate that ground-water withdrawal is causing ground-water flow patterns to change near some production wells (see fig. 13). Drawdown from pumping diverts some of the oceanward ground-water flow to wells. To what degree the water-table configuration represents the long-term average configuration is not known.
Preparation of the water-table contour map.--Available recent and historic water-level data were integrated to prepare the water-table map. As stated previously, water levels in the coastal aquifers can fluctuate in response to the ocean tide and other changes in sea level. Thus, water levels in the coastal-aquifer system primarily are based on an average of at least 1 year of monthly water-level measurements at 14 monitor wells (fig. 13 and table 2). Pumping water levels at municipal production wells and water levels at wells with questionable measuring-point elevations were not used in the preparation of the water-table elevation map. Water-level elevations in the developed high-level limestone aquifer beneath the Akgak well field are based on an average of several years of monthly measurements at AG-MW1 and on static water-level measurements at nearby production wells (fig. 13 and table 2). Additional waterlevel elevations in the central uplands are based on the discharge elevations of high-level springs and seeps, depths to water measured at exploratory wells completed in volcanic rock, and on water levels from other wells in high-level limestone aquifers, such as wells in the Capital Hill well field.
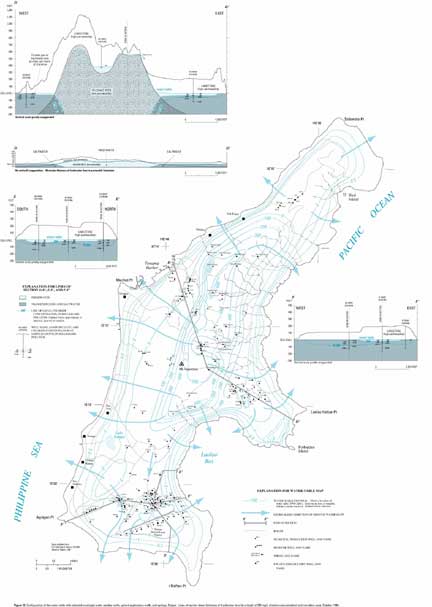
Figure 13. Configuration of the water table with selected municipal wells, monitor wells, upland exploratory wells, and springs, Saipan. Lines of section show thickness of freshwater lens (to a depth of 250 mg/L chloride concentration) and transition zone, October 1999.
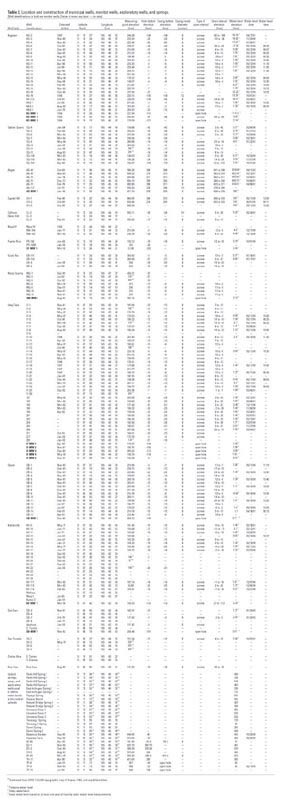
Table 2. Location and construction of municipal wells, monitor wells, exploratory wells, and springs.
Depth to water in each well was measured and subtracted from each well's measuring-point elevation to obtain the height of water above mean sea level. The measuring-point elevations are referenced to mean sea-level datum benchmarks around the island established in 1968 by the USGS (unpublished USGS data on file at the Saipan Field Office). At all monitor wells and municipal production wells used for preparation of the water-table map, measuringpoint elevations were surveyed either by the USGS using turning-point leveling to an accuracy of about 0.02 ft, or by a private land-surveying contractor to the CUC. At some of the upland exploratory wells (fig. 13) used to collect water-level data in the volcanic rocks, measuring-point elevations were estimated from the USGS 1:25,000 topographic map of Saipan.
Discharge elevations of the developed springs (Donni Spring, Tanapag I and II Springs, and Achugao Spring) were surveyed by a private land-surveying contractor for the CUC. Because of the remoteness of the undeveloped springs and seeps (fig. 13), discharge elevations used were from H.T. Stearns (U.S. Geological Survey, written commun., 1944) or estimated from the USGS topographic map.
Vertical sections through central and southern Saipan show that the freshwater lens is thicker towards the interior of the island and thins considerably toward the coasts. The freshwater lens thins in the vicinity of the Isley Field well field possibly because of saltwater upconing due to ground-water withdrawal. The potable part of the freshwater lens pinches out before reaching the coast probably because of a combination of inland ground-water withdrawal and tide-induced mixing in high permeability limestone and coastal sediments. Between the area where the potable part of the freshwater lens pinches out and the coastline, brackish water occurs immediately below the water table.
In general, for a given recharge, the presence of low permeability rock results in high water levels and a thick freshwater lens. Conversely, for a given recharge, the presence of high permeability rocks results in low water levels and a thin freshwater lens.
Vertical sections.--The thickness of the potable part of the freshwater lens beneath Saipan is shown in vertical sections in figure 13 (D-D', E-E', and F-F'). Each deep-profiling monitor well shown in the vertical sections was sampled at about 6-ft depth intervals starting at the water table using a 3-ft long bailer lowered to the desired depth in the well. Field measurements included temperature and specific conductance, and chloride concentration was determined by the CUC laboratory using titration. The chloride concentration of the samples is considered to represent the chloride concentration in the aquifer at the elevation and date the sample was collected in the well. The vertical sections are based on samples collected from ST-MW1, KG-MW3, OB-MW1, IF-MW2, DD-MW1, KVMW1, and IF-MW4 on October 14-20, 1999.
Section D-D'.--Section D-D' shows that the freshwater lens in October 1999 was thick in the north-central part of the island, reaching elevations of 550 ft above mean sea level in low-permeability volcanic rocks. The depth of the freshwater lens below sea level in the low-permeability volcanic rocks has not been measured; however, where ground-water flow is downward, the freshwater lens likely is thinner than predicted by the Ghyben-Herzberg principle. The potable part of the freshwater lens thins considerably in limestones towards the Kagman Peninsula and the east coast, as well as towards the west coast. At well KG-MW3, the potable part of the freshwater lens was about 32 ft thick on October 14, 1999. Towards the west coast part of section D-D', the freshwater lens pinches out before reaching well ST-MW1, probably as a result of extensive tide-induced mixing in the high permeability limestone in the vicinity of the well. Additionally, section D-D' shows that fresh ground water occurs in limestones that overlie the lower-permeability volcanic basement rocks above sea level. Average saturated thickness of the high-level limestone aquifer developed at the Akgak well field is about 100 ft, with a seasonal variation of as much as 50 ft.
Section E-E'.--Section E-E' shows that the freshwater lens is thickest in the southern region near OB-MW1, and pinches out before reaching the coasts to the northeast and to the south. The maximum thickness of the freshwater lens on October 18, 1999 was about 45 ft in section E-E', measured at well OB-MW1. The lens was thinner in the vicinity of IF-MW2 (about 30 ft thick on October 15, 1999) possibly because of saltwater upconing from groundwater withdrawal at the Isley Field well field. The Isley Field well field is the largest well field on the island, withdrawing about 2.5 Mgal/d from 35 wells. Brackish water at the surface at DD-MW1 indicates that the potable part of the freshwater lens pinches out some distance before reaching the coast in the north part of section E-E'.
Section F-F'.--Section F-F', drawn from the west through the Koblerville well field and to the east through the Isley Field well field, shows that the freshwater lens is thin (about 30 ft on October 15, 1999) at well IF-MW2, and limited in the horizontal extent to the area beneath the 200-ft elevation limestone plateau in the vicinity of the Isley Field well field. At well KV-MW1, brackish water exists at the water table, indicating that the freshwater is extensively mixed with saltwater. Ground-water withdrawal at the Koblerville, Isley Field, and Obyan well fields (about 5.57 Mgal/d from 68 wells) probably caused brackish water to intrude upward and landward into parts of the aquifer that formerly contained freshwater.
Small island freshwater lens at true scale.--Section D-D' shown in figure 13 is drawn with the vertical scale greatly exaggerated. If the section is drawn with no vertical exaggeration, the extreme thinness of the freshwater lens on a small island is more evident as is the difficulty of withdrawing freshwater without causing saltwater upconing.
Well-construction details of 140 municipal production wells, 14 monitor wells, and 8 central upland exploratory wells that were drilled, operated, or monitored during 1945 to 2000, are shown in table 2. The wells are divided into 15 well fields, defined by the general location on the island. About 60 percent of the production wells are in six well fields in the southern region of the island, primarily at the Isley Field, Obyan, and Koblerville well fields (fig. 8). Another eight well fields in the central part of the island make up 35 percent of the municipal production wells, and four production wells are in northern Saipan.
Monitor wells are located within the major well fields; most are drilled into the top of the freshwater lens except wells ST-MW1, KG-MW3, DD-MW1, KV-MW1, IF-MW2, and OB-MW1 which were drilled into the transition zone. These transition-zone (deep-profiling) monitor wells are important because they provide information about the temporal changes in thickness of the freshwater lens and underlying transition zone as a result of variations in rainfall and ground water withdrawal.
Exploratory wells from which water levels in the volcanic rocks were obtained are shown in table 2. Table 2 also shows the discharge elevations of high-level springs and seeps used to further define water-level elevations in the central uplands. The water levels reported in the table are the same as those used for the water-table configuration (fig. 13), with the exception that pumping water levels were not used.
This report presents findings of an ongoing study of the occurrence, movement, and availability of ground-water resources of Saipan, Commonwealth of the Northern Mariana Islands. The cooperative efforts between the USGS and the CUC have led to a better understanding of how fresh ground-water occurs and moves within the limestones and volcanic rocks that make up the island.
Land use, geography, and geology.--Population centers of Saipan are primarily on and adjacent to the western coastal plain and the plateau areas at the southern end of the island and the Kagman Peninsula. Land uses include hotel resorts, golf courses, garment manufacturing, small businesses, agriculture, and residential activities. The surface terrain of Saipan is dominated by a succession of nearly horizontal limestone platforms and terraces, separated by steep scarps, that ascend from the sea towards central uplands in the northern three fourths of the island. Saipan is a subareal peak on the Mariana island arc and consists of a volcanic core overlain by younger limestones. Limestones and calcareous deposits dominate the surface lithology, comprising about 90 percent of the surface exposures. Volcanic rocks are exposed over the remaining 10 percent of the land surface.
Ground-water resource.--On Saipan, the position of the volcanic basement rocks relative to sea level and the overlying limestones affects the occurrence of ground water. Most of the available fresh ground water in Saipan is in a freshwater-saltwater coastal-aquifer system. A smaller amount of recoverable fresh ground water occurs in limestones that have a base above sea level on volcanic basement rocks. The primary aquifers on Saipan are composed of fragmental limestones that locally contain sedimentary facies of reworked volcanic materials.
Rainfall, ground-water withdrawal, and chloride concentrations in well water.--Saipan receives about 80 in. of rainfall annually and has distinct wet and dry seasons. All fresh ground water on Saipan originates as rainfall. About 11 Mgal/d is withdrawn from 140 continuously operated municipal wells located primarily in the southern, eastcentral, and central regions of Saipan. Most production comes from well fields in southern Saipan, accounting for about 6.4 Mgal/d. The mean daily volume-weighted chloride concentration of pumped water from municipal well fields ranges from less than 100 mg/L in the Akgak and Capital Hill well fields to over 2,000 mg/L in the Maui IV and Puerto Rico, and Marpi Quarry well fields.
Changes in thickness of the freshwater lens.--The thickness of the freshwater lens changed at some of the monitor wells as a result of seasonal recharge, a drought, and possibly due to ground-water withdrawal. Freshwater thickness decreased by about 10 to 12 ft at wells IF-MW2 and KG- MW3 after a period of less than average rainfall in 1998 due to the El Niño weather phenomenon. Freshwater thickness did not change significantly at well OB-MW1 from October 1998 to October 1999, when rainfall was 66 percent of the average rainfall.
Water-level and springflow records.--Changes in the water-table elevation in the coastal aquifers caused by varying recharge are difficult to evaluate because of the dominance of water-level changes caused by sea-level variations. In contrast, water-level elevation in the high-level limestone aquifers and flow from springs that partially drain these aquifers fluctuate seasonally and are sensitive to periods of low rainfall. Water levels fluctuate daily in wells closest to the coast in response to ocean tides. Wells in the interior of the island typically do not show daily water-level fluctuations due to ocean tides. Water levels in all coastal-aquifer wells rise and fall in response to non-tidal shortterm and seasonal changes in sea level.
Water-table configuration and directions of ground-water flow.--The water table reaches its highest points in lowpermeability volcanic rocks that are above sea level, primarily in the central area of the island. The water table is relatively flat beneath the plateau areas where high-permeability limestones extend below sea level. Ground water flows from the central highlands, where the water-table elevation is highest, towards the coast, where the water-table elevation is lowest.
Thickness and seaward boundary of the freshwater lens.--The freshwater lens is thick in the interior of the island and thins considerably toward the coasts. The potable part of the freshwater lens ranges from hundreds of feet thick in low-permeability volcanic rocks in the north-central area of the island, to about 30 to 45 ft thick in limestones in the coastal aquifers. The potable part of the freshwater lens pinches out before reaching the coast probably because of a combination of inland ground-water withdrawal and tide-induced mixing in high-permeability limestones and coastal sediments.
Limitations to ground-water availability.--Data from monitor wells and analysis of records of pumpage, water quality, and water levels indicate that the main factors limiting potable ground-water availability on Saipan are saltwater intrusion, lowering of water levels, and the reduction of discharge to the ocean and to the developed highlevel springs.
When water is withdrawn from a freshwater lens, the freshwater lens shrinks and brackish water or saltwater will intrude upward and landward into parts of the aquifer that formerly contained freshwater. The degree of saltwater intrusion depends on several factors, including the hydraulic properties of the rocks, recharge rate, pumping rate, and well location. The effect of intrusion on a particular well depends on the vertical and horizontal distance between the well and the transition zone. The constraints imposed by saltwater intrusion can be minimized by (1) locating wells where the potable part of the freshwater lens is thicker, (2) ensuring that wells do not penetrate to depths near the transition zone, and (3) determining pumping rates that can be maintained without causing the intrusion of saltwater into the well.
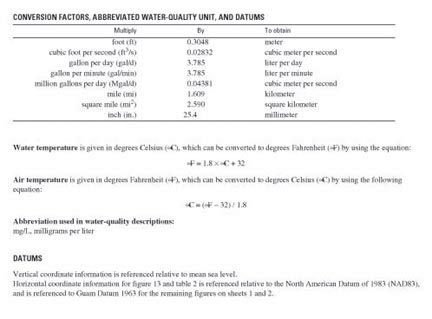
Conversion factors.
Carruth, R.L., 2000, Summary of hydrologic data for 1998, Saipan, Commonwealth of the Northern Mariana Islands: U.S. Geological Survey Open-File Report 00-301, 39 p.
Cloud, P.E., Schmidt, R.G., and Burke, H.W., 1956, Geology of Saipan Mariana Islands, Part 1. General Geology: U.S. Geological Survey Professional Paper 280-A, 126 p.
Gingerich, S.B., 2002, Geohydrology and numerical simulation of alternative pumping distributions and the effects of drought on the ground-water flow system of Tinian, Commonwealth of the Northern Mariana Islands: U.S. Geological Survey Water-Resources Investigations Report 02-4077, 46 p.
Hoffmann, J.P., Carruth, R.L., and Meyer, William, 1998, Geology, ground-water occurrence, and estimated well yields from the Mariana Limestone, Kagman area, Saipan, Commonwealth of the Northern Mariana Islands: U.S. Geological Survey Water-Resources Investigations Report 98-4077, 38 p.
Meijer, A., Reagan, M., Ellis, H., Shafiqullah, M., Sutter, J., Damon, P., and Kling, S., 1983, Chronology of volcanic events in the eastern Philippine Sea in Hayes, D. E. (ed.), The tectonic and geologic evolution of southeast Asian seas and islands: Part 2: Geophysical Monograph 27, American Geophysical Union, p. 349-359.
Mink, J.F., 1987, Hydrological characterization of the ground-water resources, island of Saipan: Report to the Division of Environmental Quality, Department of Public Health and Environmental Services, Commonwealth of the Northern Mariana Islands, 59 p. Thurman, H.V., 1990, Essentials of oceanography, 3rd Edition: Columbus, Ohio, Merrill Publishing Company, 398 p.
Todd, D.K, 1980, Groundwater Hydrology: New York, Wiley, 535 p. U.S. Census Bureau, 2001, 2000 census of population and housing, Commonwealth of the Northern Mariana Islands: 248 p.
U.S. Environmental Protection Agency, 1991, Secondary maximum contaminant levels (section 143.3 of part 143, National secondary drinking water regulations): U.S. Code of Federal Regulations, Title 40, Parts 100 to 149, revised through July 1, 1991.
Van der Brug, Otto, 1985, Compilation of water resources development and hydrologic data of Saipan, Mariana Islands: U.S. Geological Survey Water-Resources Investigations Report 84-4121, 578 p.
Wong, M.F., and Hill, B.R., 2000, Reconnaissance of hydrology and water quality of Lake Susupe, Saipan, Commonwealth of the Northern Mariana Islands, 1990: U.S. Geological Survey Water-Resources Investigations Report 00-4054, 32 p.
View a PDF version (not accessible) [11,375,730 Kb] of this reportCitation: Carruth, R.L., 2003, Ground-Water Resources of Saipan, Commonwealth of the Northern Mariana Islands: U.S. Geological Survey Water-Resources Investigations Report 03-4178, 3 Plates.
| AccessibilityFOIAPrivacyPolicies and Notices | |
 |
|