
|
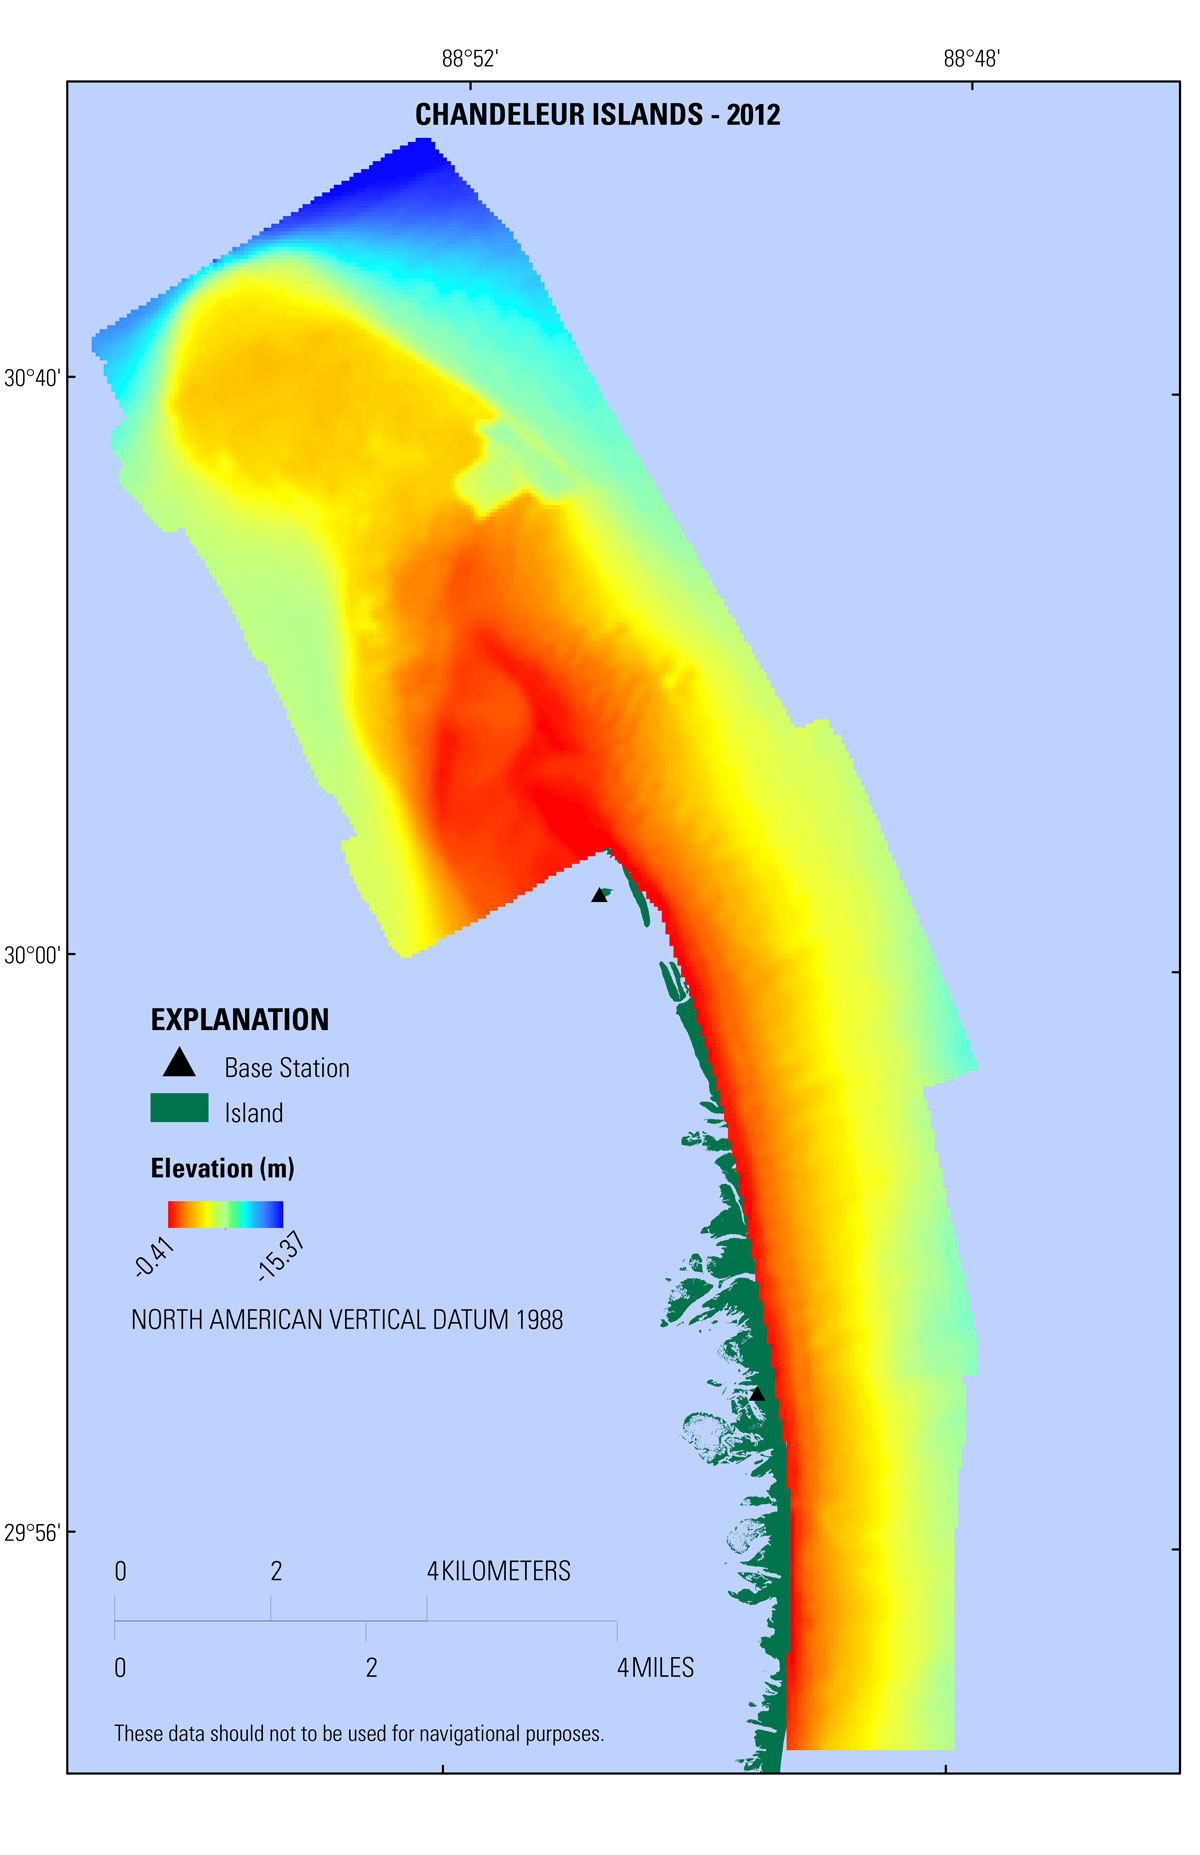
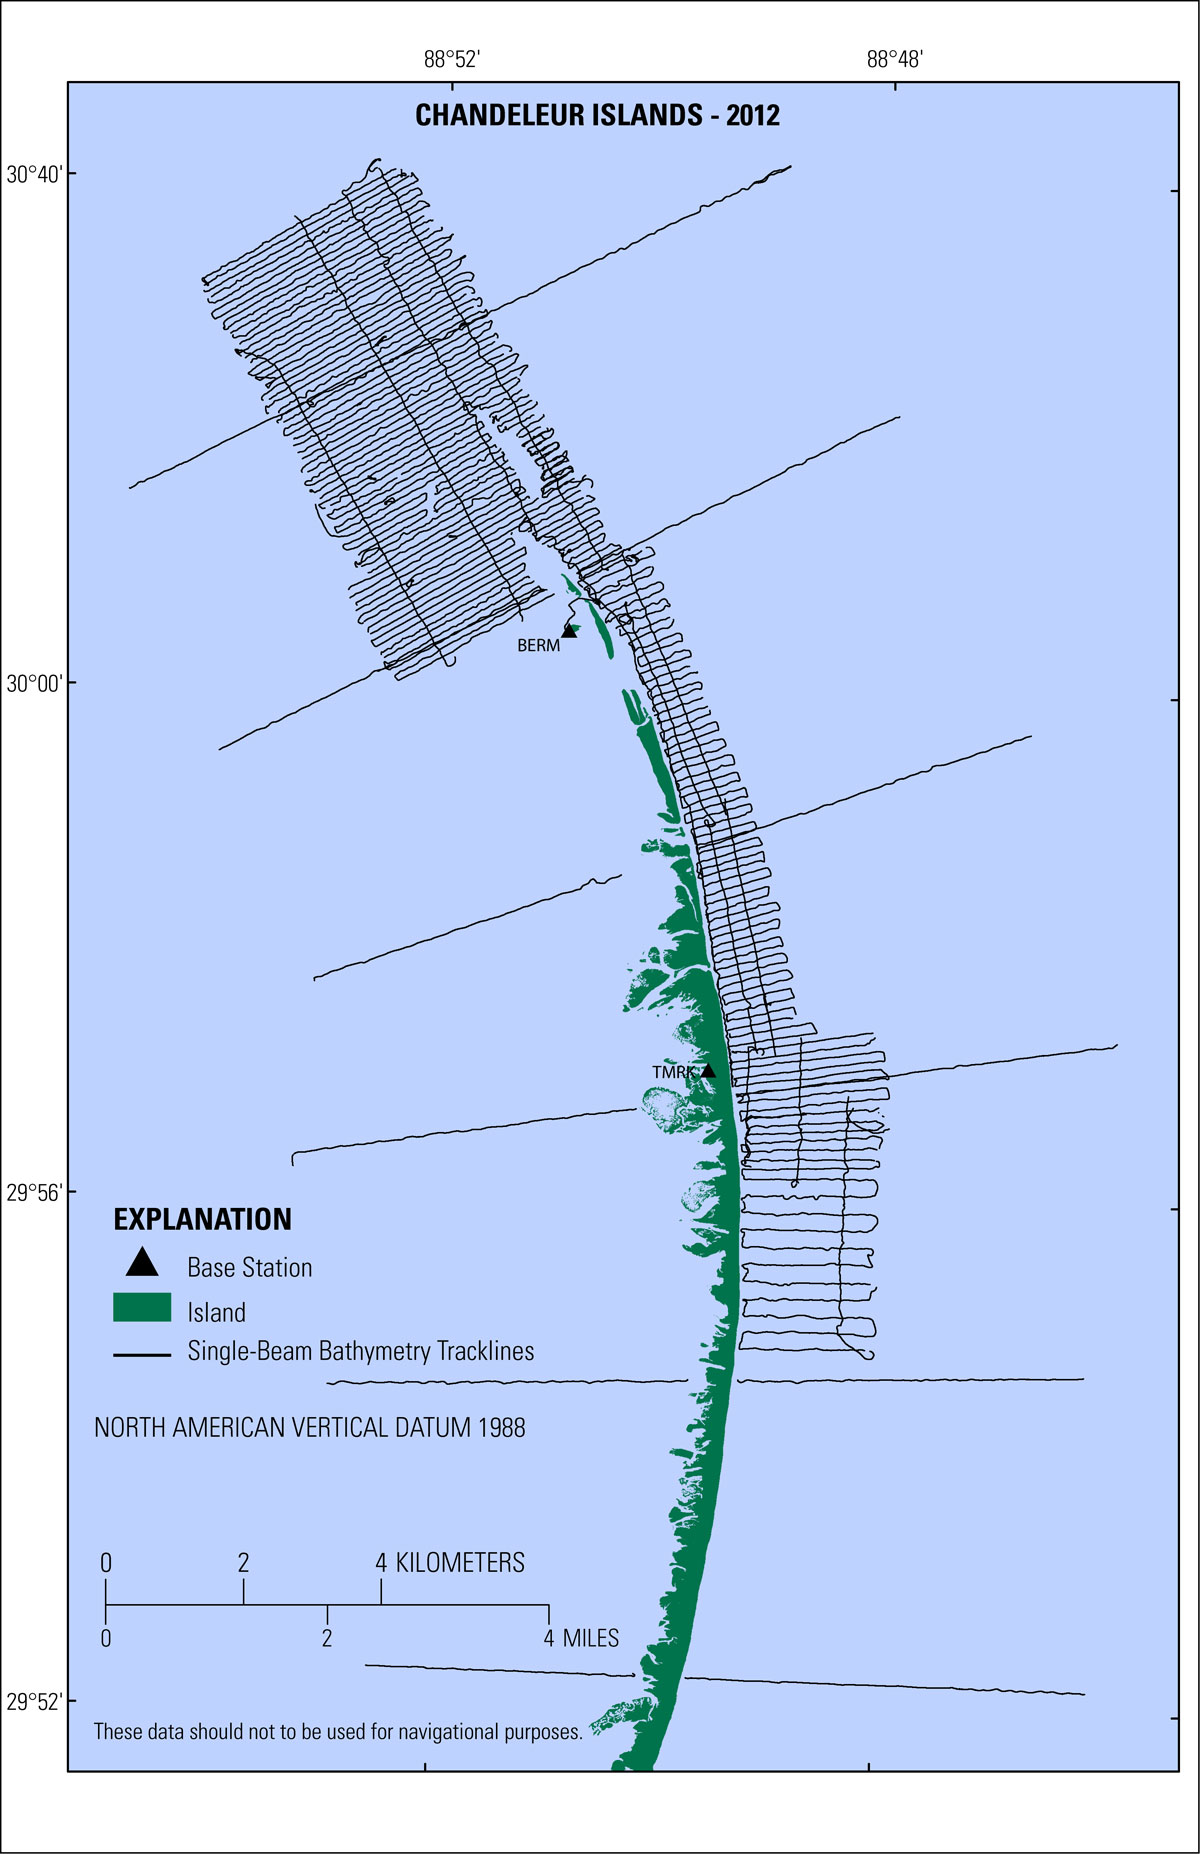
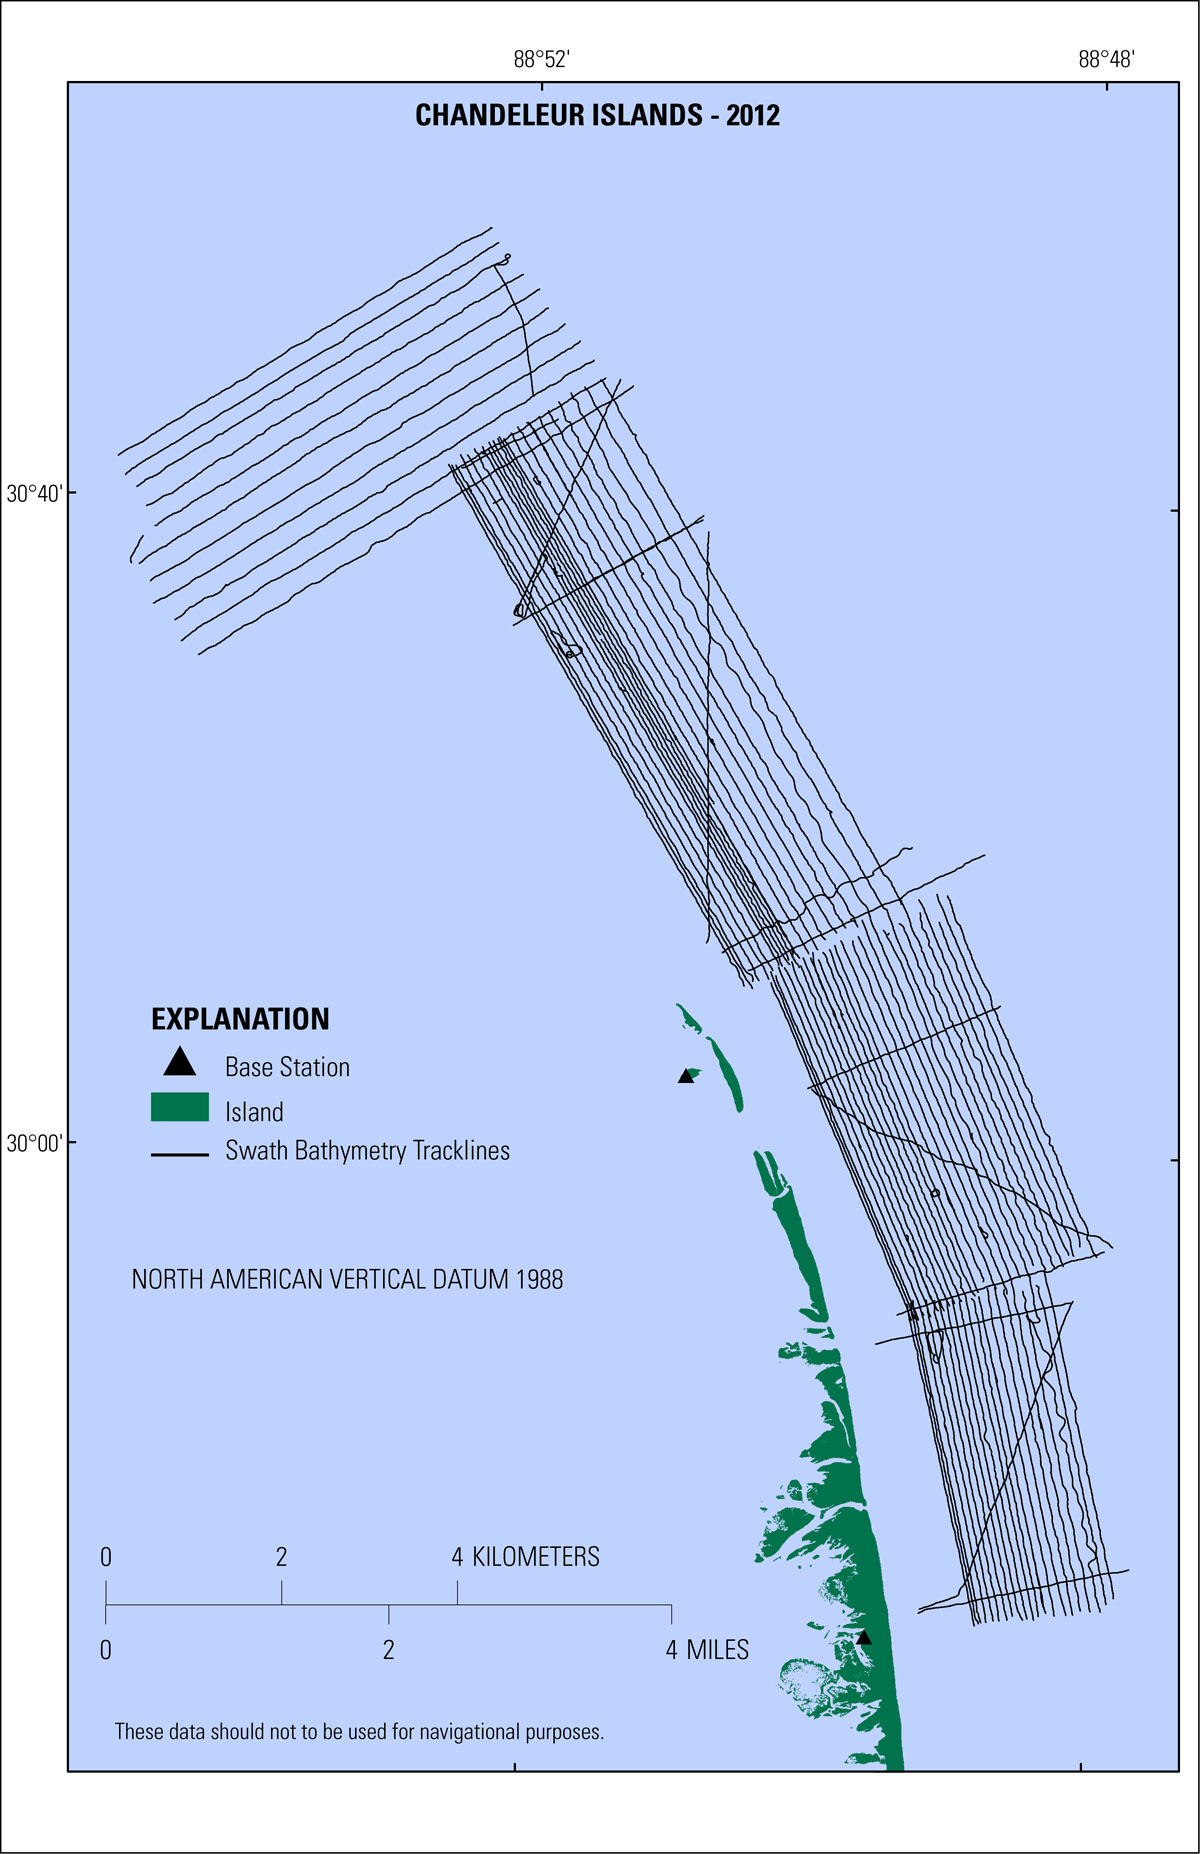
Data ProcessingSingle-Beam BathymetryNavigationThe coordinate values for each of the GPS base stations (TMRK and BERM) are the time-weighted average of values obtained from the National Geodetic Survey's (NGS) On-Line Positioning User Service (OPUS). The base station coordinates were imported into GrafNav version 8.3 (Waypoint Product Group) and the kinematic GPS data from the survey vessel were post-processed to the concurrent GPS data from the base stations. During processing, steps were taken to ensure that the trajectories between the base and rover were clean, resulting in fixed positions. By analyzing the graphs, trajectory maps, and processing logs that GrafNav produces for each GPS session, GPS data from satellites flagged by the program as having poor health or satellite time segments that had cycle slips could be excluded, or the satellite elevation mask angle could be adjusted to improve the position solutions. The final, differentially- corrected, precise DGPS positions were computed at 1-second (s) intervals for each roving GPS session, and then exported in ASCII text format, which replaced the uncorrected real-time rover positions recorded during acquisition. The GPS data were processed and exported in the World Geodetic System of 1984 (WGS84) (G1150) geodetic datum. Soundings and Motion The raw HYPACK v10.0.5.31 data files were imported into CARIS HIPS and SIPS (Hydrographic Information Processing System and Sonar Information Processing System) version 7.1. The corrected DGPS positions exported from GrafNav were imported into CARIS using the generic data parser tool within CARIS, and any SVP profile casts were entered and edited with the SVP editor within CARIS. The bathymetric data components-position, motion, depth, and SOS-were then merged and geometrically corrected in CARIS to produce processed x,y,z data. Next, the data were edited for outliers and further reviewed in the Subset Editor utility for crossing status and questionable data points or areas. The geometrically-corrected point data were then exported as an x,y,z ASCII text file referenced to WGS84 (G1150), equivalent to ITRF00, and ellipsoid height in meters. The single-beam dataset consists of 1,756,202 x,y,z data points with an ellipsoidal elevation range of -28.062 m to -41.183 m, a mean of -31.976 m, and a standard deviation of 2.41 m. Using the National Oceanic and Atmospheric Association (NOAA) transformation software, VDatum version 3.2, the data were converted horizontally and vertically into the North American Datum of 1983 (NAD83)(CORS96) and the North American Vertical Datum 1988 (NAVD88) (orthometric height) using the NGS geoid model of 2009 (GEOID09). The transformed point data were imported into Esri ArcGIS version 10.0.5 as a shapefile and ultimately merged with the swath bathymetric point data for gridding purposes, as described later. Interferometric Swath Bathymetry and BackscatterNavigation and MotionPosition data recorded by the Coda-Octopus F190R IMU system were corrected in real-time with the OmniSTAR HP differential navigation service. The IMU also applied real-time motion corrections for heave, roll, and pitch to the vertical component of each position fix. The corrected positions were integrated with the observed bathymetric values to calculate a final position and ellipsoid height representing the elevation of the seafloor with respect to the geodetic reference frame ITRF2005 (ITRF05) across the swath range. Soundings and BackscatterThe Systems Engineering and Assessment Ltd., program SWATHplus serves as acquisition software and initial processing software. Preliminary roll calibration data were collected and processed using SWATHplus and Grid Processor software versions 3.7.17. Instrument offset and calibration values were then input into the session file (.sxs). The raw data files (.sxr) were processed using the updated system configuration file that contained the roll calibration values, measured equipment offsets, acquisition parameters, navigation parameters, SOS at sonar head, and the SVP cast data. Any acoustic filtering applied in SWATHplus was also written to the processed data file (.sxp). The initial datum for the swath and backscatter data was ITRF05, which is the real-time acquisition datum of OmniSTAR HP position and navigation data. All processed data files (.sxp) were imported into CARIS HIPS and SIPS version 7.1, and the original sounding data were edited for outliers using the program's depth filters and reference surfaces. Remaining outliers were then deleted manually. A CARIS BASE (Bathymetry with Associated Statistical Error) surface with associated CUBE (Combined Uncertainty and Bathymetry Estimator) sample surface was created from the edited soundings dataset. A BASE hypothesis is the estimated value of a grid node representing all the soundings within a chosen resolution or grid-cell size (for example, 5 m) weighted by uncertainty and proximity, giving the final value as a "sample" of the data within the specific grid cell. This algorithm allows multiple grid-node hypotheses to be verified or overridden by the user while maximizing processing efficiency. A 5-m resolution CUBE surface was created to perform initial hypothesis editing with the CARIS Subset Editor tool, followed by higher resolution surface detail editing within the subset editor. The sample x,y,z data were exported as ASCII text at a 5-m by 5-m sample resolution in the ellipsoid datum of ITRF05. The data were then transformed horizontally into NAD83 and vertically into NAVD88 referenced to GEOID09 with NOAA's VDatum software conversion tool version 3.2. For acoustic backscatter analysis, the same raw data files (.sxr) were imported into SonarWiz5 version 5.06, and bottom tracking was applied to define the first returns from the seafloor through the water column directly below the swath transducers. Once the seafloor was defined, sonar beam angle correction was applied to remove the water column from the data and minimize target shadows. A comprehensive backscatter mosaic was created from the individual swath lines and adjusted for contrast and brightness. The final mosaic was exported in GeoTIFF format and imported into the ArcGIS project, where the histogram was adjusted to enhance the display of seafloor surface material.
|
Note: Any use of trade names is for descriptive purposes only and does not imply endorsement by the U.S. Government.
