
Survey Products
The figures below are representations of the survey tracklines (figs. 3 and 5), DEM map product (fig. 6), and DEM grid error (fig. 7). The data files are available for download from the Data Downloads page.
TRACKLINES |
BATHYMETRY |
|
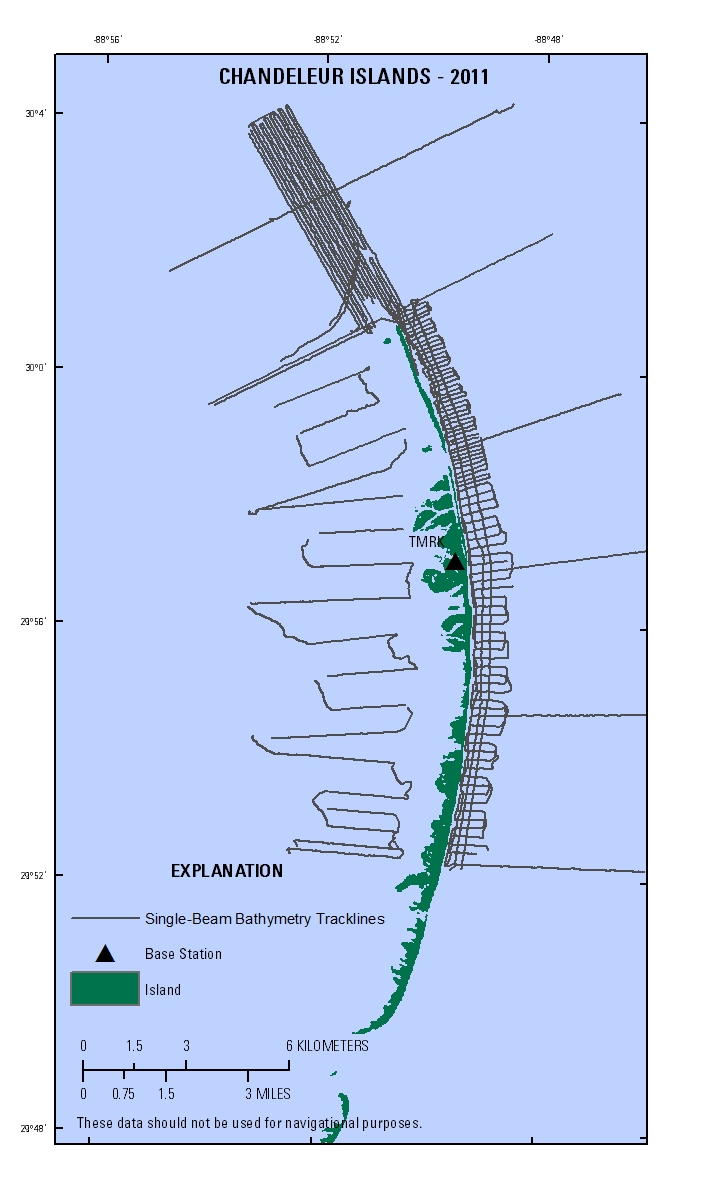
Figure 3. Single-beam bathymetry tracklines for Chandeleur Islands survey in 2011. [Click to enlarge] |
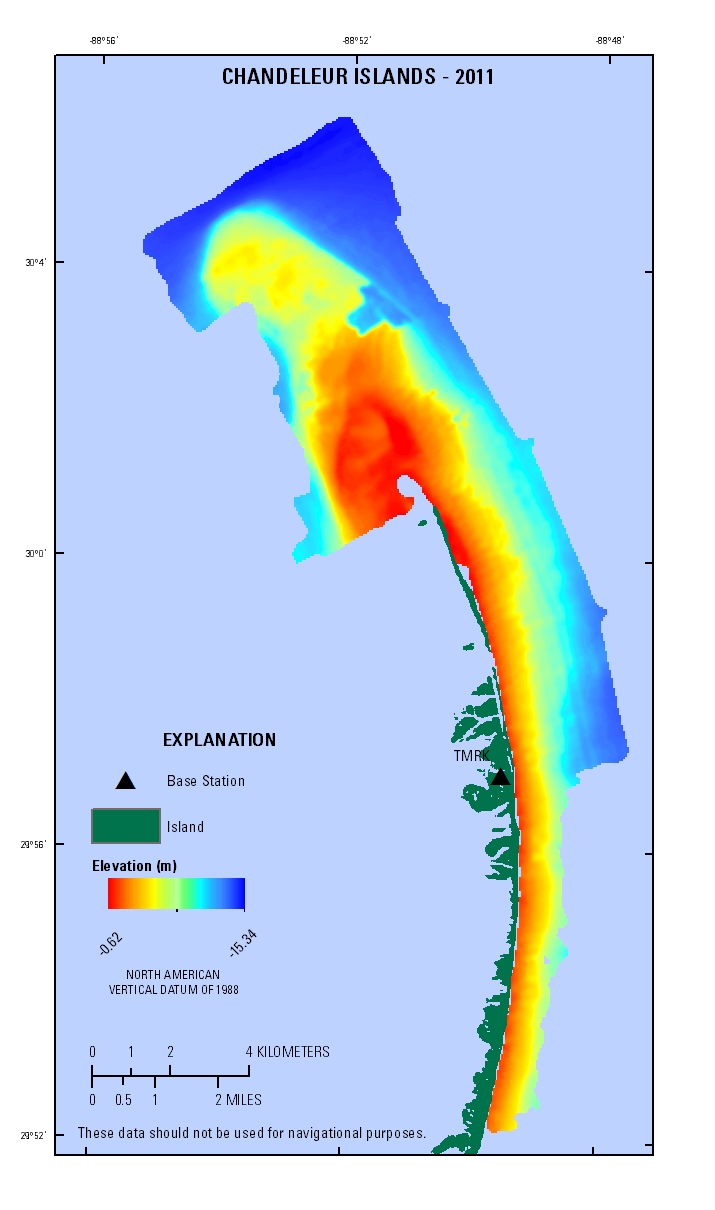
Figure 6. A 50-meter grid of 2011 bathymetry surrounding the Chandeleur Islands, Louisiana. [Click to enlarge] |
|
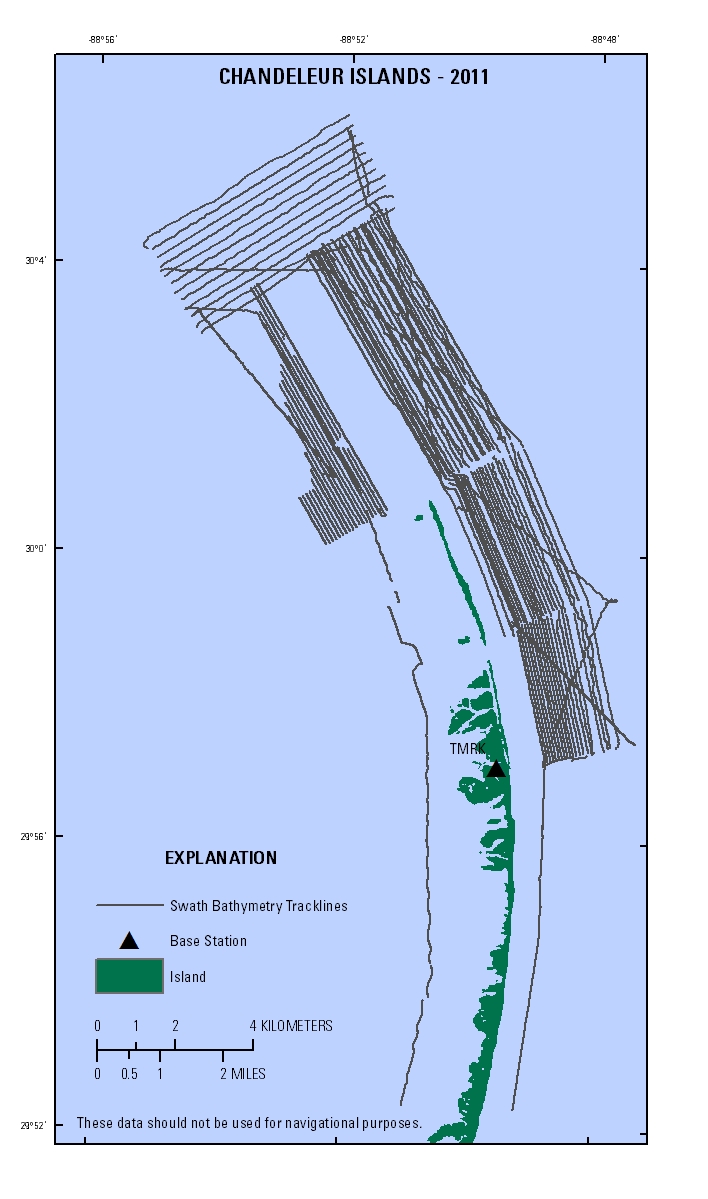
Figure 5. Swath bathymetry tracklines for Chandeleur Islands survey in 2011. [Click to enlarge] |
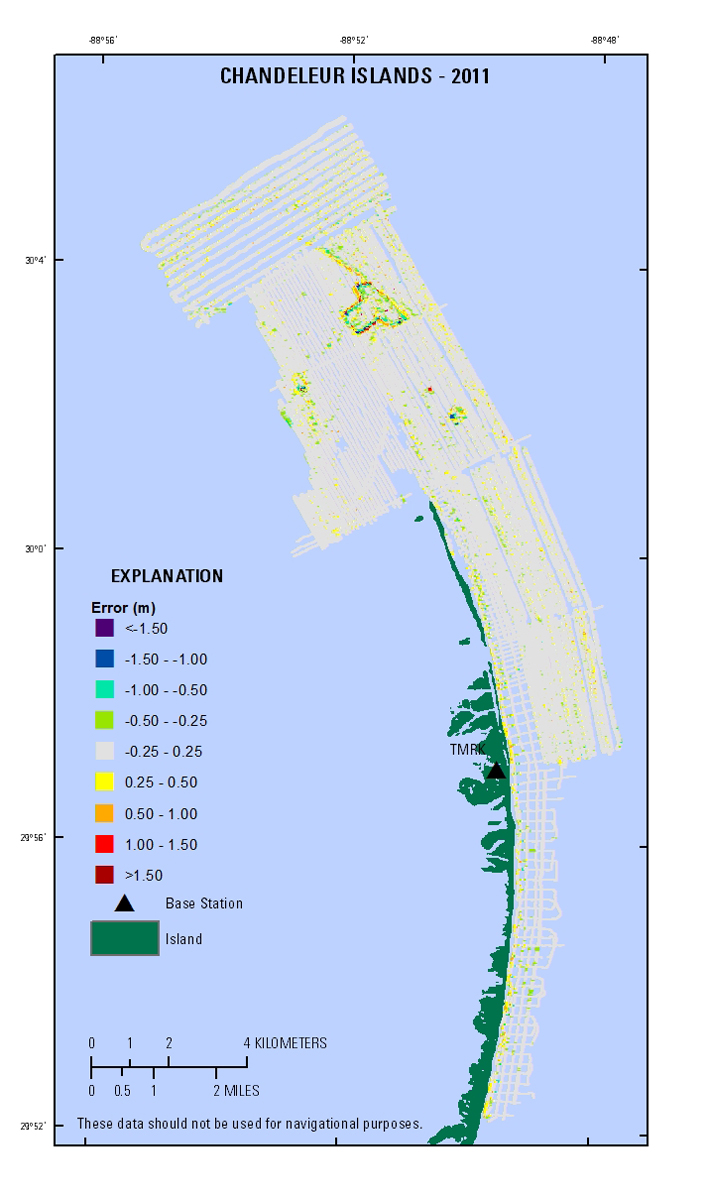 Figure 7. Error values representing the difference between the bathymetry grid (DEM) at each sample point (positive values – grid is deeper than soundings; negative values – grid is shallower than soundings). White or gray symbols represent error of +/- 0.25 centimeters. [Click to enlarge] |
