
Field Data Collection
From March 22 to 26, 2012, SPCMSC scientists collected sediment samples from the berm and adjacent island and back-barrier environments (USGS Field Activity Number (FAN) 12BIM01). Several sampling methods were used, including surface and subaqueous grab samples and short push cores (fig. 3A). On September 7, 2012, following the landfall of Hurricane Isaac west of the Mississippi River on August 28, SPCMSC scientists assisting with a post-storm lidar elevation survey of the Chandeleur Islands collected surface grab samples along a single transect across the berm and island (FAN 12LGC02; fig. 3B) and reoccupied several of the back-barrier sites. All sample locations were recorded at the time of collection using a Garmin GPSMAP® handheld Global Positioning System (GPS) receiver.

Figure 3. Locations of all sediment samples collected from the northern Chandeleur Islands in (A) March 2012 and (B) September 2012. Analysis of sediments collected at back-barrier sites (green symbols) are described in a separate report (Marot and others, in press). Island elevations are represented by interpolated 2.5-meter by 2.5-meter resolution gridded surfaces derived from USGS lidar data collected in February and September, 2012 (Guy and others, in press a, b). Elevations are North American Vertical Datum of 1988 (NAVD88) orthometric heights, derived using the GEOID09 geoid model. Click on a grab sample ("G") or transect ("T") identifier to view an oblique aerial photograph of that area (Morgan and others, 2013; K.L.M. Morgan and K.A. Westphal, unpub. data, 2014). Abbreviation: m, meter.
Grab Samples
Twenty-nine grab samples were collected in March from the sediment surface along the axis of the berm and adjacent natural island, and 10 grab samples were collected in shallow water north and west of the berm using a Ponar-type (4 samples) or Eckman (6 samples) grab sampler. Five of these submerged sample locations targeted sites that were previously sampled in 2006 and 2008 (Kulp and others, 2011a, b). Twelve grab samples were collected in September from the sediment surface along a transect across the berm and adjacent natural island from site G16 (fig. 3). All samples were bagged, labeled with site and sample number, and transported to SPCMSC for processing and analysis.
Push Cores
Thirty-one short (< 60 centimeters, cm), 1-inch diameter push cores were collected along 10 transects across the berm and natural island using an AMS sand/loose sediment soil probe (fig. 4). Three cores were collected along most transects, with core locations from (1) the sound side of the berm, the pre-berm island shoreface, or the natural island, (2) the berm crest (the highest point along the berm axis as picked in the field), and (3) the berm or post-berm island shoreface adjacent to the Gulf of Mexico. After extraction, each core was capped, sealed, and labeled with transect location, core number, and orientation. The cores were transported to SPCMSC for processing and analysis.
Back-Barrier Sites
During the March sampling effort, an additional 15 short (< 20 cm), 4-inch diameter push cores were collected from back-barrier marsh (8 cores) and tidal flat (7 cores) sites (fig. 3) as part of a complementary USGS study to quantify short-term (seasonal to annual) and long-term (decadal to centennial) sediment movement and sediment storage in the back-barrier environments. The back-barrier sites were reoccupied in July 2012, September 2012, and July 2013; sedimentologic and geochemical analyses of those sediments are described in a separate report (Marot and others, in press).
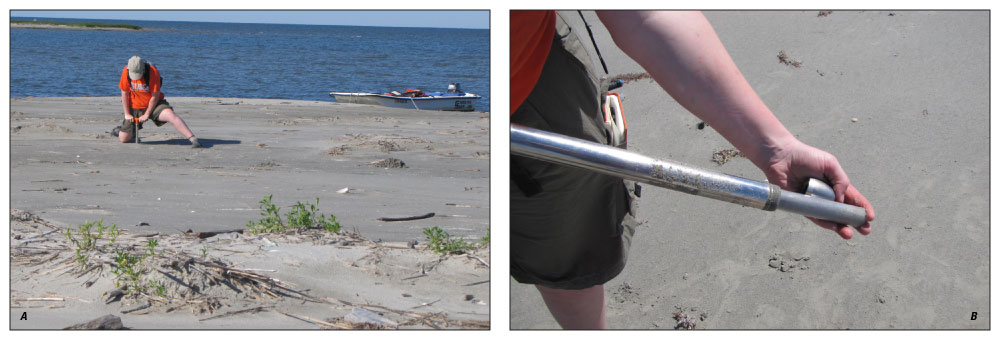
Figure 4. (A) Collecting a push core on the Chandeleur Islands sand berm. (B) Push core being extracted from coring apparatus. Photographs by James Flocks.
Note: Any use of trade names is for descriptive purposes only and does not imply endorsement by the U.S. Government.
