
Laboratory Methods and Analysis
Sample Elevations
Surface elevations of the sediment samples collected in March (FAN 12BIM01) and September (FAN 12LGC02) were interpolated from USGS lidar data collected in February and September 2012 (Guy and others, in press a, b), respectively, using Esri ArcGIS version 10.1.
Core Processing
At the SPCMSC sediment lab, the cores were x-rayed using a Diagnostic Imaging Systems, Inc., Ultra 12040HF x-ray unit at 95 kilovolts for 25 milliampere seconds from a height of 79 cm. The x-radiograph was captured on a 17-inch phosphor cassette, which was scanned on an iCRco, Inc., iCR3600+ scanner at 254 pixels per inch and exported as a 16-bit Tagged Image File Format (TIFF) image. The raw x-radiographs show a pronounced anode heel effect (fig. 5A), which results from variation in x-ray intensity along the anode-cathode axis. This effect biased the imagery so that natural x-ray absorption parameters could not be compared down-core or with other cores. We corrected for this by subtracting a background pixel intensity template from each raw image, a technique similar to methods that have been used in coral densification studies (Chalker and others, 1985; Carricart-Ganivet and Barnes, 2007; Carilli and others, 2010). The anode heel effect has been mostly removed from the resulting filtered images (fig. 5B), and variations in the down-core pixel intensity (fig. 5C) generally correspond to variations in lamination densities and can be compared against other cores. Cores longer than approximately 35 cm that either did not fit onto the phosphor cassette or extended into the area at the bottom of the x-radiograph where the filter could not completely remove the heel effect (fig. 5B) were x-rayed in "top" and "bottom" segments and then merged in Adobe Photoshop CS5.
Each core was split lengthwise, photographed, described using standard sediment-logging methods, and subsampled for grain-size analysis. The cores were photographed in overlapping approximately 3.5-cm segments with a Nikon COOLPIX P5000 digital camera using the macro (close-up) focus mode from a fixed height. The images were "stitched" together using The Panorama Factory version 5.3 software (fig. 6A). The advantage of using a macro-zoom mode instead of a whole-core photograph is that individual grains can easily be identified in the close-up images (fig. 6B), allowing for the identification of "light" versus "dark" lithologies using image-processing software such as ImageJ. Down-core intensity plots generated by ImageJ will be compared against the core x-radiographs as an additional tool to analyze laminations and sediment variability within and among the cores. The core descriptions, x-radiographs, and photographs can be viewed or downloaded from the data products and downloads page. The apparent "loss" of sediment at the top of some core x-radiographs compared to the core photos is likely the result of incomplete removal of the anode heel effect after image filtering.
Informal sedimentary units were picked from each core based on changes in observed texture and frequency or intensity of laminations on the x-radiographs. The cores were subsampled at 2- to 3-cm intervals with 1-cm buffers around the unit boundaries to avoid sampling across units. In most cores, more units were picked from the x-radiographs than were observed visually; however, many of the contacts picked from the x-radiographs coincided with observed lithologic changes. For cores where there were visible lithologic contacts in addition to those picked from the x-radiograph, the sampling intervals and buffers were adjusted to incorporate both the x-radiograph and visible stratigraphies.
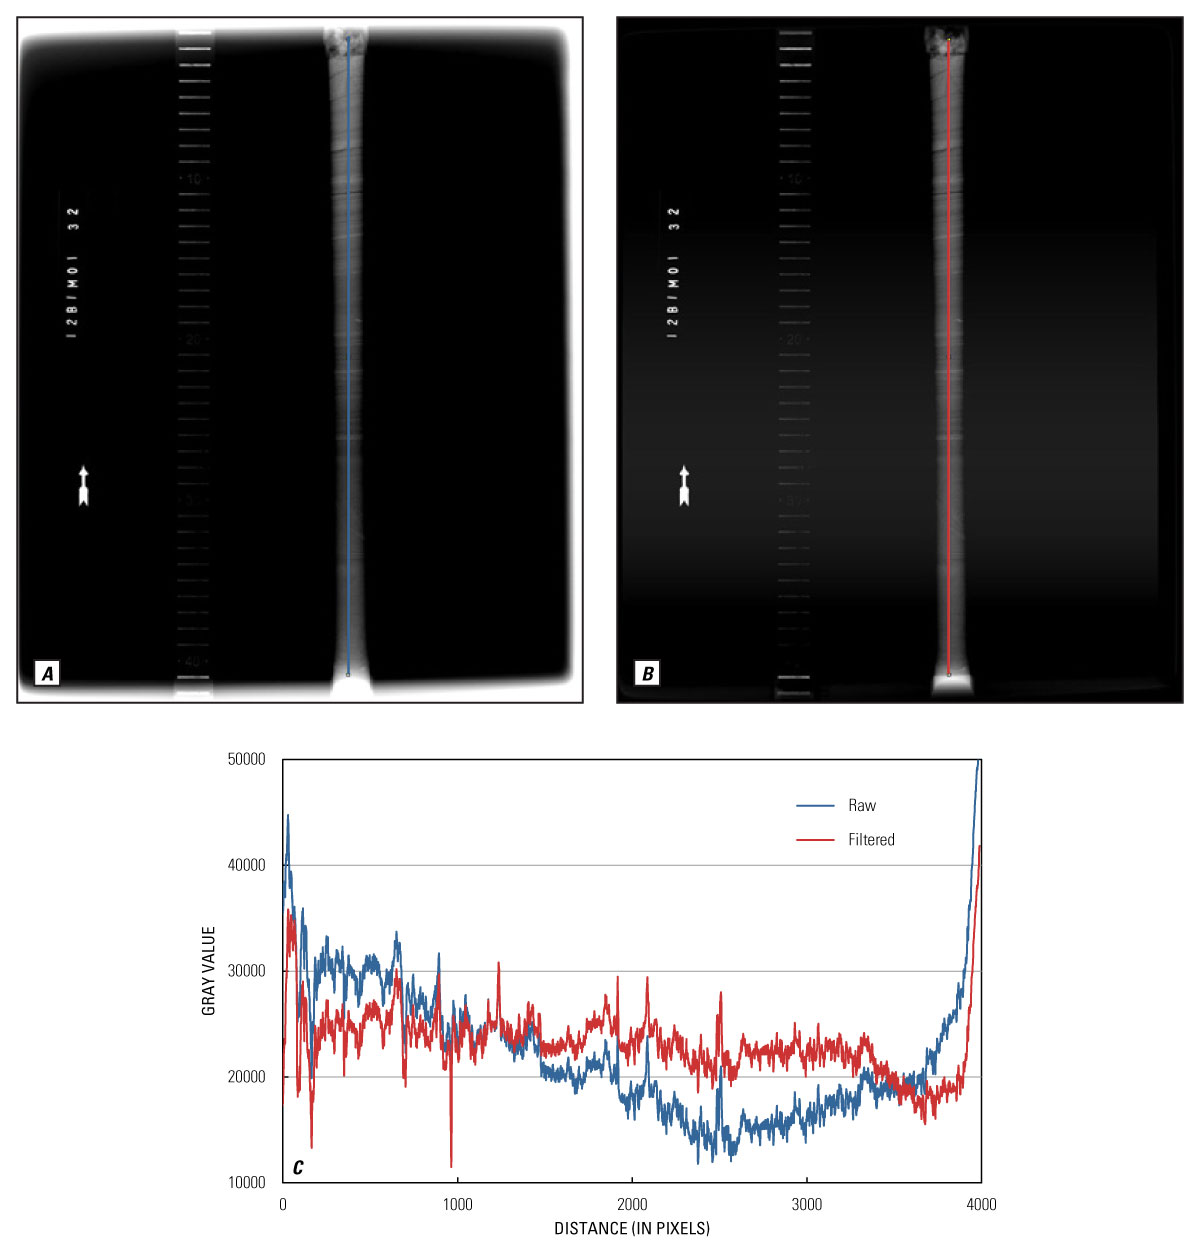
Figure 5. (A) Raw and (B) filtered x-radiograph of a push core. The raw image shows a pronounced anode heel effect, which has been corrected for in the filtered image. Note that the heel effect could not be completely removed from the bottom of (B); x-radiographs of the top and bottom halves of this core were merged for the core logs (see Data Products and Downloads). (C) Plot of down-core variations in pixel intensity in the filtered image generally correspond to variations in lamination density rather than variations in x-ray intensity. Grayscale pixel intensity values were generated along the blue and red lines shown in A and B, respectively, using ImageJ image processing software. [Click to enlarge] |
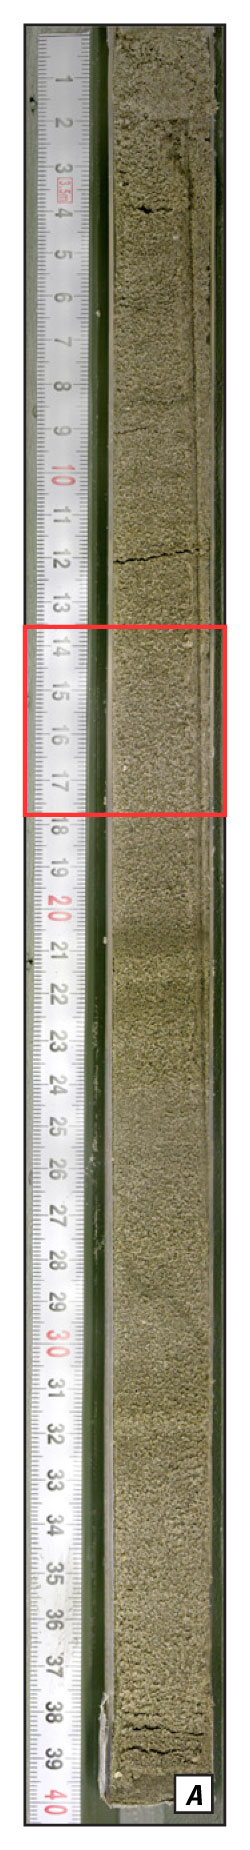 |
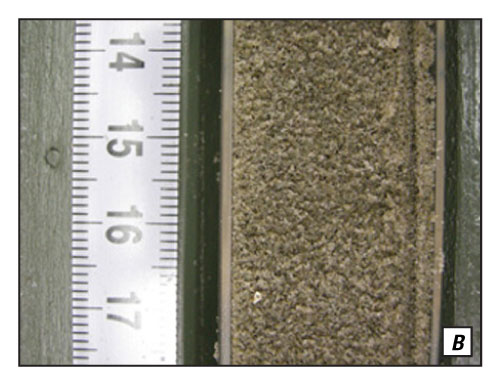
Figure 6. (A) Example of a "stitched" full-length core photograph. (B) Example of individual macro-zoom image showing grain-scale detail. [Click image to enlarge] |
Grain-Size Analysis
Grain-size analyses on both the bulk sediment grab samples and the core sediment samples were performed using a Coulter LS 200 particle-size analyzer, which uses laser diffraction to measure the size distribution of sediments ranging in size from 0.4 microns (µm) to 2 millimeters (mm) (clay to very coarse-grained sand). A total of 51 grab and 365 core samples were analyzed.
In order to prevent shell fragments from damaging the LS 200, particles greater than 1 mm in diameter were separated from all samples prior to analysis using a number 18 (1000 µm, 1 mm) U.S. standard sieve, which meets the American Society for Testing and Materials (ASTM) E11 standard specifications for determining particle size using woven-wire test sieves. Prior to sieving, each down-core sample was dried at 45 degrees Celsius for 24 hours, and the fraction of sediment greater than 1 mm was recorded as a percent of the bulk sample dry weight.
Two subsamples from each sample were processed through the LS 200 a minimum of three runs each. The LS 200 measures the particle-size distribution of each sample by passing sediment suspended in solution between two narrow panes of glass in front of a laser. Light is scattered by the particles into characteristic refraction patterns measured by an array of photodetectors as intensity per unit area and recorded as relative volume for 92 size-related channels (bins). The size-classification boundaries for each bin were specified based on the ASTM E11 standard.
The raw grain-size data were then run through the free, widely available program GRADISTAT (Blott and Pye, 2001), which calculates the geometric (in metric units) and logarithmic (in phi units, Φ; Krumbein, 1934) mean, sorting, skewness, and kurtosis of each sample using the Folk and Ward (1957) method as well as the cumulative particle-size distribution. GRADISTAT also calculates the fraction of sediment from each sample by size category (for example, clay, coarse silt, fine sand) based on a modified Wentworth (1922) size scale. A macro developed by the USGS was applied to calculate the average and standard deviation of each sample set (six runs per sample) and highlight runs that varied from the set average by more than plus or minus (±) 1.5 standard deviations. Excessive deviations from the mean are likely the result of equipment error or extraneous material in the sample and are not considered representative of the sample. Those runs were removed from the results and the sample average was recalculated using the remaining runs. The grain-size data can be viewed or downloaded from the Data Products and Downloads page.
Note: Any use of trade names is for descriptive purposes only and does not imply endorsement by the U.S. Government.
