Data Series 982
|
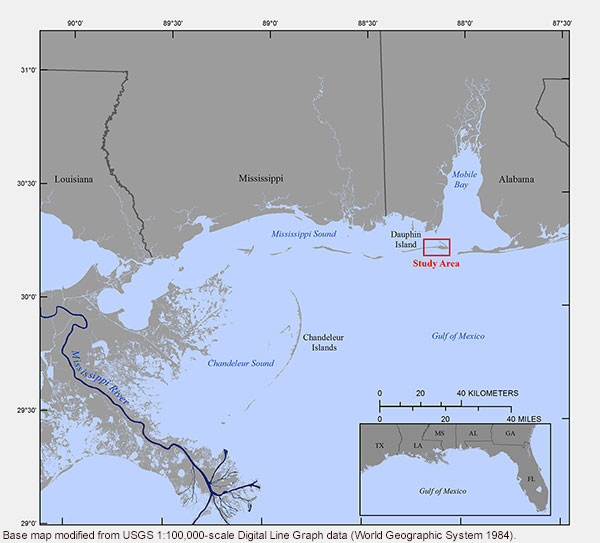
Introduction Figure 1. Regional map showing the April 2013 Dauphin Island, Alabama study area, which was surveyed during U.S. Geological Survey (USGS) field activity 13BIM01. Dauphin Island is located approximately 64 kilometers (km) southwest of Mobile, Alabama, and encompasses an area of roughly 430.1 square kilometers (km2); however, only 16.1 km2 of the Dauphin Island platform is subaerial (U.S. Census Bureau, 2000). Water bodies surrounding the barrier island include Mobile Bay to the east-northeast, Mississippi Sound to the north, and the Gulf of Mexico to the south (fig. 1). Dauphin Island is a compound barrier island system consisting of two distinctly different components. The eastern part of the island is characterized by high elevations associated with modern active sand dunes that were supplied by sand from the shoals of Pelican and Sand Islands. The central and western three-fourths of the island consist of a narrow Holocene sand spit that is overwashed frequently by storm waters because its elevations generally are less than 1.5 meters (m) above sea level (Morton, 2007). Research efforts on Dauphin Island conducted by U.S. Geological Survey (USGS) scientists from April 13 to 20, 2013, were implemented as part of the Barrier Island Evolution Research (BIER) project. The objective of the BIER project is to better understand the depositional and erosional processes that drive the morphologic evolution of barrier islands across annual to interannual timescales (1 to 5 years) (Plant and others, 2014). This multidisciplinary study addresses a research gap between the very short timescale (hours to days) of storm-induced coastal change and the longer timescales (decades to millennia) associated with the historic and geologic evolution of the coastal system. Goals for the Dauphin Island Research subtask, which focused on barrier island stratigraphy, were as follows:
Various field and laboratory methods were employed to help researchers achieve these goals. Field methods included vibracoring, subsurface profiling, augering, and push-coring. Ten push-cores, six peat augers, 15 vibracores, and 65 lines of GPR (linear distance approximately 40 km) were collected during this survey. Post-processed GPR and navigation data were integrated during the final processing steps to ensure proper elevations were displayed on all profiles for subsequent GPR analysis and interpretations. In addition to GPR data interpretation, the sediment samples were analyzed (using standard methods) at the USGS-SPCMSC sediment laboratory to characterize the paleontology, lithology, and geochronology of each sample. |