Data Series 1037
| Laboratory Methods and AnalysesSite ElevationsBase-station data were post-processed through the National Geodetic Survey On-Line Positioning User Service (OPUS), and time-weighted average positions were calculated following SPCMSC standard procedures. The base-station coordinates were imported into GrafNav, version 8.5 (NovAtel Waypoint Product Group), and the data from the rover GPS (the GPS unit used to collect data at each push-core site) were post-processed to the concurrent base-station session data. The final push-core locations, including elevation, are the post-processed DGPS coordinates; baseline distances for all push-core sites were less than 15 km. Sample locations for the grab sample and vibracore sites are the positions recorded in the field; surface elevations at these sites are the cell values extracted from a 100-meter cell size bathymetric grid derived from USGS bathymetric data (DeWitt and others, 2016). These data are included in the site locations files accessible from Bernier and others (2017). Push-Core ProcessingAt the SPCMSC sediment laboratory, the push cores were x-rayed using an Ecotron EPX-F2800 x-ray unit at 85 kilovolts for 16 milliampere-seconds from a height of 79 cm. The x-radiograph was captured on an 11 × 14-inch phosphor cassette, which was scanned on an iCRco, Inc., iCR3600+ scanner at 254 pixels per inch and exported as a 16-bit Tagged Image File Format (TIFF) image. The raw x-radiographs show a slight anode heel effect, which is a variation in x-ray intensity along the anode-cathode axis that results in non-uniform pixel intensity across the image. This effect was corrected by subtracting a background pixel intensity template from each raw image (Bernier and others, 2014; Buster and others, 2014), a technique similar to methods used in coral densification studies (Chalker and others, 1985; Carricart-Ganivet and Barnes, 2007; Carilli and others, 2010). The anode heel effect has been mostly removed from the filtered images, and variations in the down-core pixel intensity correspond to variations in lamination densities and can be compared against other cores. Cores longer than approximately 35 cm, that did not fit onto the phosphor cassette or extended into the area at the bottom of the x-radiograph where the filter could not completely remove the heel effect, were x-rayed in "top" and "bottom" segments and then merged in Adobe Photoshop Creative Cloud (CC) 2014. Images were then edited in Adobe Photoshop CC 2014 by applying a grayscale color inversion. Each push core was then split lengthwise, photographed, described macroscopically using standard sediment-logging methods, and subsampled at 2-cm intervals for grain-size analysis. In addition to whole-core photographs, the cores were also photographed in approximately 5-cm, overlapping segments with a Nikon COOLPIX P5000 digital camera using the macro focus mode from a fixed height. The raw images were "stitched" together using The Panorama Factory version 5.3 software, providing seamless high-resolution whole-core images. The core logs, x-radiographs, and photographs can be downloaded from Bernier and others (2017). Textural descriptions for the core logs are based on macroscopic observations; the quantitative grain-size data are represented by down-core plots on the core logs (fig. 7). Vibracore ProcessingEach vibracore was split lengthwise, photographed with a Canon Powershot SX20 IS digital camera, described macroscopically using standard sediment-logging methods, and subsampled for grain-size analysis. Grain-size samples consisted of 2-cm sections sampled at varying intervals down-core depending on the number and thickness of the observed sedimentologic units. The core logs and photographs can be downloaded from Bernier and others (2017). Textural descriptions for the core logs are based on macroscopic observations; the quantitative grain-size data are represented by down-core plots on the core logs (fig. 8). Grain-Size AnalysisGrain-size analyses were performed using a Coulter LS 200 (submerged grab samples and vibracores) or a Coulter LS 13 320 (push cores and vibracores) particle-size analyzer, which use laser diffraction to measure the size distribution of sediments ranging in size from 0.4 microns (µm) to 2 millimeters (mm) (clay to very coarse-grained sand). A total of 1,850 samples were analyzed from 38 grab samples, 18 push cores (140 samples), and 56 vibracores (1,672 samples). In order to prevent shell fragments from damaging the particle-size analyzers, particles greater than 1 mm in diameter were separated from all samples prior to analysis using a number 18 (1,000 µm, 1 mm) U.S. standard sieve, which meets the American Society for Testing and Materials (ASTM) E11 standard specifications for determining particle size using woven-wire test sieves. Prior to sieving, each push-core sample was dried at 60 degrees Celsius for 24 hours, and the fraction of sediment greater than 1 mm was recorded as a percentage of the bulk sample dry weight. The vibracore and bulk grab samples were homogenized in the sample bag and wet-sieved to remove any large particles. Two subsamples from each sample were processed through the LS 200 or the LS 13 320 particle-size analyzers a minimum of three runs each. These instruments measure the particle-size distribution of each sample by passing sediment suspended in solution between two narrow panes of glass in front of a laser. Light is scattered by the particles into characteristic refraction patterns measured by an array of photodetectors as intensity per unit area and recorded as relative volume for 92 size-related channels (bins). The size-classification boundaries for each bin were specified on the basis of the ASTM E11 standard. The raw grain-size data were run through the free, widely available program GRADISTAT (Blott and Pye, 2001), which calculates the geometric (in metric units) and logarithmic (in phi units, Φ; Krumbein, 1934) mean, sorting, skewness, and kurtosis of each sample using the Folk and Ward (1957) method as well as the cumulative particle-size distribution. GRADISTAT also calculates the fraction of sediment from each sample by size category (for example, clay, coarse silt, fine sand) based on a modified Wentworth (1922) size scale. A macro developed by the USGS was applied to calculate the average and standard deviation of each sample (six runs per sample) and highlight runs that varied from the set average by more than plus or minus (±) 1.5 standard deviations. Excessive deviations from the mean are likely the result of equipment error or extraneous material in the sample and, therefore, are not considered representative of the sample. Those runs were removed from the results and the sample average was recalculated using the remaining runs. The grain-size data are included as down-core plots with the core logs; the individual run statistics as well as the averaged run statistics and graphical class-size distributions are also available from Bernier and others (2017). 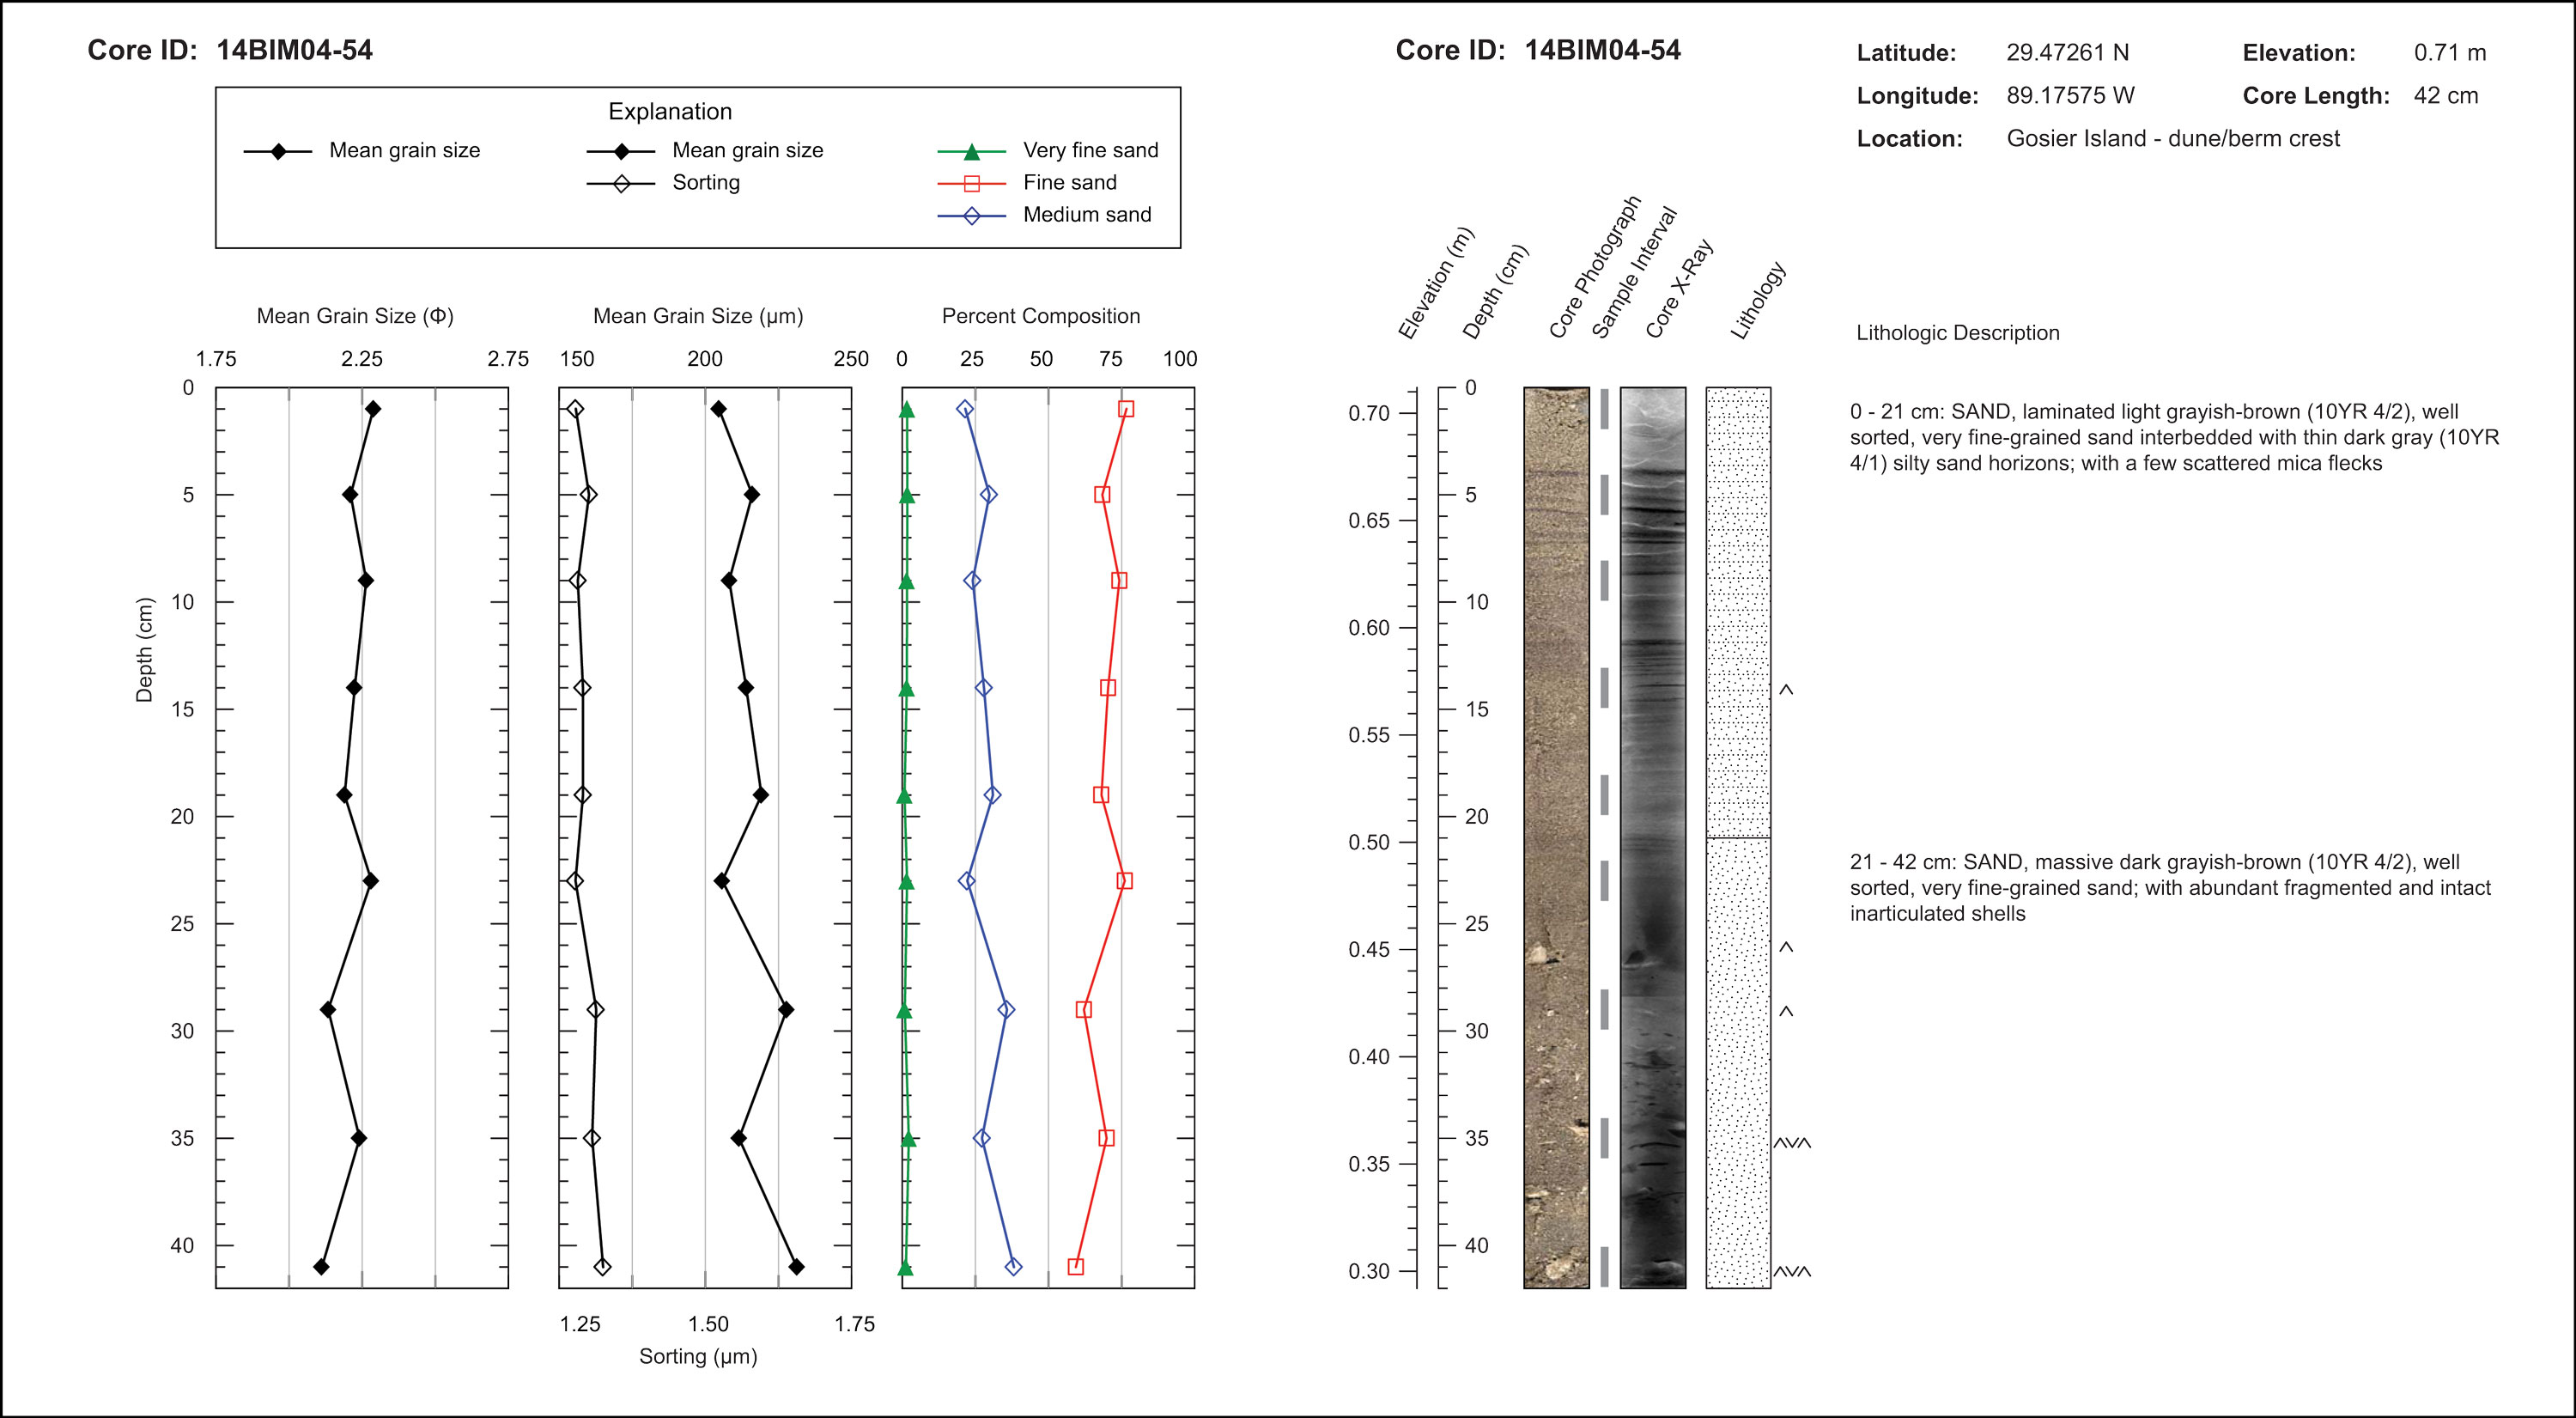 Figure 7. Example log from push core 14BIM04-54. Sediment color is based on the Munsell® soil color system. [Click image to enlarge] 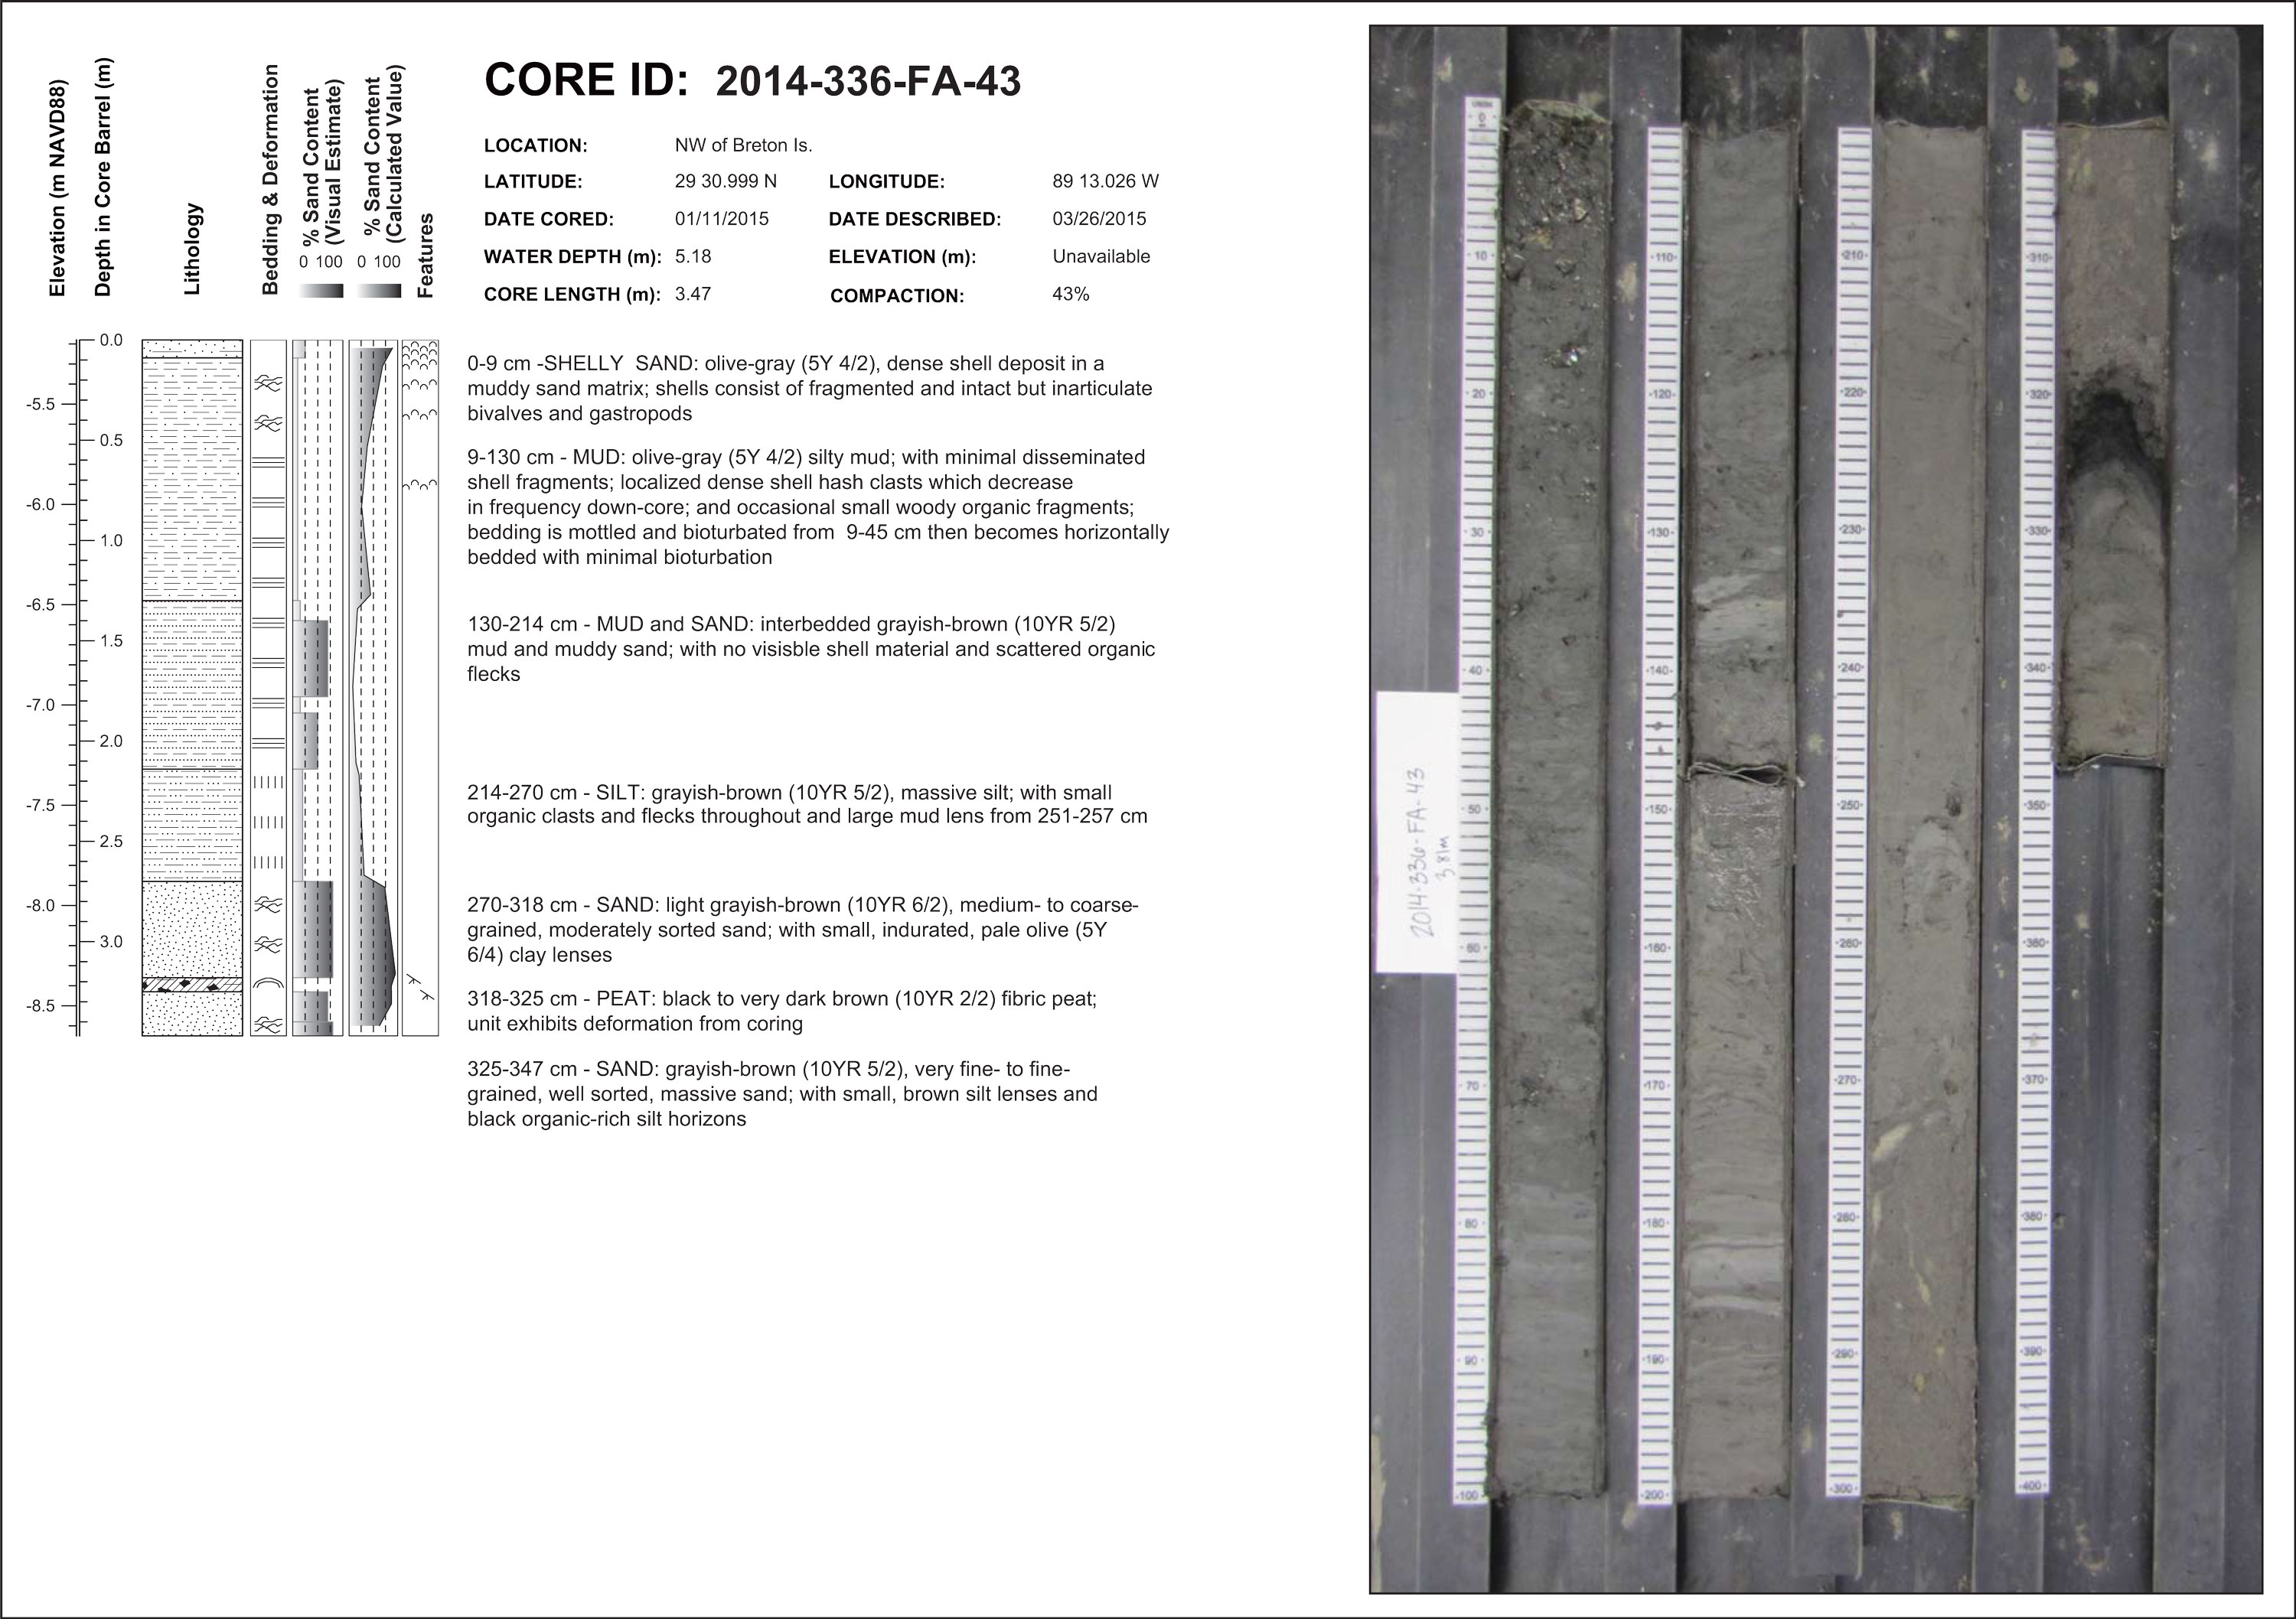 Figure 8. Example log from vibracore 2014-336-FA-43. Sediment color is based on the Munsell® soil color system. [Click image to enlarge] |

![]() U.S. Department of the Interior |
U.S. Geological Survey
U.S. Department of the Interior |
U.S. Geological Survey
URL: http://pubsdata.usgs.gov/pubs/ds/1037/ds1037_lab-methods.html
Page Contact Information: GS Pubs Web Contact
Page Last Modified: Tuesday, 07-Mar-2017 14:30:27 EST
