Data Series 1039
| Data ProcessingNavigationThe coordinate values for each of the GPS base stations (MRK3, SM01, GRIG) are the time-weighted average of values obtained from the National Geodetic Survey's (NGS) On-Line Positioning User Service (OPUS). All base station sessions of recorded data are decimated to 30 s and then submitted to OPUS via the online service. All OPUS solutions were entered into a spreadsheet where time-weighted ellipsoid values were calculated for each station for the entire occupation. Any processed GPS session that failed a 3-sigma outlier test, in which the ellipsoid value was greater than three standard deviations (σ) from the time-weighted mean were excluded from the final coordinate calculations. The final base station coordinates were used in GrafNav version 8.5 (Waypoint Product Group) and the kinematic GPS data from the survey vessel were post-processed to the concurrent static GPS data from the nearest base station to minimize vertical error. During processing, steps were taken to ensure that the trajectories between the base and rover were clean and resulted in fixed positions. By analyzing the graphs, trajectory maps, and processing logs that GrafNav produces for each GPS session, GPS data from satellites with cycle slips were identified and excluded, or the satellite elevation mask angle was adjusted to improve the position fixes if necessary. The final differentially-corrected GPS (DGPS) precise positions were computed at 0.1, 0.2 or 1 second intervals depending on rover acquisition setting, and then exported in American Standard Code for Information Interchange (ASCII) text format. These positions replaced the uncorrected, real-time rover positions recorded during acquisition. The GPS data were processed and exported in the World Geodetic System of 1984 (WGS84) (G1150) geodetic datum, Universal Transverse Mercator (UTM) zone 16 North (16N). Soundings and MotionThe raw HYPACK data files were imported into CARIS Hydrographic Information Processing System (HIPS) and Sonar Information Processing System (SIPS) version 9.1.0. The DGPS positions exported from GrafNav were imported into CARIS using the generic data parser tool within CARIS. After parsing, the navigation data was scanned using the Navigation Editor to verify that the processed DGPS data were correctly and accurately imported. Next, SVP profile casts were entered, and applied, using the SVP editor tool. Tidal elevations were also computed at each sounding x,y position. Tidal elevations and post processed GPS heights were compared to ensure correct computation by the program and correct GPS antenna height within the generated vessel file. All bathymetric data components (position, motion, depth, GPS tide, and the speed of sound ) were merged and geometrically corrected in CARIS to produce processed x,y,z point data. Once merged the dataset was evaluated to identify erroneous points using the Single Beam Editor. Erroneous (horizontally or vertically offset) point data may result from (1) cavitation in the water column obscuring the fathometer signal, (2) tight turns in the surf zone affecting the tracking of the incoming GPS signal, and/or (3) false readings due to general equipment issues. All point data found to be inaccurate were either discarded or adjusted. Data points in areas of extremely shallow water (0.30 to 0.50 m) such as those on shoals or within seagrass beds were additionally reviewed against the surrounding data for overall consistency. Finally, a “Bathymetry with Associated Statistical Error” (BASE) surface was created. Using the Subset Editor in CARIS, the BASE surface was represented as a color coded guide to review crossings, sounding quality, and sounding placement within a 3 dimensional setting, and used to pinpoint crossings that were visually offset from one another. If an offset was identified, it was further examined and reprocessed as necessary. The corrected point data were exported as an x,y,z ASCII text file referenced to WGS84 (G1150), UTM zone 16N, with ellipsoid height in meters. The merged single-beam bathymetry datasets (15BIM01, 15BIM02, 15BIM03) consist of 8,223,749 point elevations with an ellipsoidal elevation range of -43.927 to -25.097 m. Error AnalysisSingle-beam data were imported into Esri ArcMap version 10.2, and a shapefile of the individual data points (x,y,z) was created and plotted in 1-m color coded intervals for further quality assurance and quality control (QA/QC) analysis. A Python script was used to evaluate elevation differences at the intersection of crossing tracklines. The script calculates the elevation difference between points at each intersection using an inverse distance weighting equation. GPS cycle slips, stormy weather conditions, and rough seas can contribute to poor data quality. If discrepancies were found, the line was statically adjusted. There were a total of 1,175 crossings for the survey, 79 percent of which were less than or equal to 0.2 m of offset. The southern westernmost extent of the data collected aboard the R/V Jabba Jaw (15BIM02) does not have accompanying post processed DGPS due to technical difficulties. These data were statically adjusted using the above techniques; however, significant vertical adjustments were necessary (fig. 6). 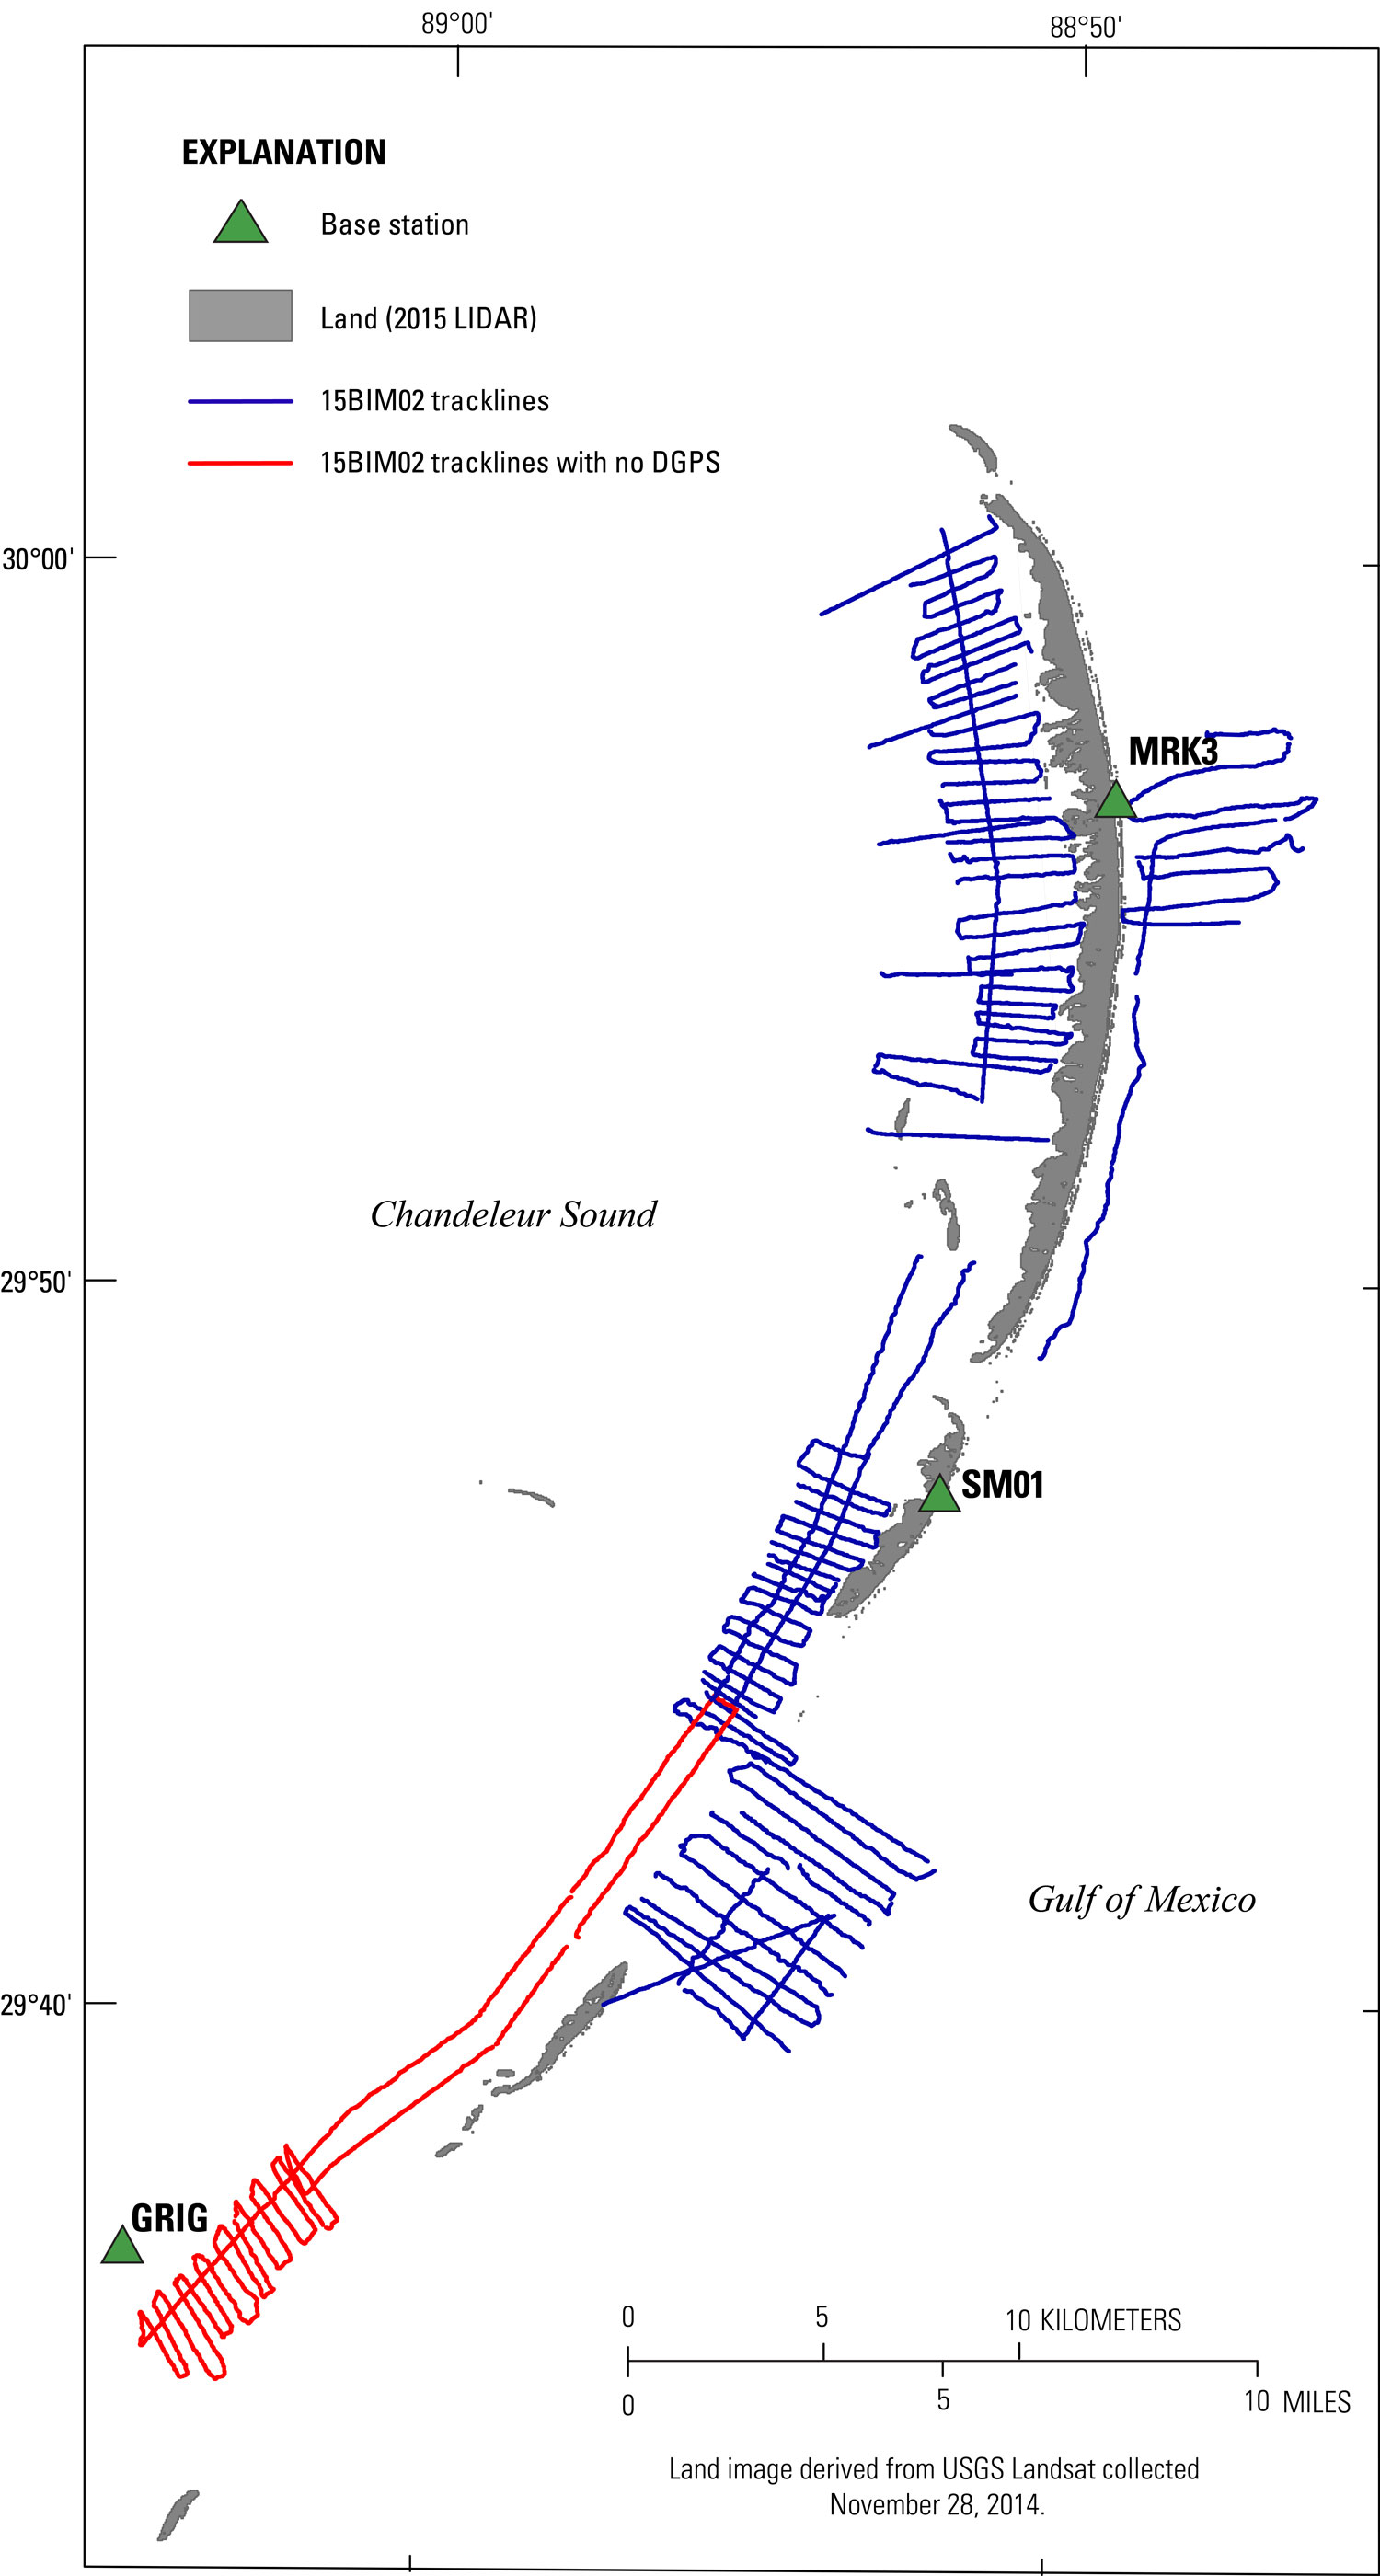 Figure 6. Trackline map coverage by the R/V Jabba Jaw. The red tracklines represent Julian Day 173, during which the Kinematic (rover) DGPS data failed to record. These lines were analyzed with the same quality assurance and quality control analysis (QA/QC) as all other lines. [Click figure to enlarge] Digital Elevation Model (DEM)The final sounding data that contribute to the Digital Elevation Model (DEM) were transformed horizontally into North American Datum of 1983 (NAD83) (CORS96), UTM zone 16N, and vertically into North American Vertical Datum of 1988 (NAVD88) orthometric height, using the GEOID12A geoid model and the National Oceanic and Atmospheric Association (NOAA) VDatum version 3.2 transformation software (reported vertical transformation error is 5.4 centimeters (cm)). The resulting orthometric heights (elevations) for all survey vessels ranged from 0.0 to -15.58 m. The NAVD88 point elevations were imported into ESRI’s ArcMap version 10.2 and gridded using the 3D Analyst and Spatial Analyst toolsets. A triangulated irregular network (TIN) was created from the shapefile containing the final point data using the Create TIN tool, and the data were then converted into a digital elevation model (DEM) using the TIN to Raster tool and natural neighbors algorithm with a cell size of 200 m. A bounding polygon representing the extent of survey tracklines was created and converted into a raster mask using the ArcGIS Polygon to Raster tool, and the interpolated DEM was clipped to this survey extent using the Extract by Mask tool. The final product is a DEM of the entire survey extent; grid values range from -0.01 m maximum to -15.40 m minimum (fig. 7).  Figure 7. The final 200-meter (m) Digital Elevation Model (DEM) for the 2015 Chandeleur Islands, Louisiana, single-beam bathymetry survey. Horizontal data is referenced to the North American Datum of 1983 (NAD83), UTM zone 16 North; and the vertical data is referenced to the North American Vertical Datum of 1988 (NAVD88) with respect to GEOID12A. [Click figure to enlarge] Note: Any use of trade names is for descriptive purposes only and does not imply endorsement by the U.S. Government. |

![]() U.S. Department of the Interior |
U.S. Geological Survey
U.S. Department of the Interior |
U.S. Geological Survey
URL: http://pubsdata.usgs.gov/pubs/ds/1039/ds1039_data-processing.html
Page Contact Information: GS Pubs Web Contact
Page Last Modified: Thursday, 23-Feb-2017 11:12:53 EST
