USGS - science for a changing world

Data Series 1039


Coastal Single-Beam Bathymetry Data Collected in 2015 from the Chandeleur Islands, Louisiana

Skip Links

Citation Page
Abstract
Introduction
Survey Overview
Data Acquisition
Data Processing
Error Analysis
Survey Products
Data Downloads
Logs
Abbreviations
References Cited
 

Survey Products

Tracklines Bathymetry
Trackline map coverage for the 2015 Barrier Island Comprehensive Monitoring (BICM) single-beam bathymetry survey of the Chandeleur Islands, Louisiana.
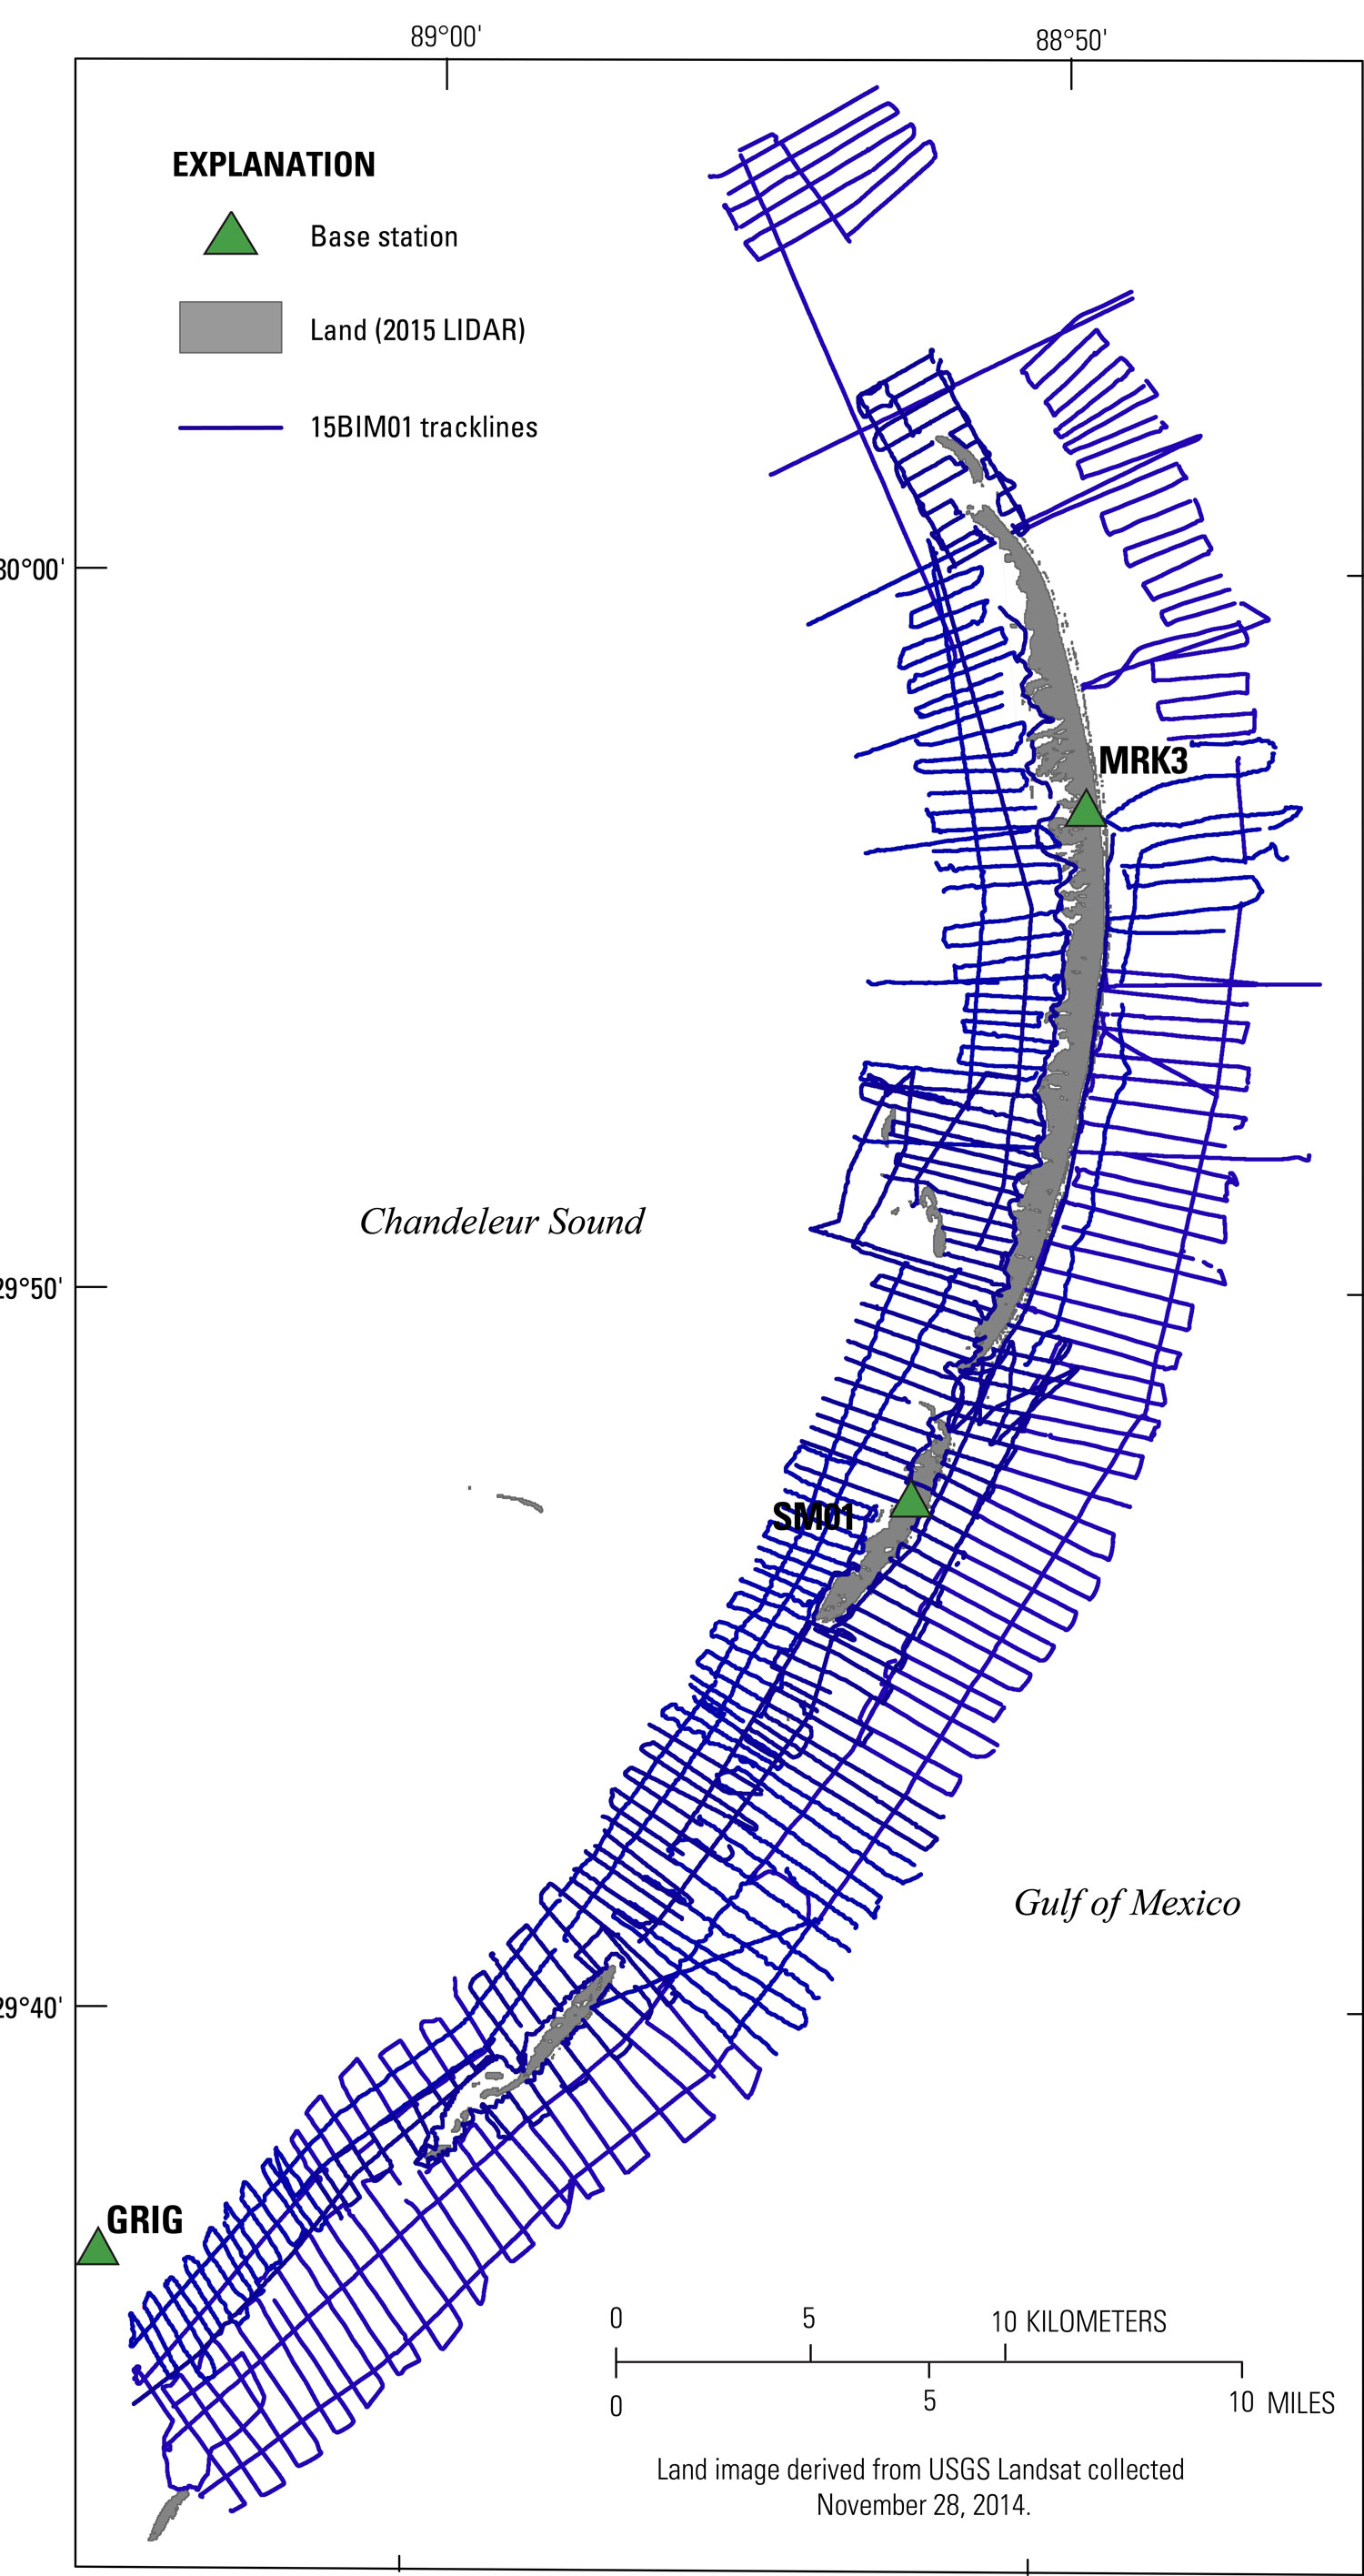
Figure 2. Trackline map coverage for the 2015 Barrier Island Comprehensive Monitoring (BICM) single-beam bathymetry survey of the Chandeleur Islands, Louisiana. [Click figure to enlarge]
The final 200-meter (m) Digital Elevation Model (DEM) for the 2015 Chandeleur Islands, Louisiana, single-beam bathymetry survey.
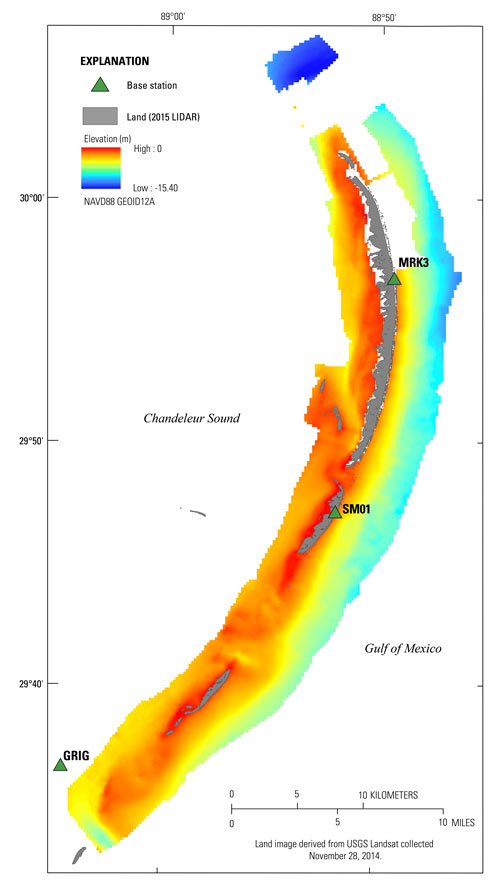
Figure 7. The final 200-meter (m) Digital Elevation Model (DEM) for the 2015 Chandeleur Islands, Louisiana, single-beam bathymetry survey. Horizontal data is referenced to the North American Datum of 1983 (NAD83), UTM zone 16 North; and the vertical data is referenced to the North American Vertical Datum of 1988 (NAVD88) with respect to GEOID12A. [Click figure to enlarge]
Data acquisition showing in A, a photograph of the R/V Sallenger vessel used for data collection and in B, a trackline map of 665.6 line-km (216 lines) single-beam bathymetry results (USGS SPCMSC cruise identifier 15BIM01).
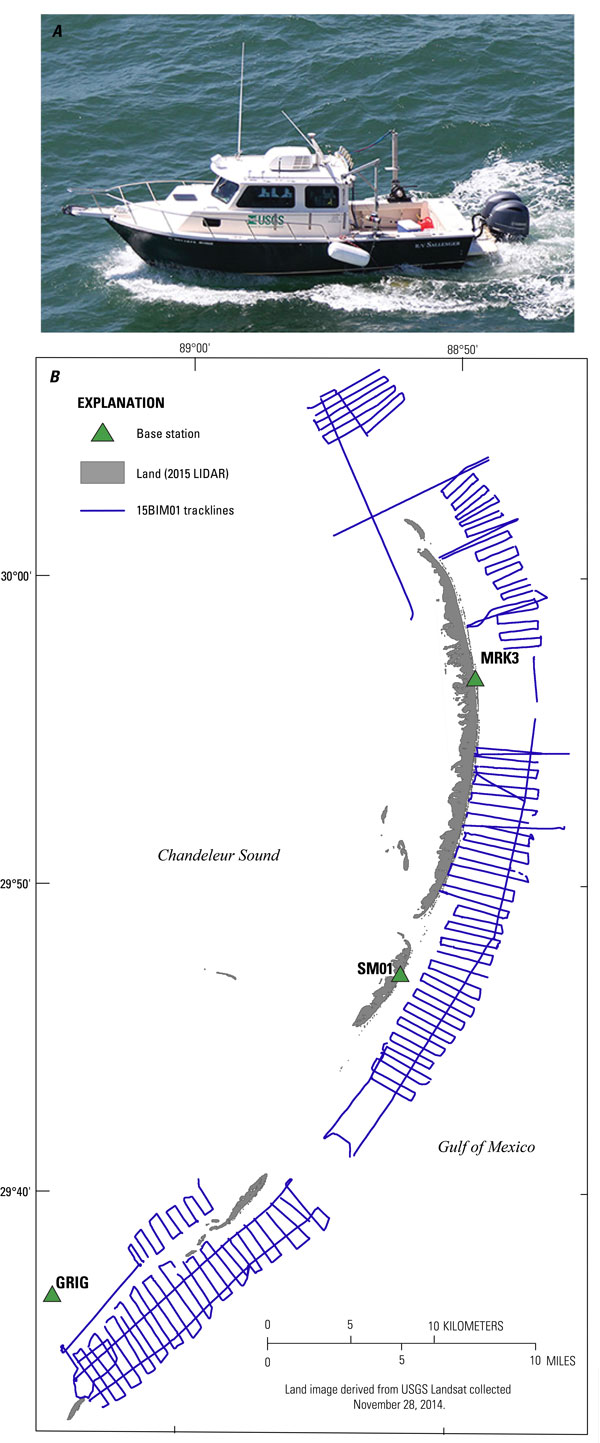
Figure 3. Data acquisition showing in A, a photograph of the R/V Sallenger vessel used for data collection and in B, a trackline map of 665.6 line-km (216 lines) single-beam bathymetry results (USGS SPCMSC cruise identifier 15BIM01). [Click figure to enlarge]
Error values representing the difference between the Digital Elevation Model (DEM) and the value at each sample point. Points with acceptable grid error of +0.20 to -0.19 meters (m) were made transparent to ensure visibility of points and areas that are greater in error.
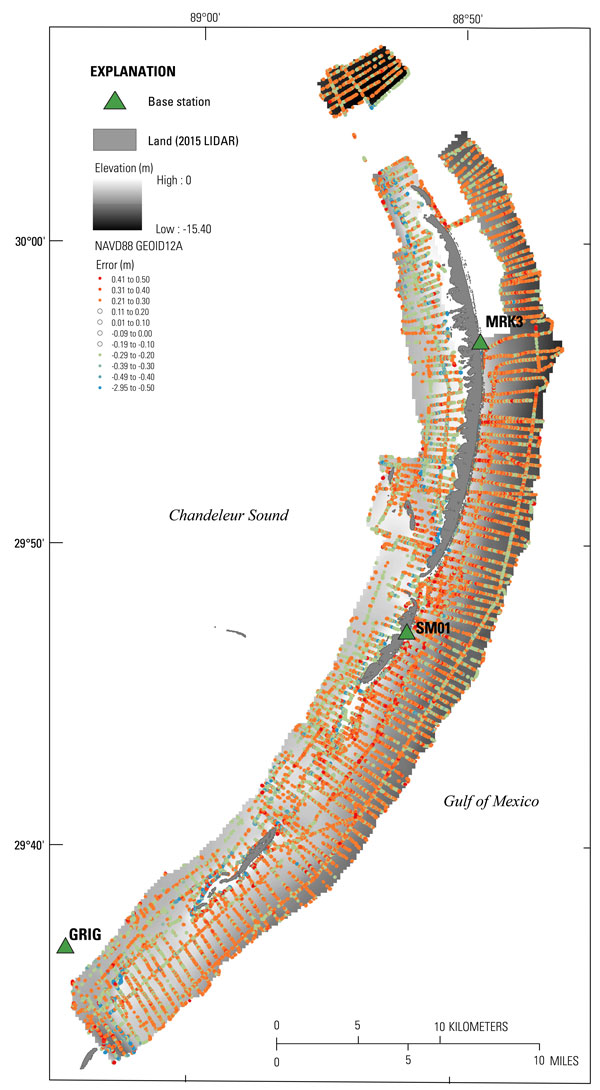
Figure 8. Error values representing the difference between the Digital Elevation Model (DEM) and the value at each sample point. Points with acceptable grid error of +0.20 to -0.19 meters (m) were made transparent to ensure visibility of points and areas that are greater in error. [Click figure to enlarge]
Data acquisition showing in A, a photograph of the R/V Jabba Jaw vessel used for data collection and in B, a trackline map of 442.3 line-km (158 lines) single-beam bathymetry results (USGS SPCMSC cruise identifier 15BIM02).
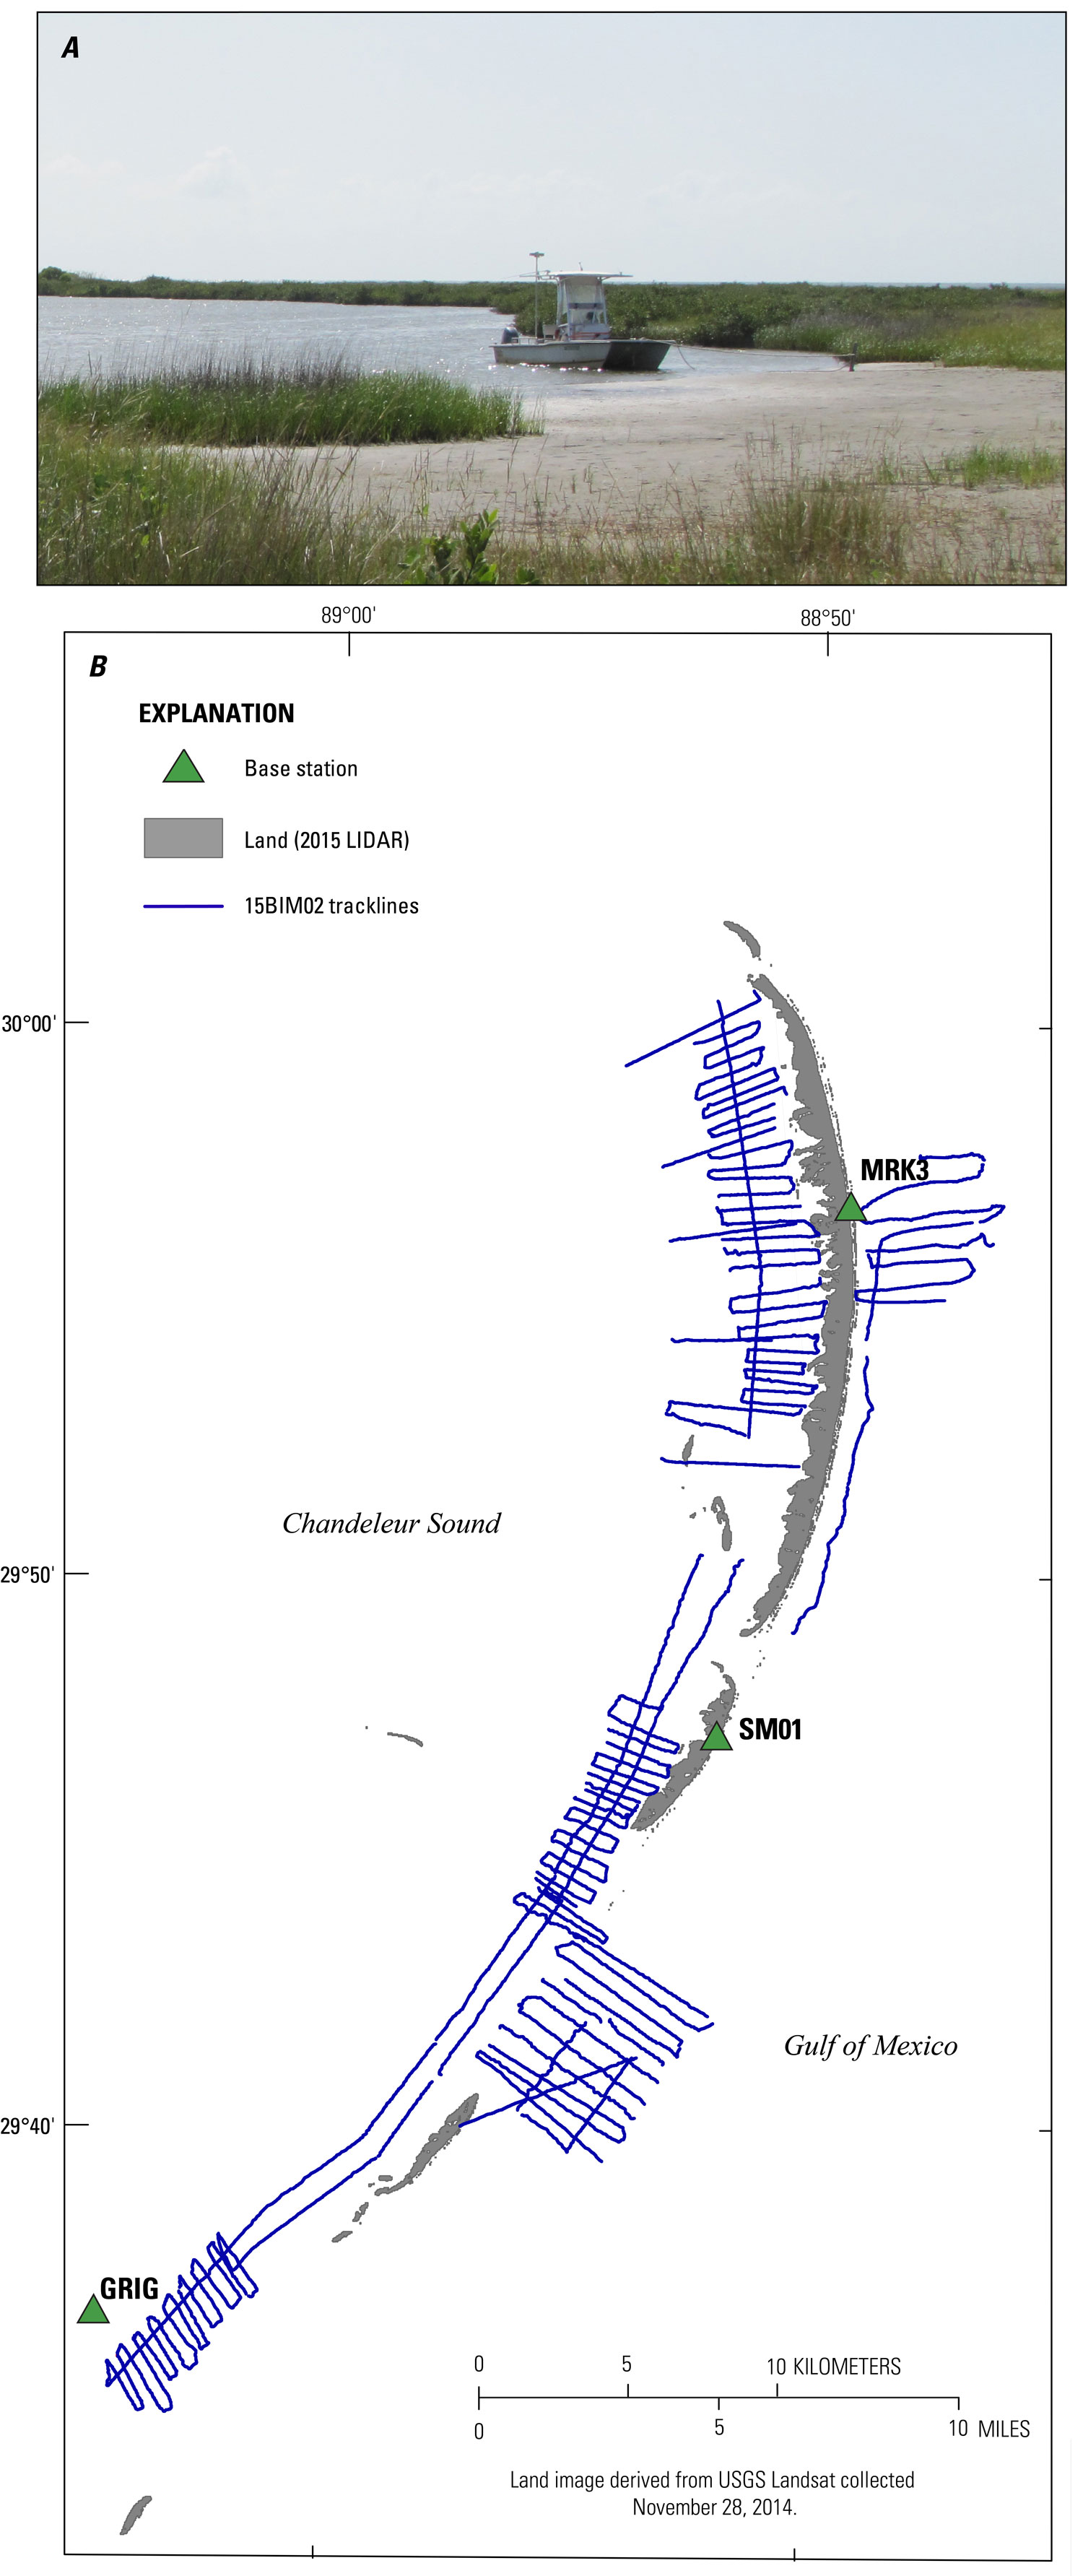
Figure 4. Data acquisition showing in A, a photograph of the R/V Jabba Jaw vessel used for data collection and in B, a trackline map of 442.3 line-km (158 lines) single-beam bathymetry results (USGS SPCMSC cruise identifier 15BIM02). [Click figure to enlarge]
Data acquisition showing in A, a photograph of the R/V Chum vessel used for data collection and in B, a trackline map of 505.7 line-km (186 lines) single-beam bathymetry results (USGS SPCMSC cruise identifier 15BIM03).
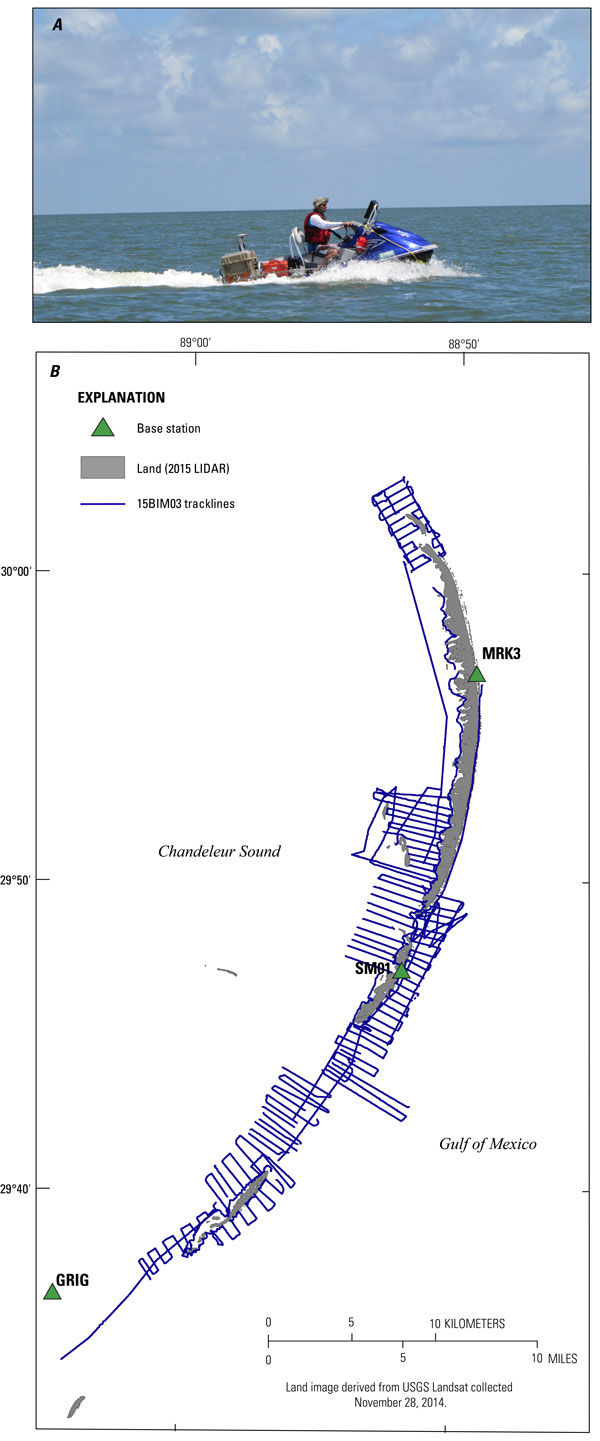
Figure 5. Data acquisition showing in A, a photograph of the R/V Chum vessel used for data collection and in B, a trackline map of 505.7 line-km (186 lines) single-beam bathymetry results (USGS SPCMSC cruise identifier 15BIM03). [Click figure to enlarge]

Accessibility FOIA Privacy Policies and Notices

Take Pride in America logo USA.gov logo U.S. Department of the Interior | U.S. Geological Survey
URL: http://pubsdata.usgs.gov/pubs/ds/1039/ds1039_survey_products.html
Page Contact Information: GS Pubs Web Contact
Page Last Modified: Thursday, 23-Feb-2017 11:15:28 EST