Data Series 1070
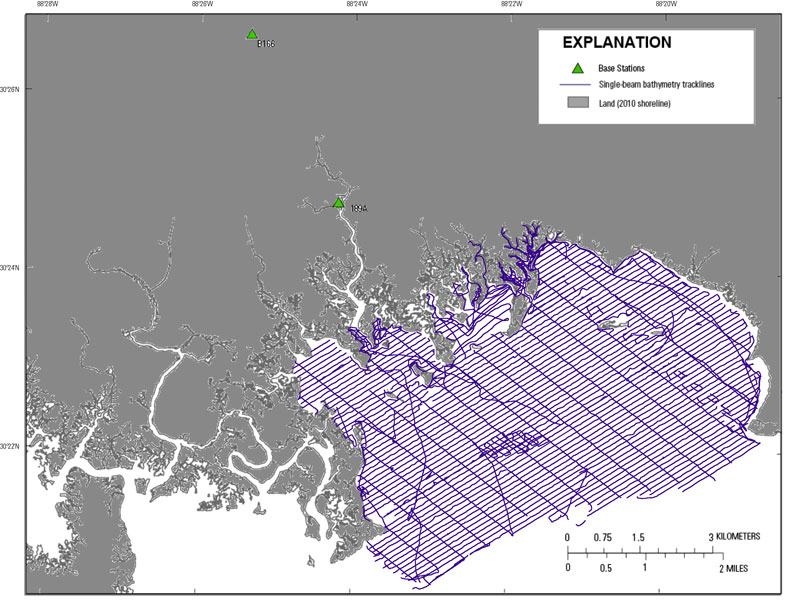
| Data AcquisitionNavigationTwo Global Positioning System (GPS) base stations were reoccupied by USGS personnel for the purpose of this survey. Benchmark 189A was located north–northwest (NNW) of the survey area near the entrance to the GND NERR; benchmark B166 was located NNW of the survey area near the boat ramp used for this survey (fig. 5). The base stations were equipped with Ashtech Proflex Differential GPS (DGPS) receivers recording 12-channel full-carrier-phase positioning signals (L1/L2) from satellites via Thales choke-ring antennas recording at 0.1 seconds intervals (s) (table 2).  Figure 5. Survey overview of base station locations and single-beam bathymetry tracklines of the 2015 Grand Bay, Alabama-Mississippi, survey (field activity number 2015-315-FA). [Click figure to enlarge] GPS instrumentation was duplicated on all survey vessels except that Ashtech Global Navigation Satellite Systems (GNSS) antennas were used instead of choke-ring antennas. The base and vessel receivers recorded positions concurrently at all times throughout the survey, all 0.1 s intervals. SoundingsDepth soundings were recorded at 50-millisecond (ms) intervals on each survey platform using ODOM Echotrac CV100 echo sounders (table 3) and ODOM eChart software version 1.4. The GPS antenna and the echo sounder transducers were mounted in-line vertically to minimize error resulting from offsets, helping to maintain low overall error for the survey. On each vessel, all data from the GPS receiver, motion sensor, and echosounder were recorded in realtime to a single raw data file (.raw) within the hydrographic survey software HYPACK (version 13.0.09.17), with each device string referenced by identification code and a Coordinated Universal Time (UTC) time stamp to the nearest millisecond. HYPACK software was also used in conjunction with the eChart software to monitor sounding data quality at all times throughout the survey. Vessel MotionA motion sensor device was not used on the R/V Shark or the R/V Chum. Motion errors on these vessels were minimized by using a rapid GPS recording rate (0.1 s), a minimal vertical distance (1.295 m and 1.235 m, respectively) from the antenna to the sounding device, and a narrow (4 degree) transducer beam. Sound VelocitySound velocity profile (SVP) measurements were collected using two SonTek Castaway Conductivity, Temperature, and Depth (CTD) instruments (table 4). The instruments were periodically cast overboard to observe changes in speed of sound (SOS). A total of 74 sound velocity casts were taken throughout the survey in water depths ranging from 0.135 m to 3.95 m. The average sound velocity recorded was 1521.4 meters per second (m/s), and values ranged from 1515.6 m/s to 1527.0 m/s. The profiles were later incorporated into the post processing software to correct the depth for temporal and spatial changes in SOS throughout the water column.
Table 2. Specifications for the Ashtech ProFlex 500 and ProFlex 800 Global Positioning System receivers used during the single-beam bathymetry survey. Specifications are provided in millimeters (mm) and parts per million (PPM). The equipment specifications are available in Portable Document Format (PDF) through the following links: Ashtech_ProFlex500 (2.3-MB PDF), Ashtech_ProFlex800 (1.7-MB PDF).
Table 3. Specifications for the ODOM Echotrac CV100 echosounder used during the single-beam bathymetry survey. The equipment specifications are available through the following link: Odom_Echotrac_CV100 (1-MB PDF).
Table 4. Specifications for the SonTek CastAway CTD profiler used during the single-beam bathymetry survey. The equipment specifications are available through the following link: CastAway-CTD (1.6-MB PDF).
Note: To view PDF documents, the latest version of Adobe Reader or similar software is necessary. |
|||||||||||||||||||||||||||||||||||||||||