Data Series 1070
| Data ProcessingNavigationThe coordinate values for each GPS base station (B166, 189A) are the time-weighted averages of base-station data processed through the National Geodetic Survey's (NGS) On-Line Positioning User Service (OPUS). All base station sessions were decimated to 30 s and then submitted to OPUS via the online service. All OPUS solutions were entered into a spreadsheet, and time-weighted ellipsoid values for each station were calculated for the duration of the occupation. Any processed GPS sessions in which the average ellipsoid value was greater than 3 standard deviations (σ) from the mean were excluded from the final coordinate calculations. The final base station coordinates were imported into GrafNav software version 8.5 (NovAtel Inc.), and the kinematic GPS data from the survey vessel were post processed to the concurrent static GPS data from the nearest base station to minimize vertical error. By analyzing the graphs, trajectory maps, and processing logs that GrafNav produces for each GPS session, GPS data from satellites with cycle slips were identified and excluded, and the satellite elevation mask angle was adjusted to improve the position fixes when necessary. The final differentially corrected precise positions were computed at 0.1 s intervals and exported in American Standard Code for Information Interchange (ASCII) text format. These positions replaced the uncorrected real-time vessel positions recorded during acquisition and subsequent processing. The GPS data were processed and exported in WGS84 (G1150/ITRF00) geodetic datum, UTM zone 16 North (16N). Soundings and MotionThe raw HYPACK data files were imported into CARIS Hydrographic Information Processing System (HIPS) and Sonar Information Processing System (SIPS) software, version 9.0.17. The DGPS positions exported from GrafNav were imported into CARIS using the generic data parser tool within CARIS. All bathymetric data components (position, depth, GPS tide, and SOS) were checked, merged and geometrically corrected in CARIS to produce processed x,y,z point data. Once merged, the dataset was evaluated to identify erroneous points: points that are either horizontally or vertically offset. Data points in areas of extremely shallow water (0.30 m to 0.50 m), such as on shoals or within seagrass beds, were further compared with surrounding data to ensure overall consistency. The corrected point data were then exported as an x,y,z ASCII text file referenced to WGS84 (G1150/ITRF00), UTM 16N, ellipsoid height in meters. The combined single-beam bathymetry datasets (15CCT04, 15CCT05) consist of 3,844,122 point elevations with an ellipsoidal elevation range between -33.364 m and -29.531 m. Error AnalysisSingle-beam data were imported into Esri ArcMap version 10.2, where a shapefile of the individual data points (x,y,z) was created and plotted in 0.5-m color-coded intervals for further quality assurance and quality control (QA/QC) analysis. A Python script was used to evaluate elevation differences at the intersection of crossing tracklines. The script calculates the elevation difference between points at each intersection using an inverse distance-weighting equation. GPS cycle slips, stormy weather conditions, and rough sea surface states can contribute to poor data quality. A line in error consists of (1) a segment where several crossings are incomparable, (2) a segment with a known equipment issue, or (3) a segment with known inaccurate GPS data identified in the post processing steps. These lines were further reviewed and either statically adjusted or deleted if found to be in error. Out of a total of 1,774 crossings in the survey, 89 percent had offsets ≤ 0.10 m. Digital Elevation ModelThe final point data that composed the Digital Elevation Model (DEM) were transformed horizontally and vertically into North American Datum 1983 (NAD83; CORS96), UTM Zone 16N and North American Vertical Datum 1988 (NAVD88) orthometric height using the GEOID12A geoid model, as well as North American Datum 1983 (NAD83; CORS96), mean lower low water (MLLW). This transformation was accomplished using the National Oceanic and Atmospheric Association (NOAA) VDatum version 3.2 transformation software; the reported vertical transformation error is 5.4 cm. The resulting orthometric height for this survey ranged from -0.01 m to -3.90 m and MLLW values ranged from 0.10 m to -3.83 m. The MLLW point elevations were imported into Esri’s ArcMap version 10.2 and gridded using the “3D Analyst” and “Spatial Analyst” toolboxes. A triangulated irregular network (TIN) was created from the shapefile containing the final point data, and the data were converted into a DEM raster using a natural-neighbors algorithm with a cell size of 10 m and 30 m. A bounding polygon representing the extent of survey tracklines was created and converted into a raster mask, and the interpolated DEM was clipped to this survey extent. The final product was a 10-m DEM of the entire survey with an elevation range from 0.00 m maximum to -3.62 m minimum (fig. 6) and a 30-m DEM with an elevation range from -0.01 m to -3.62 m (fig. 7). 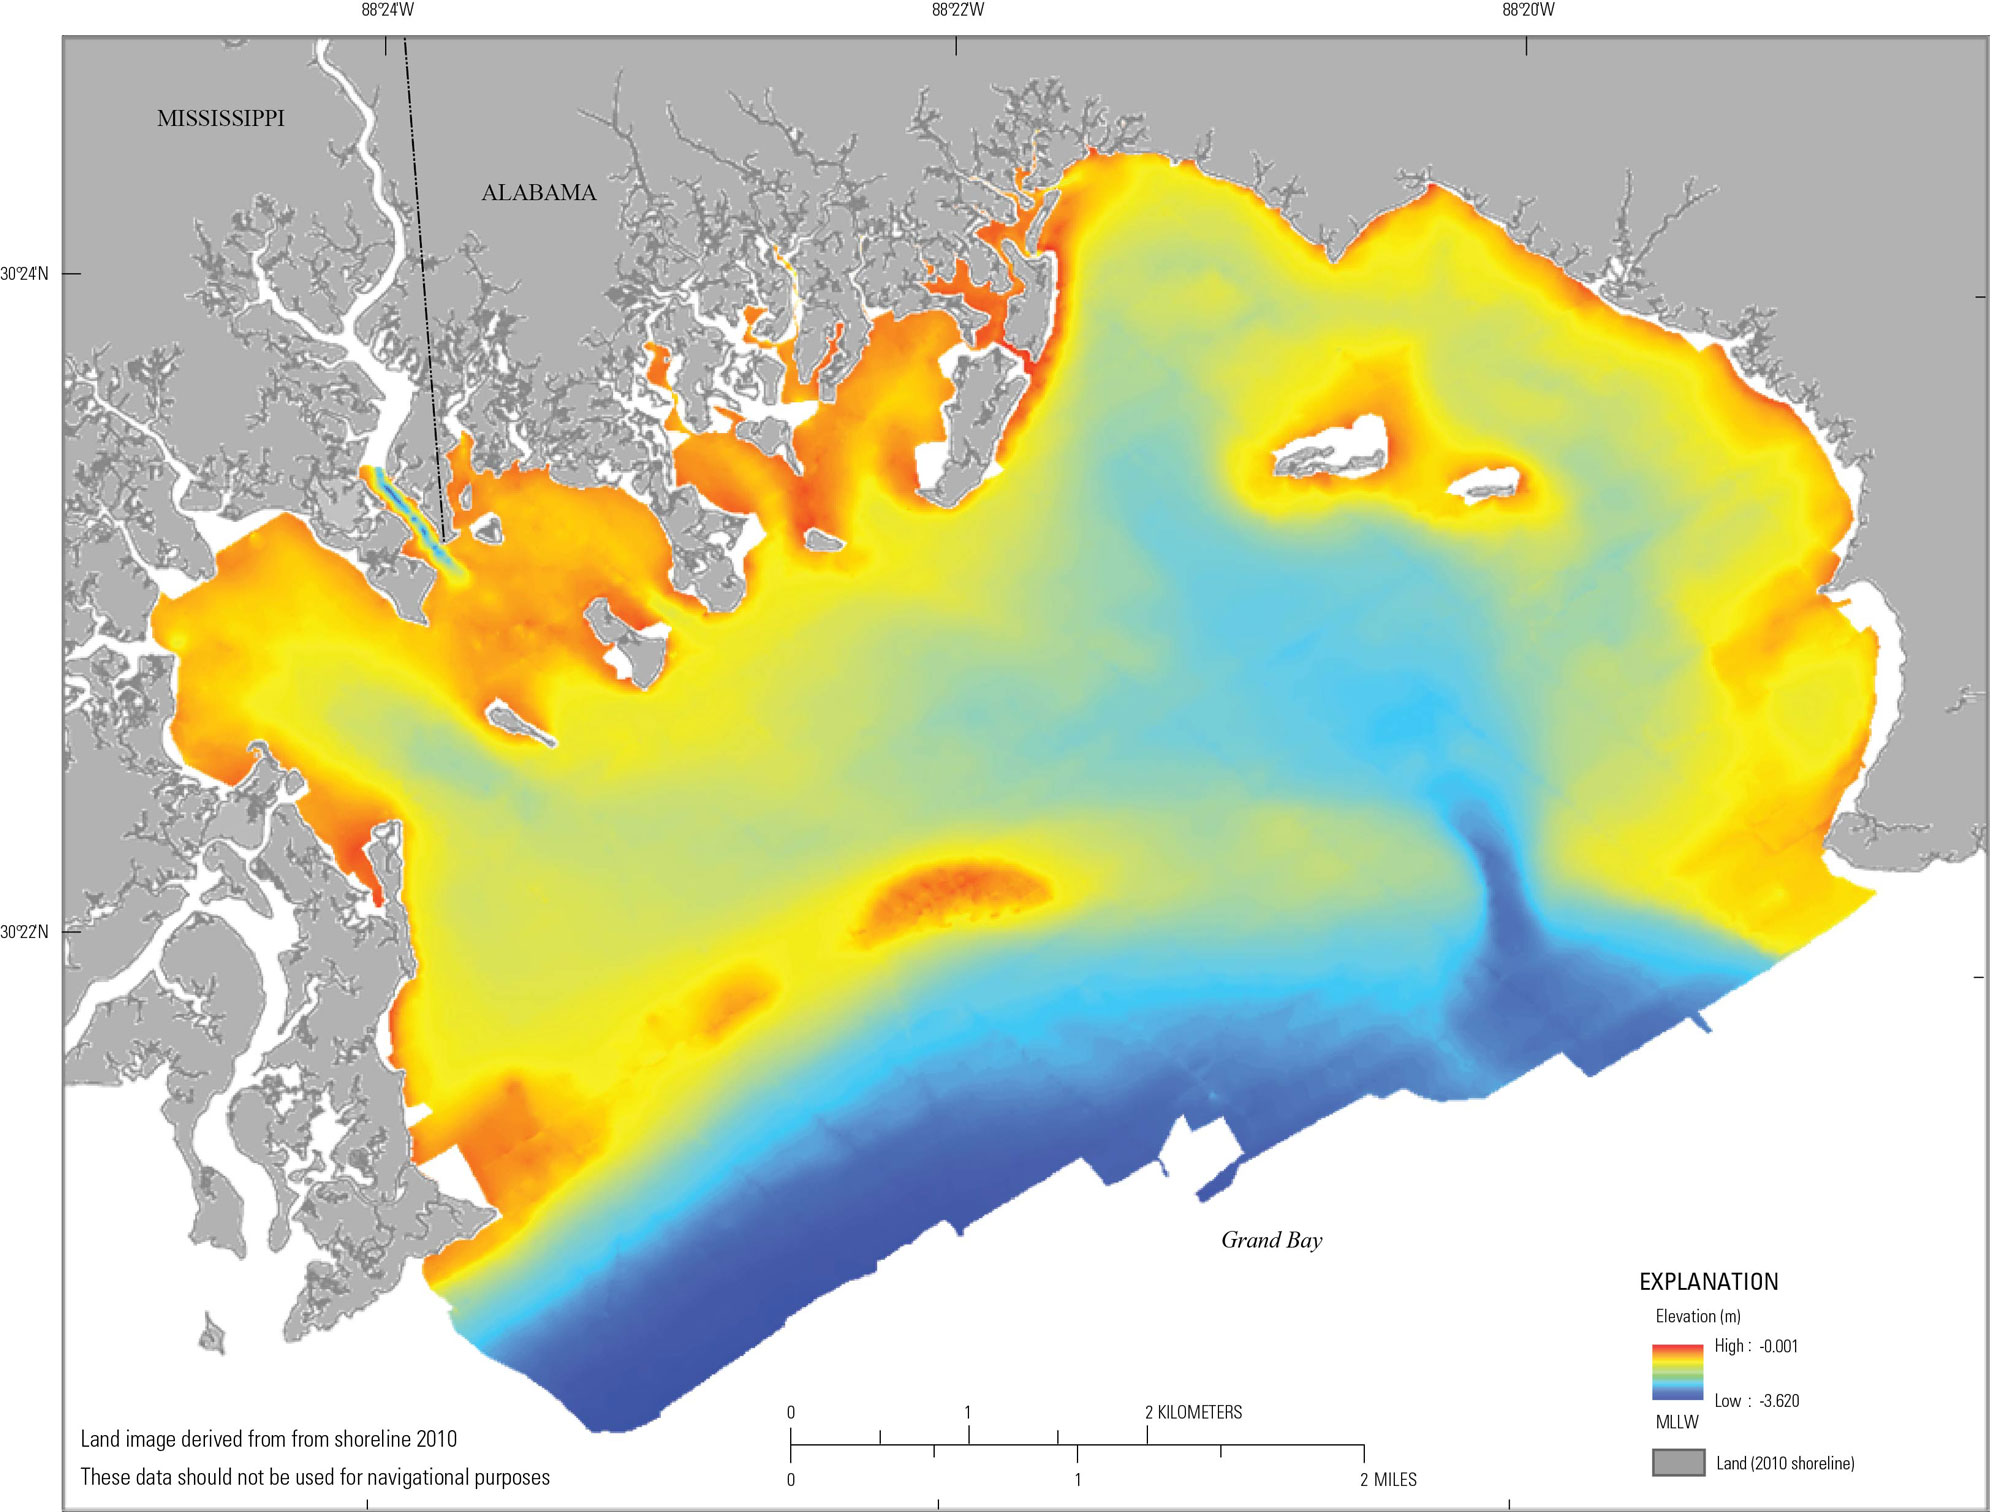 Figure 6. The final 10-meter digital elevation model for the 2015 Grand Bay, Alabama-Mississippi, single-beam bathymetry survey. Horizontal data are referenced to North American Vertical Datum of 1983, Universal Transverse Mercator, Zone 16 North, and the vertical data are referenced to mean lower low water. [Click figure to enlarge] Figure 7. The final 30-meter digital elevation model for the 2015 Grand Bay, Alabama-Mississippi, single-beam bathymetry survey. Horizontal data are referenced to North American Vertical Datum of 1983, Universal Transverse Mercator, Zone 16 North, and the vertical data are referenced to mean lower low water. [Click figure to enlarge] Note: Any use of trade names is for descriptive purposes only and does not imply endorsement by the U.S. Government. |

![]() U.S. Department of the Interior |
U.S. Geological Survey
U.S. Department of the Interior |
U.S. Geological Survey
URL: http://pubsdata.usgs.gov/pubs/ds/1070/ds1070_data-processing.html
Page Contact Information: GS Pubs Web Contact
Page Last Modified: Thursday, 16-Nov-2017 14:04:28 EST
