Data Series 1070
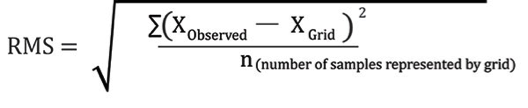
| Error AnalysisDigital Elevation Model ErrorTo evaluate how well the DEM represented the final sounding data, a comparison of the DEM cell values versus the final point elevations was plotted in ArcGIS using a tool that extracts grid values and compares them with those of the overlying point data. The RMS error, representing the difference between the measured depth and the interpolated depth values, was calculated for each platform using the following equation:
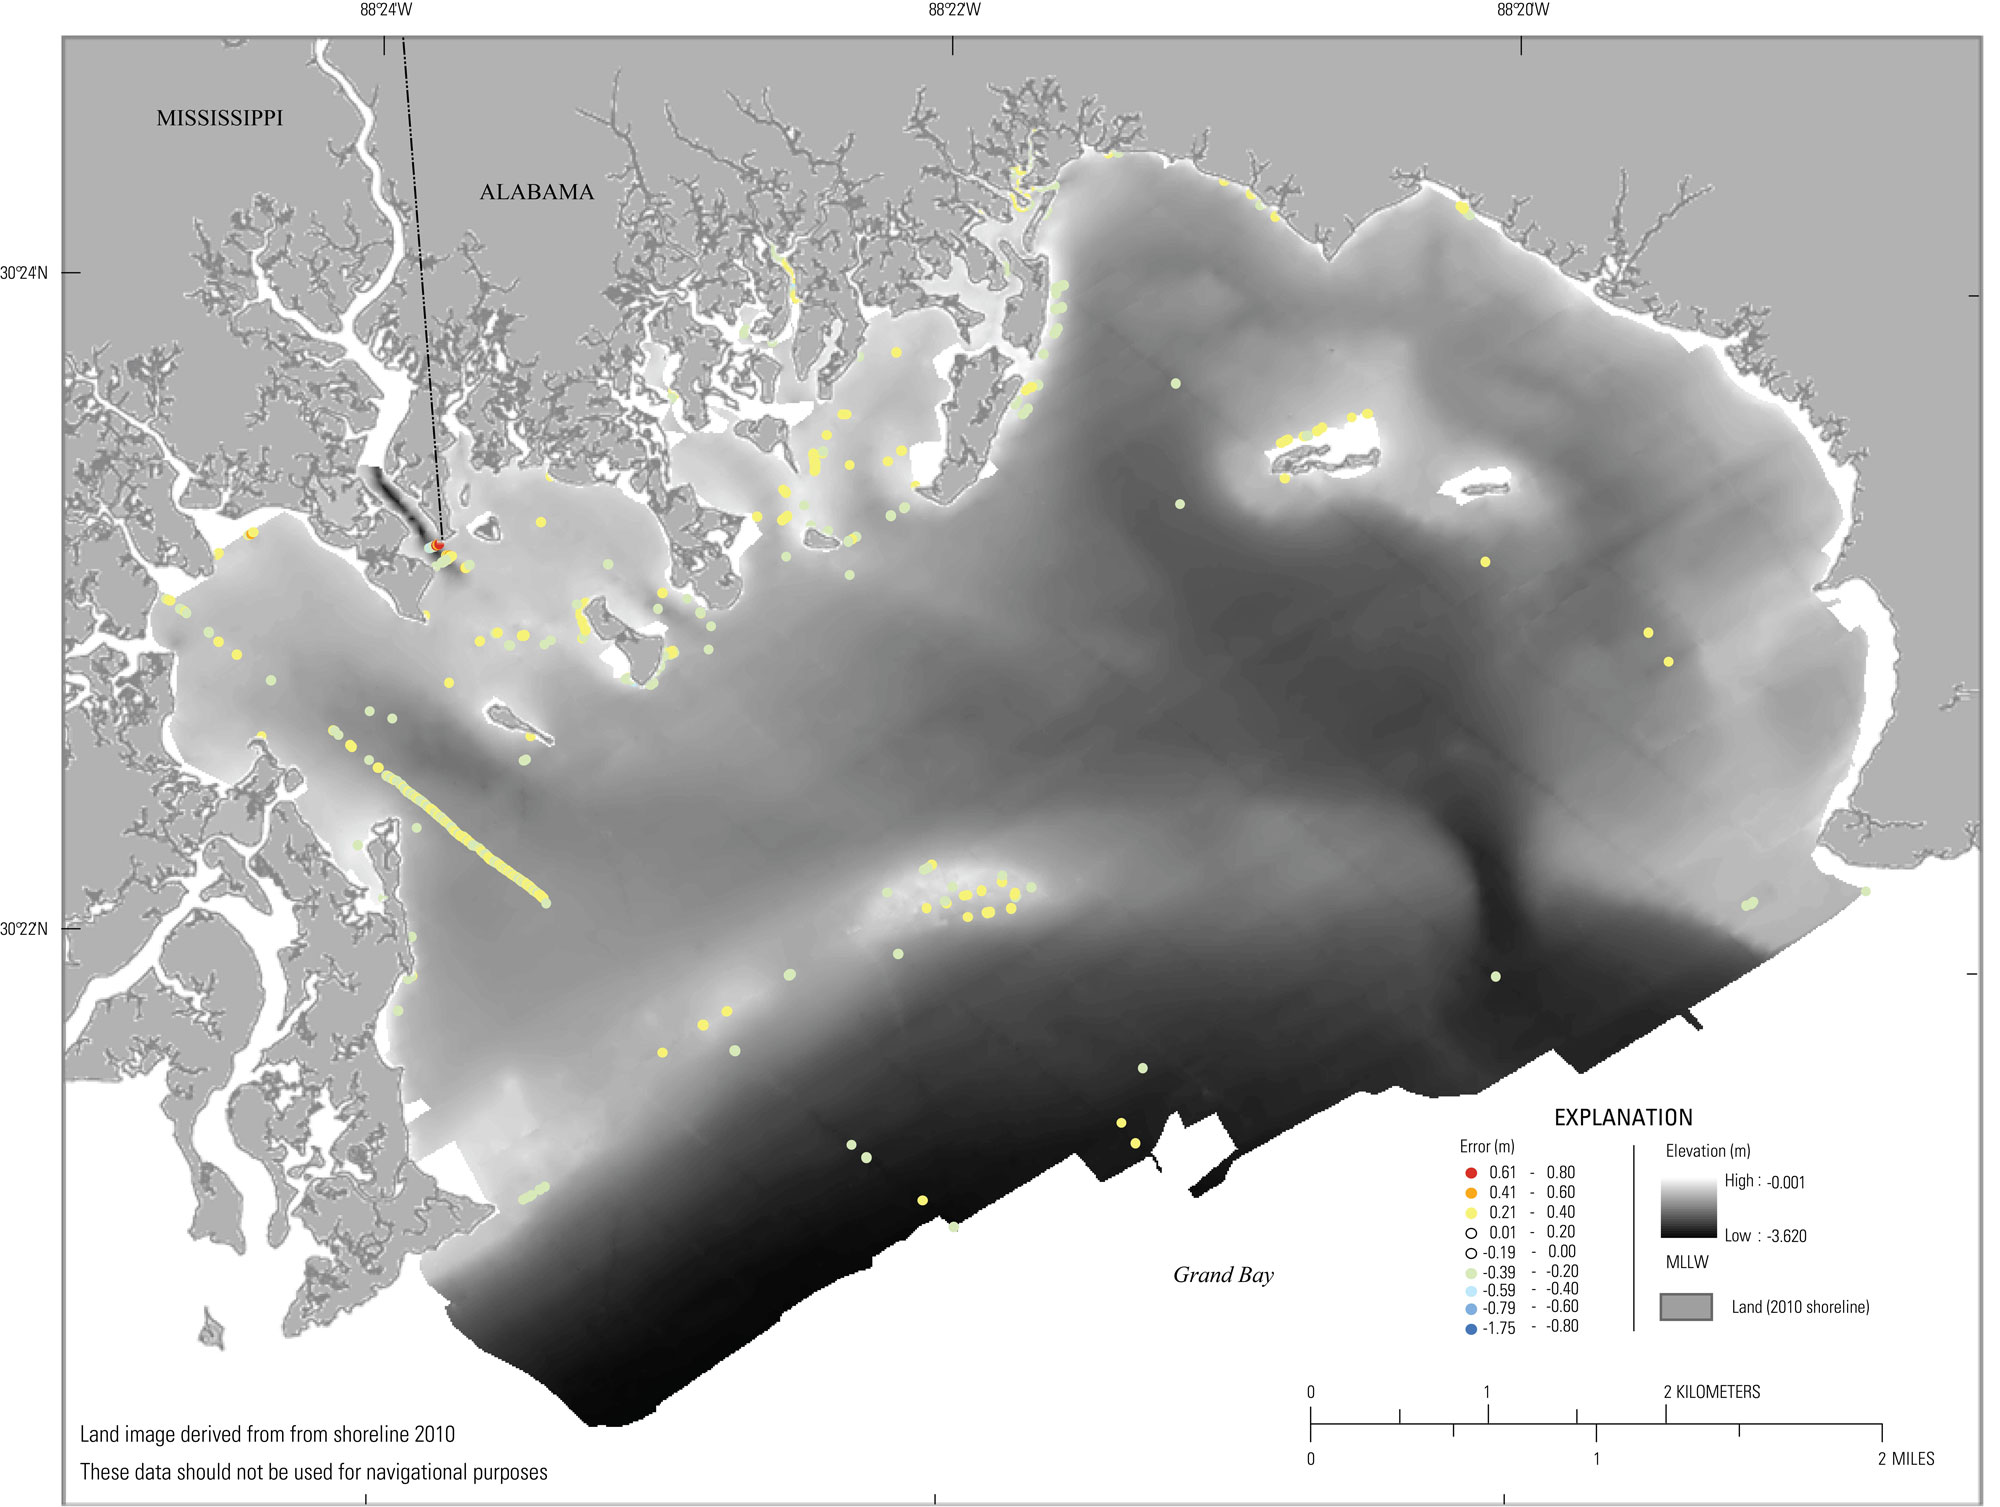
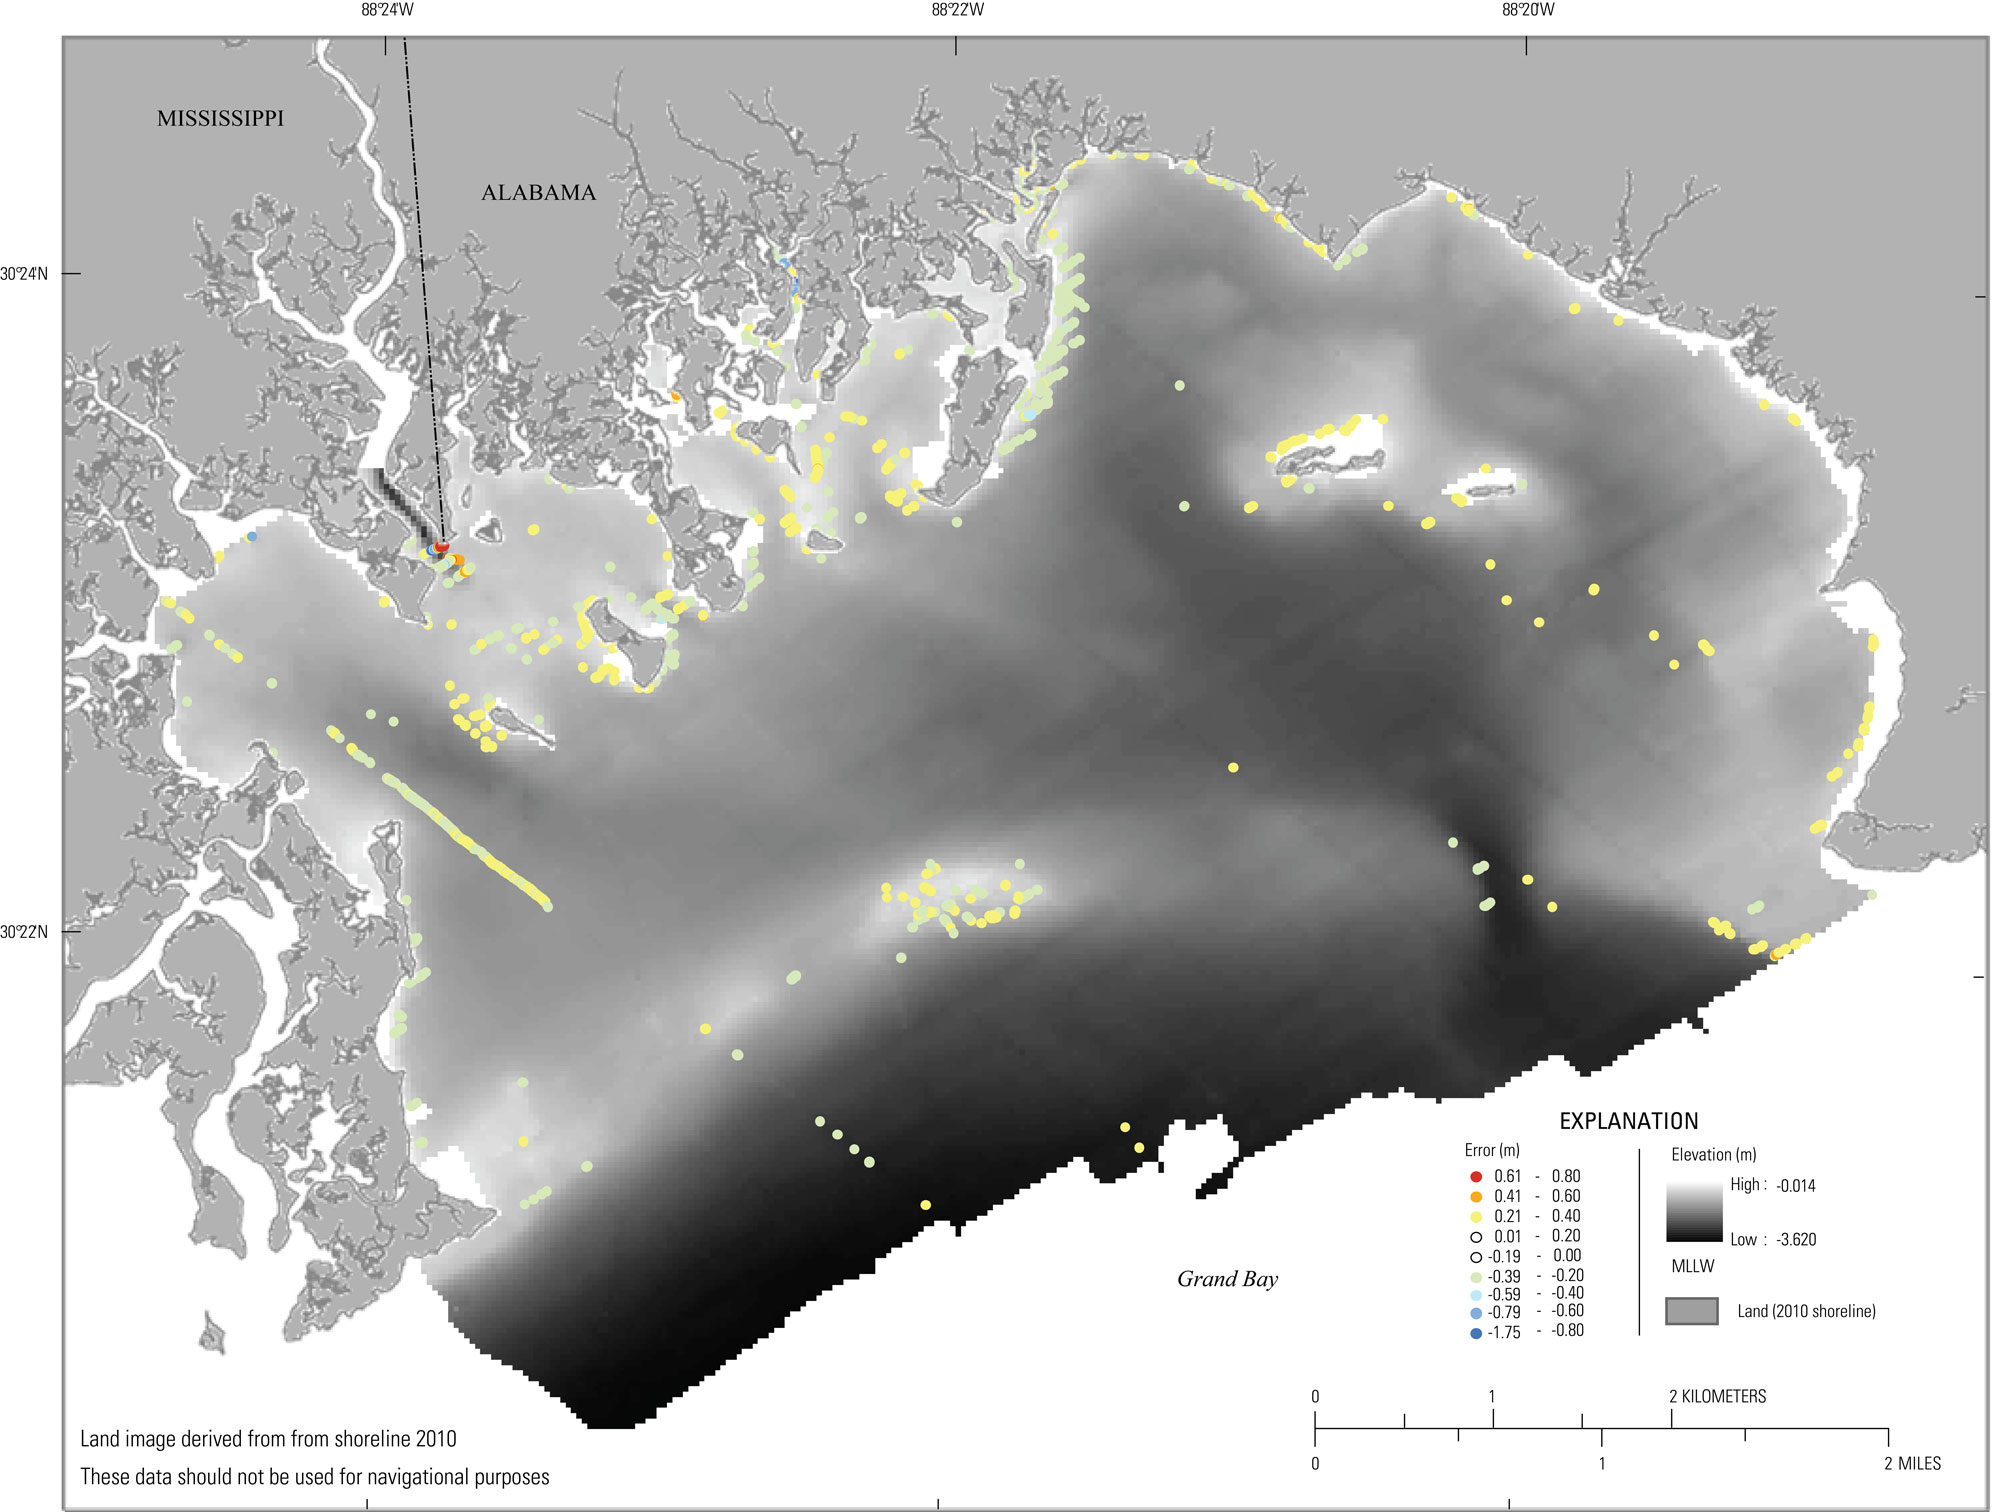
There is a total of 3,699,100 point elevations represented by the 30-m grid, and the root mean square error of all points is 0.07 m. The 10-m grid accounts for 3,782,849 point elevations and has an RMS of 0.04. To represent the spatial distribution of grid error, the difference between the DEM and the original sounding values were plotted, color coded, and overlaid on each DEM (figs. 8, 9).
|

![]() U.S. Department of the Interior |
U.S. Geological Survey
U.S. Department of the Interior |
U.S. Geological Survey
URL: http://pubsdata.usgs.gov/pubs/ds/1070/ds1070_error-analysis.html
Page Contact Information: GS Pubs Web Contact
Page Last Modified: Thursday, 16-Nov-2017 14:04:28 EST