GS-203
Velocity Data, Conductivity and Temperature Data, Temperature-Profile Data, Water-Depth Data, Station Photographs
ADV flow-velocity and MicroCAT conductivity and temperature data are stored as comma-delimited files identified by SITENAME according to the following naming convention:
SITENAME_yyyymmdd_yyyymmdd.xxx
where yyyymmdd represents the start and end date of the data contained in the file, and xxx is the appropriate extension according to the data type, e.g. velocity (.adv) or conductivity and temperature (.ctd).
Temperature-profile and water-depth data are available in Microsoft® Excel (.xls) spreadsheet format files named according to the following convention:
SITENAME_datatype_yyyymmdd_yyyymmdd.xls
where yyyymmdd represents the start and end date of the data contained in the file, and datatype is waterdepth and tempprofile for water-depth data and temperature-profile data, respectively.
Velocity Data
Direct link to directory containing GS-203 velocity data files.
Conductivity and Temperature Data
Direct link to directory containing GS-203 conductivity and temperature data files.
Temperature-Profile Data
Direct link to directory containing GS-203 temperature-profile data files.
| Link to data file | Graphical plot of data |
|---|---|
| GS-203_tempprofile_20000816_20030616.xls | 2000-2001 wet season |
| 2001-2002 wet season | |
| 2002-2003 wet season |
Water-Depth Data
Direct link to directory containing GS-203 water-depth data files.
| Link to data file | Graphical plot of data |
|---|---|
| GS-203_waterdepth_20000816_20030616.xls | Image |
Station Photographs
Click on any thumbnail to view the full-resolution image.
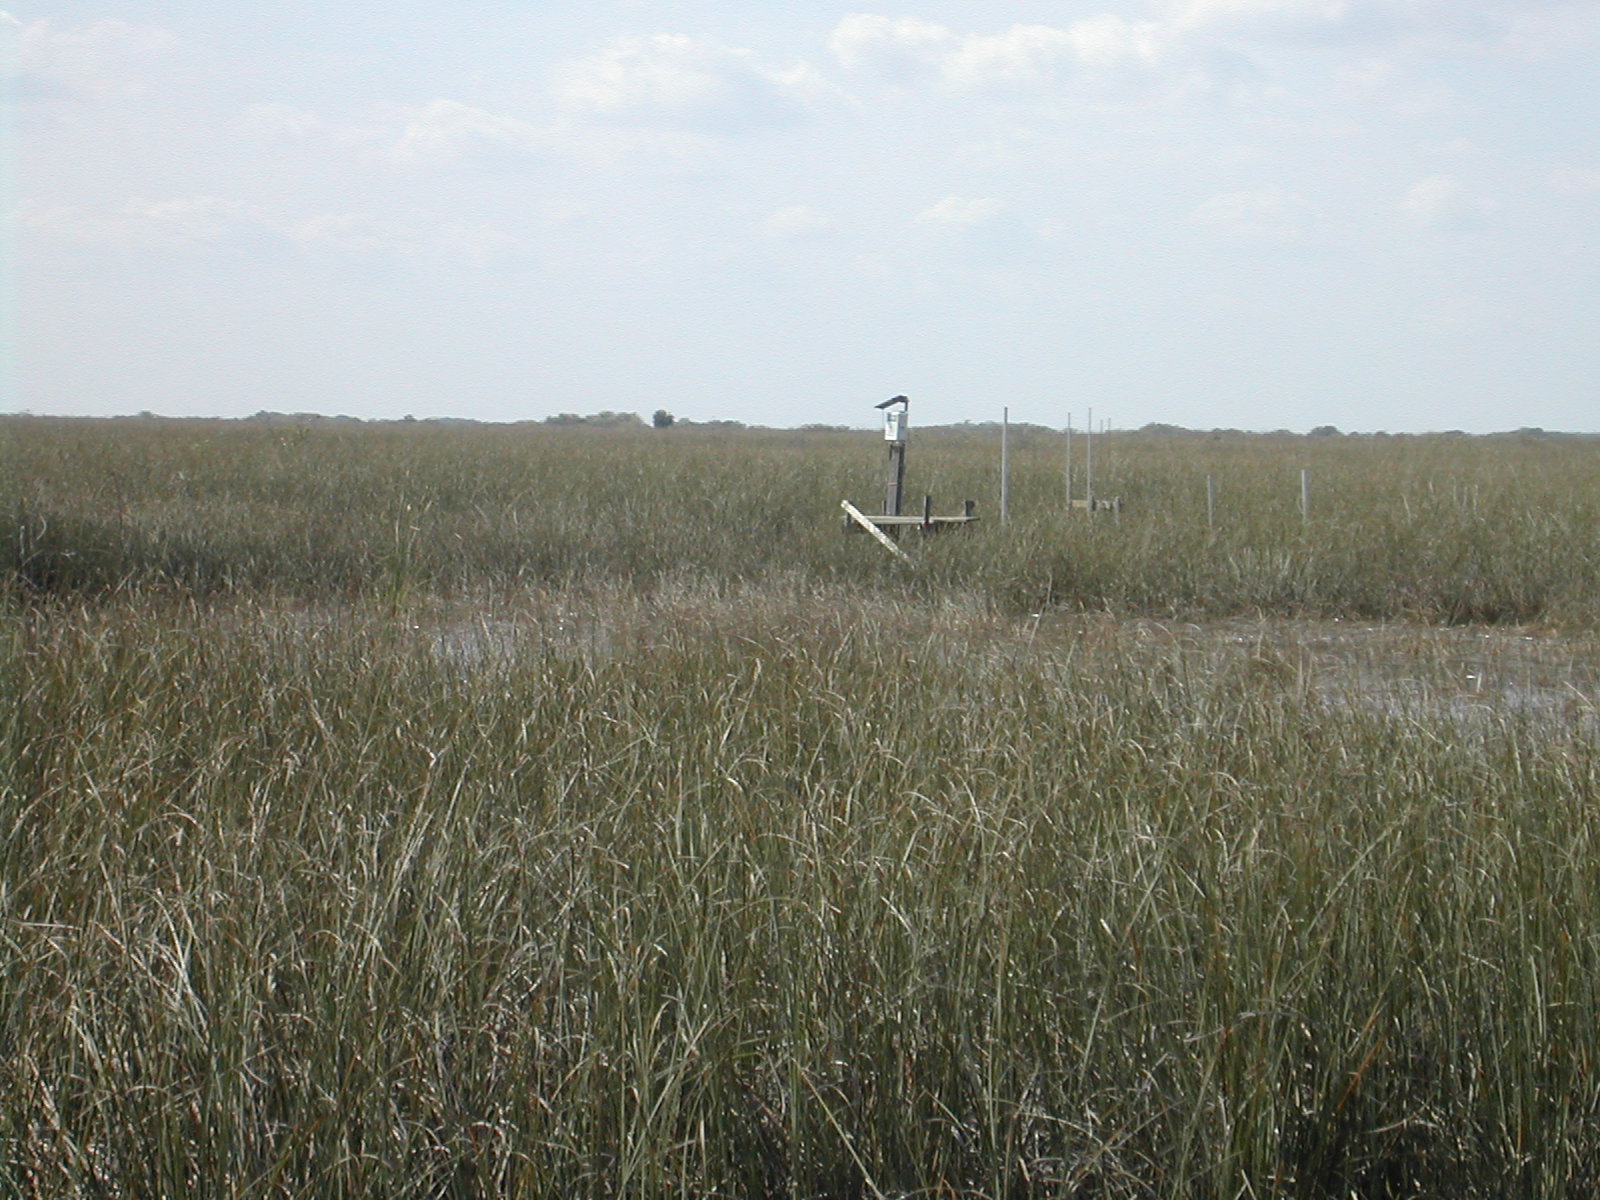
Monitoring station GS-203. Photograph taken February 12,
2002.
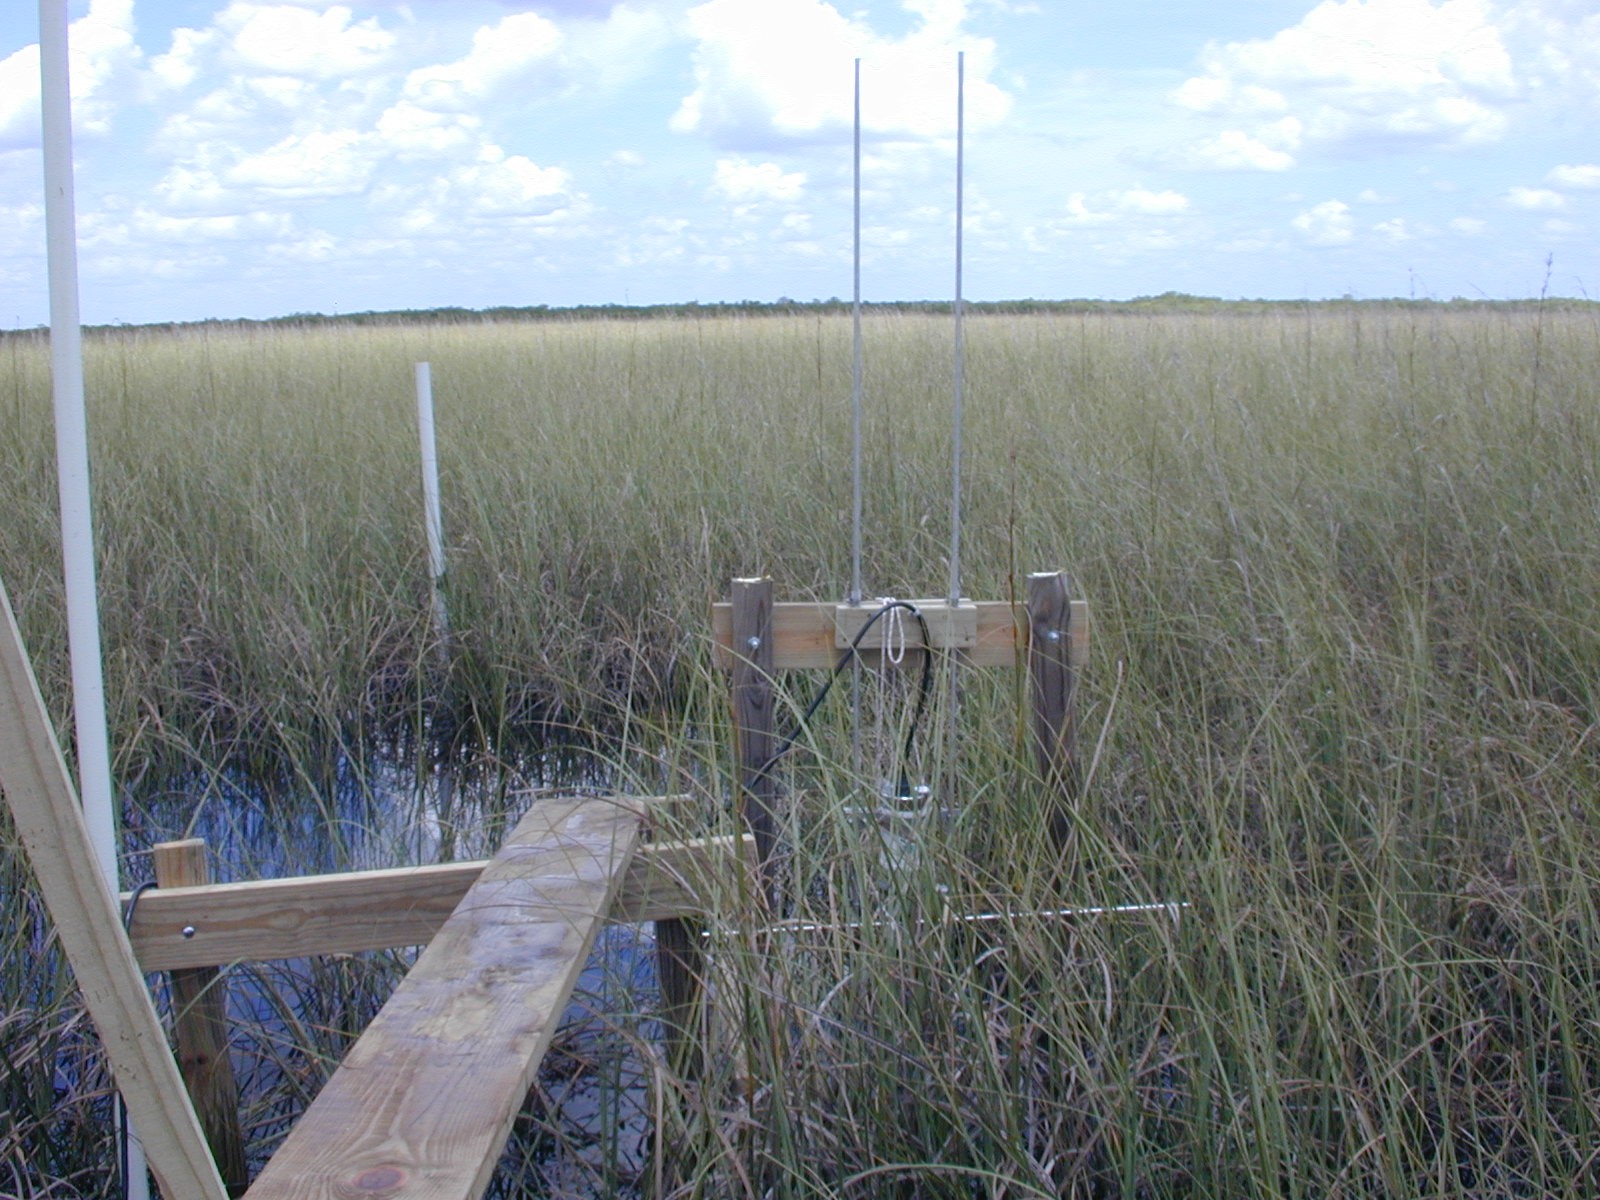
ADV meter at GS-203. Photograph taken August 16, 2001.
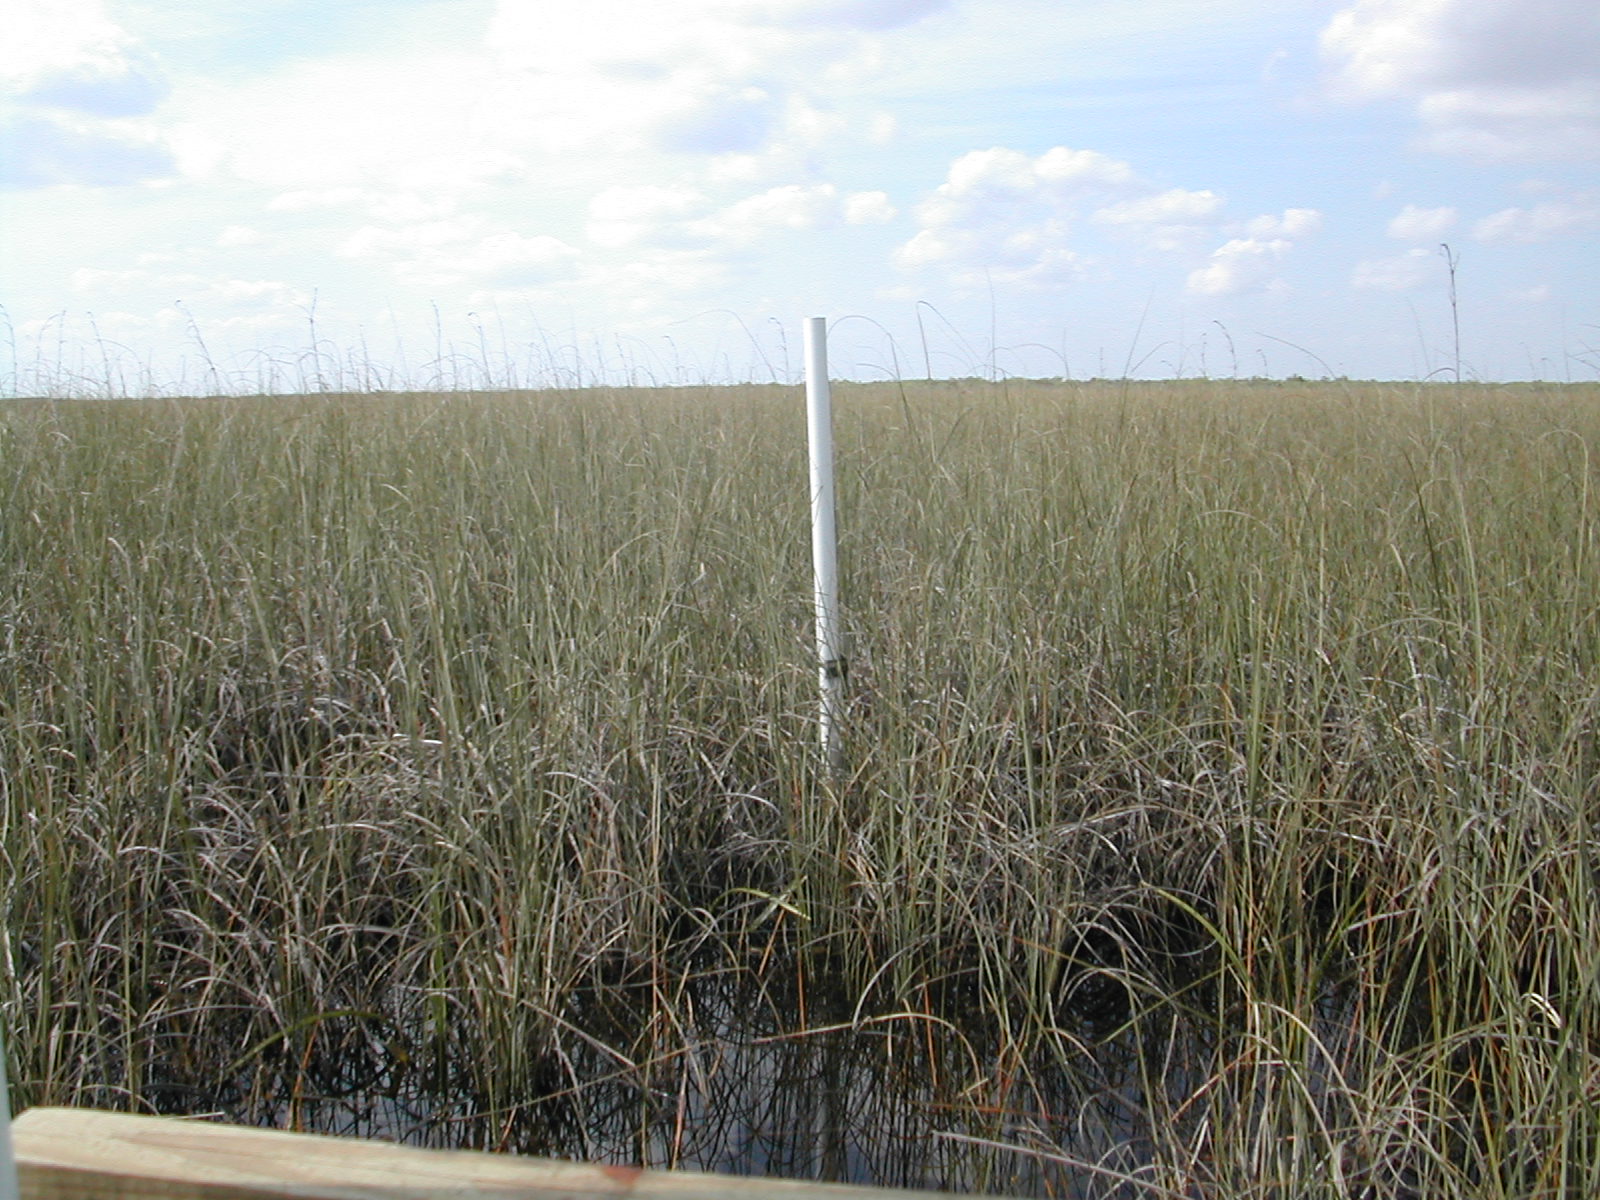
Thermistor string at GS-203. Photograph taken February 12,
2002.
360° panoramic view taken February 13, 2002.
U.S. Department of the Interior, U.S. Geological Survey, Reston, VA, USAContact: Raymond W. Schaffranek