Study Area and Station Description
Shark River Slough is the dominant path of surface-water flow in ENP. Shark River Slough conveys inflows discharged through road culverts and hydraulic structures along Tamiami Trail to the coastal mangrove ecotone of the southwest Gulf Coast of Florida (fig. 1). The freshwater wetlands of Shark River Slough are a mixture of tree islands, sawgrass marshes, wet prairies, and sloughs that affect the conveyance of water to the coast. Five monitoring stations (SH1, GS-203, GS-33, NP202, and GS-36) were established between 1999 and 2002 to evaluate flows and related hydrologic conditions in differing vegetative communities in Shark River Slough. Locations of the monitoring stations are shown in the satellite image below.
At four of the five monitoring stations (SH1, GS-203, GS-33, and GS-36), flow velocities were measured at a fixed point in the water column. At all five stations, temperatures were monitored in the plant litter, throughout the water column, on the water surface, and in the air immediately above the water surface. At three of the four flow-velocity measuring stations (GS-203, GS-33, and GS-36), water temperatures and conductivities also were monitored at a fixed point in the water column.
All monitoring stations were co-located with or near existing hydrologic-monitoring stations to provide water-level data for flow analysis. Station coordinates, descriptive locations, monitored parameters, and vegetative characteristics for the five monitoring stations are listed in the table below. Photographs of vegetation at the monitoring locations are available on the station pages, accessible by station name in the image and table below.
Click on the monitoring station name (SH1, GS-203, GS-33, NP202, GS-36) in the map below to access the data, a graphical plot of the data, and site photographs, or access the data by type in the Data Access section.
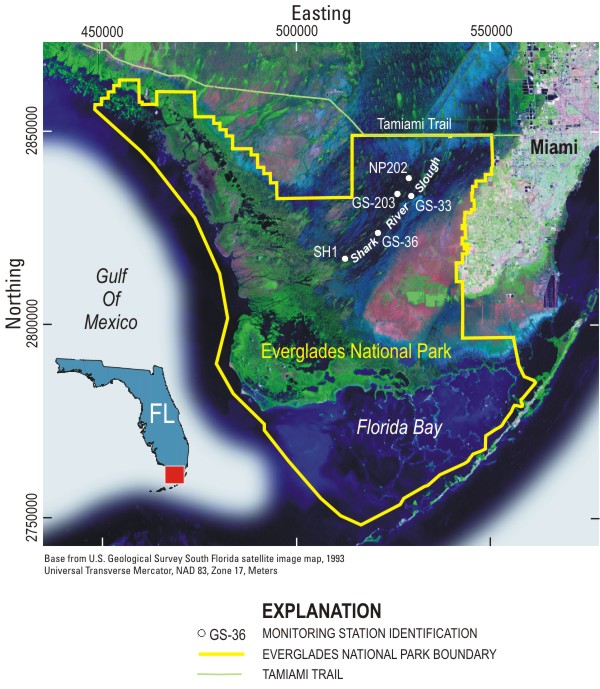
Figure 1. Satellite Image of South Florida
showing locations of monitoring stations in Everglades National
Park, 1:500,000 scale.
Click on a linked station name in the table below to access data files, a graphical plot of the data, and photographs for each station.
Table 1. Coordinates, locations,
monitored parameters, and vegetative characteristics for the
monitoring stations.
[UTM: Universal Transverse Mercator; NAD: North American Datum; m:
meter]
| Station Name | UTM Coordinates | Location | Parameters Monitored | Vegetation | |
|---|---|---|---|---|---|
| NAD 83, Zone 17 | |||||
| East (m) | North (m) | ||||
| SH1 | 515249 | 2817258 | 10 m southwest of SH1 hydrologic station | flow velocity, temperature-profile | medium-dense spikerush |
| GS-203 | 526133 | 2833920 | 160 m from NP203 hydrologic station at 22.7 degrees west of south | flow velocity, conductivity and temperature, temperature profile | medium-dense sawgrass |
| GS-33 | 529637 | 2833457 | 440 m from P33 hydrologic station at 30.6 degrees west of north | flow velocity, conductivity and temperature, temperature profile | medium-dense spikerush and periphyton |
| NP202 | 529245 | 2838450 | Co-located with NP202 hydrologic station | temperature-profile | dense cattail |
| GS-36 | 520563 | 2823605 | 136 m from P36 hydrologic station at 21 degrees east of north | flow velocity, conductivity and temperature, temperature profile | sparse spikerush and periphyton |
Contact: Raymond W. Schaffranek