Influence of Cooling on Lava
Temperature
|
|
Figure 16. Click on figure for larger image with
caption.
|
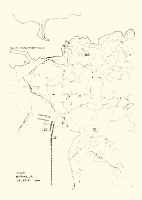
Five boreholes were drilled in the new lava, four in areas that
had been cooled non-uniformly and one in an area which had not been
cooled. The positions of the boreholes are shown in fig. 16, and the results of the temperature
measurements in fig. 17 and fig. 18. Figure 16 also
shows the position of trenches that were dug all along
Helgafellsbraut in order to avoid having vapor [e.g., steam, carbon
dioxide, and other gases] spread any farther [to the west] along
the former surface [contact between the old land surface and new
overlying tephra].
|
|
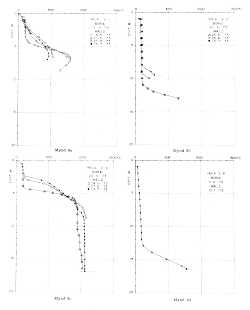
Figure 17. Click on figure for larger image with
caption.
|
On 12 May, a drill was sent to Vestmannaeyjar from Orkustofnun
[National Energy Authority]. The drilling proceeded well, and a
total of five 10-25-m-deep holes were drilled into the lava and
three into the area west of the lava edge
Figure 16; one of the holes [borehole V] was 35 m deep. People
from the State Drilling Contractors had the unique opportunity into
drill in red-hot lava. It is only known to have been done once
before in Hawaii [e.g., Alae lava lake, Kilhauea caldera, Hawaii.
See Peck, D.L., 1978, Cooling and vesiculation of Alae lava lake,
Hawaii: U.S. Geological Survey Professional Paper 935-B, 59
p.].
The drilling was started where the lava had been cooled the most
[borehole I], for example, [just up onto the lavas south of]
Fiskiðan hf. [fish-processing company]. The next borehole
[borehole II] was in an area that had been cooled a little less and
the 3rd one [borehole III] in an area where no cooling had been
tried at all Figure 16. Borehole IV, which
was close to Vilpa [see Figure 3 in the
Introduction] showed very similar results as from borehole II, and,
therefore, its temperature profile is not shown.
|
|
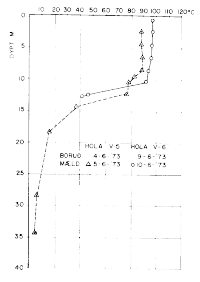
Figure 18. Click on figure for larger image with
caption.
|
Borehole V, VI and VII were drilled in the area where lava had
not flowed, [but was covered by a layer of tephra]. These three
boreholes were drilled because of the intense heat that formed in
the soil west of the lava edge. The houses had started to
deteriorate from the heat. [Also, the new hospital was situated
just to the west Figure 16.] In boreholes
V and VI Figure 18, the temperature of the
soil was 100 ºC. at 10-m depth, but dropped to a near-surface
[ambient] temperature in the next 5 to 10 meters. Borehole VII,
which was south of the new hospital, showed on the other hand, a
temperature of 4 ºC. from the surface to the bottom.
The last borehole, borehole VIII, was drilled into the lava east
of Skans [Figure 3 in the Introduction],
but that was the only one drilled beyond [northeast of] the former
coastline of the island. Much cooling had been carried out there,
within a relatively small area, when Sandey was pumping
[seawater onto the lavas] there; the temperature of the lava was
100 ºC. from the surface to a depth of 13 m.
If a theoretical cooling of a lava field, based on air cooling
only, is studied in order to realize how rapid the cooling is, one
may look at a simple model of a smooth and thick lava field that
originally was a lava flow. In the beginning, the temperature is
the same all through the lava flow; i.e., 1050 ºC. Temperature
measurements performed [by us] support this [theoretical
calculation].
|
|
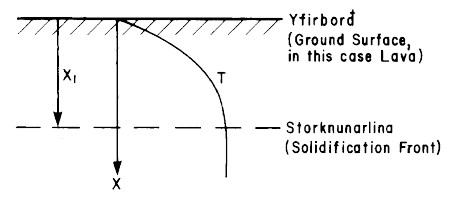
Figure 19. Diagram showing the lava surface,
temperature (T) profile, original thickness of molten lava (X),
lava-solidification front (dashed line) migrating downwards over
time, and thickness of solid lava.
|
The heat-transfer-equation of solidifying rock is:
If the following value for specific heat at constant pressure
for solidifying rock is used:4
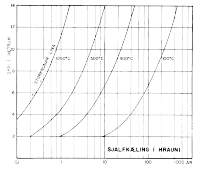
one arrives at an answer that is shown in figure 20, where the
depth of the lava in meters is a function of the time in years.
|
|
Figure 20. Click on figure for larger image with
caption.
|
The two plus signs on figure 20 show the temperature in
borehole III, where the lava was not cooled. Theoretical cooling of
the lava is slightly faster than this result of measurements
indicates, because the effect of rainfall was not taken into
consideration. Average rainfall in the Vestmannaeyjar is about 1.5
m a year, which corresponds to the cooling of one meter of lava
down to 100 ºC. a year, if all rainwater vaporizes. If the
effect of the seawater cooling from the holes drilled is studied,
it will be noticed that the cooling was 50-100 times faster in
those areas compared with self-cooled lava.
[an error occurred while processing this directive]
|