Lava-Cooling Operations During the 1973 Eruption of Eldfell Volcano,
Heimaey, Vestmannaeyjar, Iceland
U.S. Geological Survey Open-File Report 97-724
|
|
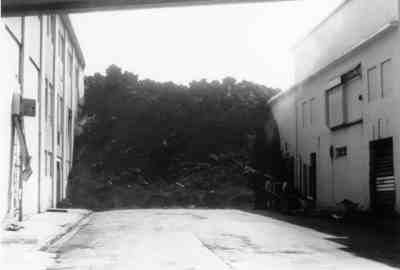
Effect of Cooling on Lava Movement As has been stated, the lava flows were constantly moving in varying degrees during the cooling operations. The movement decreased progressively, especially where the cooling took place.
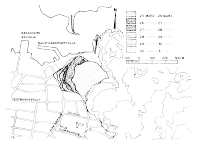
Figure 21 shows the lava movement within the center of Vestmannaeyjar on 25-31 March. The movement is at its peak during the night of 26 March, because very little cooling was done due to the salvage of pipe sections before the advancing lava-flood [overran them]. On 28 March, cooling was started again, and on 29 March the water discharge was 400 l s-1. All pumping was concentrated on this lava edge. On 31 March, the lava has just entered the street between the fish-processing plants [Fiskiðjan hf. and Ísfélag Vestmannaeyja hf.; see fig. 3 and fig. 22], and after that, the movement of the lava edge is minimal 5.
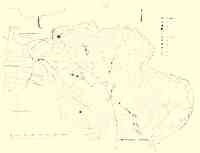
Figure 23 shows the movement of the lavas for a period of about five weeks, or from 25
March to 30 April. It should be mentioned that it was extremely hard to measure the lava flow
during this period, because it became difficult to place markers because of steam that formed as a
result of the cooling. Even though moveable markers are few, it is possible to obtain a fairly
clear picture of the lava flows. In determining the movement of these markers, a theodolite was
depended upon as well as vertical aerial photographs. Figure 24 (below) shows lava-cooling operations
closest to the Eldfell crater.
If the most westerly marker (A) is analyzed, it can be seen that the lavas moved extensively between 27 and 31 March, or about 150 m. During the next four days, the movement was 76 m, or 19 meters each day on the average. This speed was maintained until 6 April, but then the effect of the cooling of the lava [from pipes along] Sólhlíð starts to be felt, and by 9 April there is no further movement of this marker. The next marker (B) is on the lava flows east of Skans, that was cooled in the beginning of March. There was no more movement there. The next two markers (C) and (D), show clearly the effect of the cooling on the direction the lava took. Marker (C) was emplaced on 27 March and observed until 31 March. On 1 April, extensive cooling was started along the road (dashed lines) north of marker (C), so it was not possible to measure the movement of that marker after that because of [obscuration by] steam. On 25 March, another marker (D) was placed approximately 300 meters southeast of marker (C). In the beginning, the lava seemed to flow in the same direction at those two markers. On 6 April, marker (D) has arrived where marker (C) was on 27 March, but then it changes direction to the north, most probably because of the cooling, and maintains that direction until 30 April, when it stopped [moving]. Marker (E) shows that there is still a slight movement of the lava field south of Flakkarann, and that it is pressing on it. Fissures formed on the lava crust in an area approximately 50-m wide; their length was about 5 m with a height of 2-3 m from the bottom of the fissure to the top.
Other markers are in an area which was not cooled, and they seem to indicate that the lava
speed was considerably more there than in the cooled lavas. In preparing this article, data was
used from Landmælingar Íslands [National Land Survey of Iceland], Orkustofnun [National
Energy Authority], and Forverk hf. [private company]. It is not an easy task to calculate exactly the cost of the cooling, because it is very hard to distinguish between the various tasks. As an example, the cost of building a rampart of tephra at the beginning of the eruption is not considered a cost related to the cooling. On the other hand, the retaining wall near Vilpa, which still exists, is included in the cost. In the beginning it was difficult to separate salaries of people working on the lava cooling and others doing salvage and rescue work, because some people worked on both projects and consequently these figures can only be estimated. By March, this [mixing of tasks] has become less of a problem. Table 3 is a summary of costs. It is divided into five sections: contracted services; salaries; materials; gasoline and oil; and pumping equipment. Contracted services amounts to 24 million Icelandic kronur or 17.8 percent of the total cost. The biggest item included is to Björgun hf. for the dredge Sandey or 7.55 million Icelandic kronur. Next is Vita- og Hafnamáskfrifstofan [State Lighthouse and Port Authority] with an amount of 2.26 million Icelandic kronur paid for barges and machinists, and Orkustofnun [National Energy Authority] with an amount of 1.13 million Icelandic kronur [expended] for drilling [operations] and workers [salaries, travel costs, and per diem]. The engineering services were mainly divided between a few firms, and the engineering-service costs covers both work in Vestmannaeyjar and on the mainland. The firms mostly used were: Hönnun hf. Verkfræðistofa FRV, Vermir hf., and the firm of Þórhallur Jónsson. Vélsmiðjan Héðinn hf. undertook the fabrication of various new items, especially connectors, as well as making replacement shafts for the ones that broke.
Miscellaneous services includes payments of less than 1 million Icelandic kronur to various
parties. The majority of those were machine shops that offered their services for a limited time
during the installation of the [high-capacity pumping] equipment from the United States. Salaries totaled about 34 million kronur, or a little more than 1/4 of the total cost. These are salaries to all people registered with Viðlagasjóður [State Disaster Relief Fund]. Materials, mostly in connection with pipes and valves, amounted to 16.5 million Icelandic kronur, which is a little less than 1/8 of the total cost. Gasoline and oil for the engines that were connected to the pumps amounted to 1/8 of the total cost. The last item and the largest totaled 44 million Icelandic kronur, which is a little less than 1/3 of the total cost. Included in this amount is the estimated value of pumps and pumping equipment, some of which were borrowed. About half of the pumps were borrowed; all of these were diesel pumps. They were returned in December 1973. At the time that this article was written, the cost of the transactions with the United States has not been finally settled. It is estimated that the cost of the pumps that were not returned, because the United States declared that they do not need to be returned, is about 25 million Icelandic kronur. The Viðlagasjóður [State Disaster Relief Fund] put up this amount as a security deposit when the shipment [of pumps] arrived.
The total cost of the lava cooling amounted to 135 million Icelandic kronur, or a little less
than 22 Icelandic kronur per metric tonnes of seawater pumped. If it is estimated that the average
distance was about 1 kilometer, then this is not much compared with other means of
transportation, especially when unfavorable circumstances are taken into account.
3Valdimar Kr. Jónsson and Matthías Matthíasson, 1974, Hraunkæling á Heimaey - Verklegarframkvæmdir [Lava cooling on Heimaey - Methods and Procedures]: Tímarit Verkfræðingafélags Íslands, v. 59, no. 5, p. 70-81 and p. 83. English translation by Sigrún Rockmaker, Foreign Service Institute, U.S. Department of State. Additional translation and edit by Richard S. Williams, Jr., U.S. Geological Survey, Woods Hole Field Center, Woods Hole, Massachusetts 02543-1598. 4 Pálmason, Guðmundur, 1973, Kinematics and heat flow in a volcanic rift zone with application to Iceland: Geophysics Journal of the Royal Astronomical Society, v. 33, p. 451481. 5 See also the two photographs taken by Richard S. Williams, Jr., U.S. Geological Survey, of the street between Fiskiðan hf. and Ísfélag Vestmannaeyja hf. (two fish-processing companies) [Williams and Moore, 1983, p. 10 (23 July 1973) (also reproduced here as fig. 22 ) and fig. 11 (7 July 1974)]. The photographs were taken from under the elevated passageway between the two buildings. 6The monetary exchange rate at the time of preparation of Table 3 is estimated to be 93 Icelandic kronur = $1 U.S.; e.g., 134,640,000 Icelandic kronur = $1,447,742 U.S | ||||||||||||||||||||||||||||||||||||||||||||||||||||||||||||||||||||||||||||||||||||||||||||||||||||||||||||||||||||||