|
Sidescan-Sonar Imagery of the Shoreface and Inner Continental Shelf, Wrightsville Beach, North Carolina
|
Methods
The digital sidescan-sonar survey presented here was conducted in March 1994, using a Klein 100 kHz sidescan-sonar system. The survey provides continuous coverage of the sea floor over a 32-kilometer2 area of the shoreface and inner shelf. For this survey, the swath width per trackline was 200 meters (m). Ship tracklines were spaced 160 meters apart to provide overlapping coverage between tracklines. The sidescan-sonar data were logged digitally at a sampling rate that resulted in a 0.1 m pixel size in the across-track direction following the methodology outlined in Danforth (1997). A median filtering routine (Malinverno and others 1990) was applied to the sidescan-sonar data to remove speckle noise, resulting in a 0.4 m pixel size. The data were further processed and mosaicked using procedures described in Danforth (1997) and Paskevich (1992), resulting in an image-enhanced, geographically correct, sidescan-sonar mosaic of the study area. This mosaic depicts areas of high acoustic backscatter as light to white-colored, and low acoustic backscatter as dark to black-colored.
A differential Global Positioning System (DGPS) with real-time correction was used for navigation during the survey. This system yielded a horizontal accuracy of ± 3 m for the bathymetric data and sample locations. The sidescan towfish, however, was not navigated independently of the ship. Thus, an additional maximum horizontal positioning error of approximately 5 m exists in the sidescan imagery.
A hull-mounted fathometer was used to record bathymetric data during the survey; all bathymetric data were processed to remove water depth variations due to vessel heave and tidal fluctuations. The vertical resolution of the bathymetric data is about 50 cm. The data were gridded and contoured using the GMT software package (Wessel and Smith 1991).
Over 200 diver vibracores up to 3.5 m in length have been obtained in the study area (Figure 3; see also Thieler 1997). The locations of most cores were determined using either high-accuracy Mini-Ranger or DGPS. The remaining cores were located using a combination of standard GPS and LORAN-C.
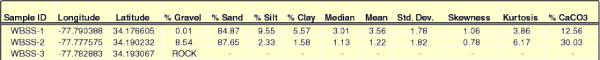
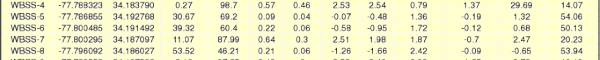
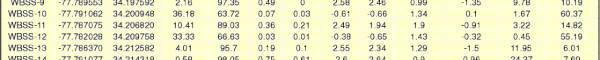
A suite of Shipek grab samples was collected at the time of the sidescan-sonar survey to groundtruth the acoustic facies identified on the imagery (Figure 1). Additional sediments samples (Figure 3) were obtained by divers at each vibracore location. Grain size analyses of all sediment samples were conducted using a combination of wet sieve and Coulter Counter techniques following the methodology of Poppe and others (1985) (Table 1, see table below).
 |
 |
 |
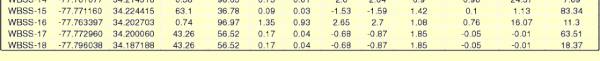 |
Table 1. Grain size data for the surface grab samples shown in Figure 1. Click on table to zoom in. |
Fourteen transects on the shoreface and inner shelf were surveyed by divers using weighted lines and buoys at positions located by real-time DGPS (Thieler 1997). The ability to consistently occupy the target features or contacts between sediment types confirmed the geographic accuracy of the sidescan-sonar mosaic described above. Diver observations included photography and videography, mapping of sediment type, bottom morphology (e.g. , bathymetric variations, ripple dimensions and orientation) and probing sediment thickness using a steel rod or crowbar. Similar observations were made around each vibracore location.
Vibracores were split, described, and subsampled for grain size analysis, radiocarbon and amino-acid race mization dating. A video camera and computer frame grabber software were used to obtain digital images of each core in approximately 15-centimeter sections. Epoxy peels were made of selected cores in order to examine small-scale stratigraphy.
 |
Based on E. Robert Thieler, William C. Schwab, Mead A.
Allison, Jane F. Denny, and William W. Danforth, Sidescan-Sonar Imagery of the
Shoreface and Inner Continental Shelf, Wrightsville Beach, North Carolina: U.S. Geological Survey Open-file Report OF 98-616.
|
Web page: Donna
Newman
[an error occurred while processing this directive]
|
|