
| Environmental Geochemistry and
Sediment Quality in Lake Pontchartrain |
II. Database Structure and Development (con't)
C. Data Sources and Locations
Data collection locations from historical and more recent sources are shown in the map
below (Fig. 4), taken from Manheim and others, 1997.
The full USEPA - EMAP data set (Louisiana, 1991-1994 field seasons) is not included in
this map. This data set is, however, incorporated in the sediment database (Appendix D) and the station locations are reflected in the opening illustration for this section. The area code index map (Fig. 5) provides geographical names for specific parts of Lake
Pontchartrain and other waterways.
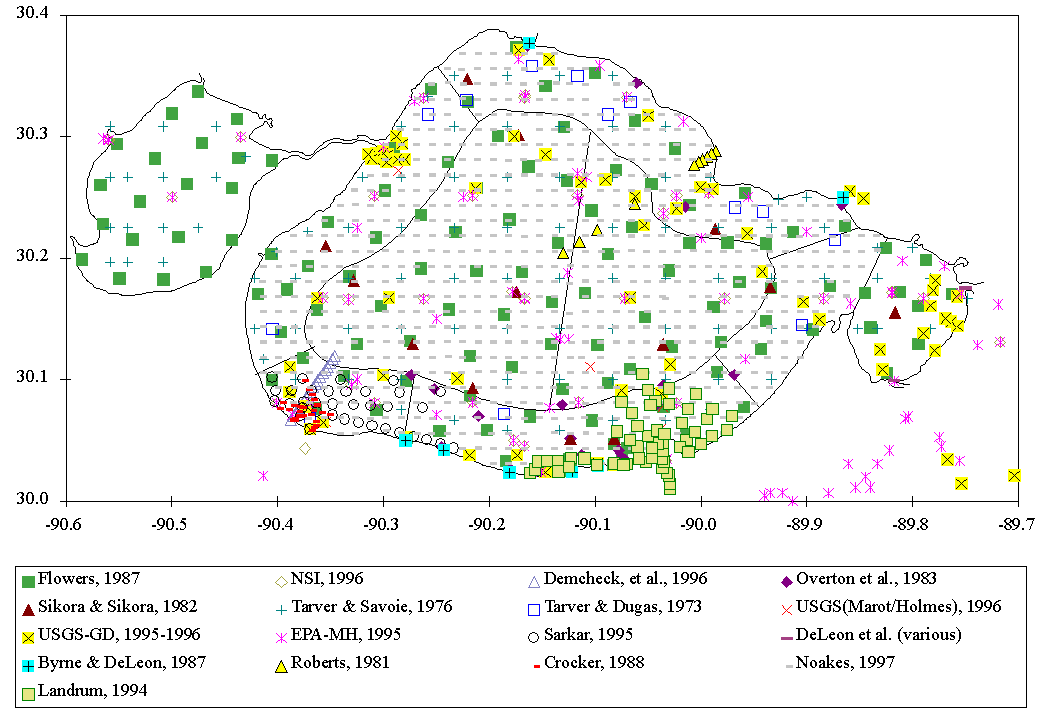
Figure 4. Map showing sample locations and sources (click on image for a
larger view) |
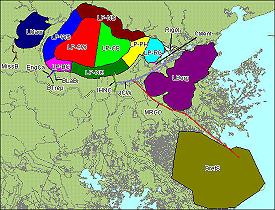
Figure 5. Map showing areas in "AREA_CODE" field (click
on image for a larger view, code descriptions, and download) |
The database in Appendix D contains data from the following
sources:
Source |
Agency/Organization |
Byrne
and DeLeon, 1986 |
UNO/USACE |
Byrne
& DeLeon, 1987 |
UNO/LDEQ |
Childers,
1985 |
LDNR-CZMD |
Crocker,
1988 |
UNO |
Demcheck,
et al., 1996 |
EPA |
Dunbar,
et al., 1995 |
USACE |
Ferrario,
et al., 1985 |
UNO/USACE |
Flocks,
1998 |
USGS |
Flowers,
1987 |
Tulane
University |
Landrum,
1994 |
LDEQ |
LDEQ,
1989 |
LDEQ-OWR-WPCD |
Macauley,
J.M. and J.K. Summers, 1998 |
US
EPA |
McFall,
et al., 1985 |
UNO/USACE |
Roberts,
1981 |
LSU |
Sarkar,
1995 |
Tulane
University |
Schurtz
& St. Pé, 1984 |
LDEQ |
Sikora
& Sikora, 1982 |
USACE |
Tarver
& Savoie, 1976 |
NMFS |
Tarver
and Dugas, 1973 |
NMFS |
Voyksner,
1985 |
LDEQ |
| A numerical index grid (Fig. 6) is included in
the database (Appendix C and D)
for analysis purposes. This index provides a convenient way to search on data from
specific localities covered by the database. Sorting of the sediment data in spreadsheet
form by grid number and specific chemical parameters have been used to compare group data
from independent sources for specific local areas as a part of data quality screening.
Indexing may be helpful when the presently available sediment data are combined with other
information, such as biological data or toxicity measurements. |
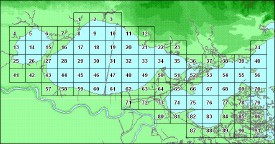 Figure 6. Map showing numbered grid squares
in "AREA_CD_SQ" field (click on image for a larger view and download
opportunity) |
|