National Assessment of Coastal Vulnerability to Sea-Level Rise:
Preliminary Results for the U.S. Atlantic Coast
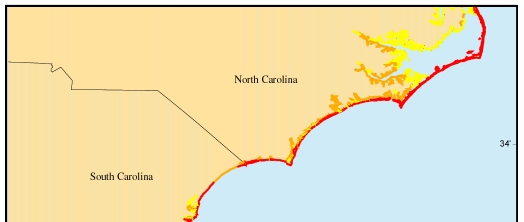
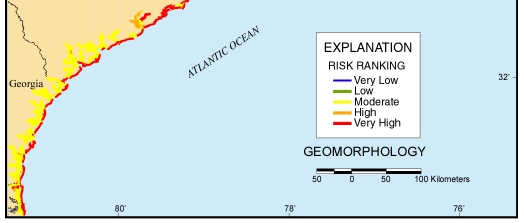
Figure 9. Map of the geomorphology variable for the the North Carolina to Georgia region. Like the New York to New Jersey region, geomorphology is still the dominant variable influencing the coastal vulnerability Index (CVI) values.
 |
 |
| Contents | Back to Top | Title Page |
| Introduction | Risk Variables |
Data Ranking |
CVI | Results | Discussion | Summary | References |
|
Web Page by
Donna Newman [an error occurred while processing this directive] |